Fear of physicians, injections, operations, the operation theatre and the forced separation from parents make the operative experience more traumatic for young children and can cause nightmares and postoperative behavioural abnormalities. Preanaesthetic medication may decrease the adverse psychological and physiological sequelae of induction of anaesthesia in a distressed child1. An important goal of premedication is to have the child arrive in the operating room calm and quiet with intactcardiorespiratoryreflexes. Various drugs have been advocated as premedication to allay anxiety and facilitate the smooth separation of children from parents. The idealpremedicantin children should be readily acceptable and should have a rapid and reliable onset with minimal side effects. Midazolam has sedative and anxiolytic activities, provides anterograde amnesia, and has anticonvulsant properties2. Ketamine, on the other hand, provides well-documented anaesthesia and analgesia. It has a wide margin of safety, as the protective reflexes are usually maintainedOral premedication with midazolam and ketamine became widely used inpaediatric anaesthesiato reduce emotional trauma and ensure smooth induction. It provided better premedication than either oral ketamine or midazolam alone4, but excessive salivation and hallucination were observed5.
Dexmedetomidine is a highly selective α2-adrenoreceptor agonist drug. Clinical investigations have demonstrated its sedative, analgesic and anxiolytic effects after IV administration to volunteers and postsurgical patients6. It has been used to sedate infants and children during mechanical ventilation and also to sedate children undergoing radiological imaging studies,8In the literature, few articles have used dexmedetomidine orally for the premedication of children. The purpose of this study is to evaluate the efficacy of dexmedetomidine when administered orally as a hypnotic and anxiolytic agent compared to oral combination ketamine/midazolam as preanaesthetic medication in paediatrics.
Methods:
The Hospital Ethics Committee approved the protocol. Written informed consent was obtained from parents prior to inclusion. Sixty six children of ASA physical status I or II, aged between 2 and 6 years and scheduled for elective minor surgery of more than 30 minutes expected duration were enrolled in this prospective, randomized, double-blind study. Exclusion criteria were: a known allergy or hypersensitivity reaction to any of the study drugs, organ dysfunction, cardiac arrhythmia or congenital heart disease, and mental retardation.
Children were randomly allocated to one of the two study groups using computer-generated random numbers. Group D received oral dexmedetomidine 3 μg/kg and group MK received 0.25 mg/kg oral midazolam (up to a maximum of 15 mg) with 2.5 mg/kg oral ketamine. The oral premedication was mixed with 3 ml of apple juice as a carrier to be given thirty minutes before induction of anaesthesia. The oral route was chosen as it is the most acceptable and familiar mode of drug administration. An independent investigator not involved in the observation or administration of anaesthesia for the children prepared all study drugs. Observers and attending anaesthetists who evaluated the patients for preoperative sedation and emergence from anaesthesia were blinded to the drug administered. Children had premedication in the preoperative holding area in the presence of one parent. All children received EMLA cream unless contraindicated.
After drugs were administrated, the following conditions were observed: 1) response to drug and onset of sedation, 2) response to the family separation circumstance and the entrance to the operating room, 3) response to the venous line (IV) insertion, 4) ease of mask acceptance during induction of anaesthesia. The time to recovery from anaesthesia and to achieve satisfactory Aldrete score were also noted. Onset of sedation was defined as the minimum time interval necessary for the child to become drowsy or asleep.
Sedation statuswas assessed every 5 min for up to 30 min with a five-point scale. A score of three or higher was considered satisfactory. In addition anxiolysis was assessed on a four-point scale. An anxiety score of three or four was considered satisfactory. Cooperation was assessed with a four-point scale. A cooperation score of three or four was considered satisfactory. Taste acceptability was evaluated on a four-point scale. A score of 1–3 was considered satisfactory.
Score
Sedation
Anxiolysis
Cooperation
Taste
1
Alert/active
Poor
Poor
Accepted readily
2
Upset/wary
Fair
Fair
Accepted with grimace
3
Relaxed
Good
Good
Accept with verbalcomplaint
4
Drowsy
Excellent
Excellent
Rejected entirely
5
Asleep
Heart rate, blood pressure, respiratory rate and arterial oxygen saturation were recorded before premedication, every five minutes for 30 min preoperatively, and then during induction of anaesthesia, every 5 min intra-operatively, every 15 min in recovery room and every 30 min in day-case unit until time of discharge.
The anaesthetic agents administered were standardized.Children were induced with sevoflurane, nitrous oxide in oxygen and fentanyl 1-2 µg/Kg and maintained with the same drugs. The trachea was intubated after administering cisataracurium 0.1 mg/kg.
At the end of the procedure, the neuromuscular blockade was reversed with neostigmine with glycopyrolate and the child was extubated. After that, they were kept in the recovery room (PACU) under observation until discharge. The time to recovery from anaesthesia and to achieve satisfactory Aldrete score were noted. The discharge time was also noted and postprocedure instructions were given. Children were called for checkups the following day, when parents were asked to answer a questionnaire about the surgical experience of the parent and child and side effects experienced, if any.
Statistical analysis was performed using SPSS version 17. All values were reported as mean ± SD and range. Data analysis for numerical data was performed by unpaired Student’s t-test to detect the differences between the groups for age, weight, onset of anxiolysis and sedation. Data analysis for categorical data was performed by Fisher’s exact test to detect differences for the scores. Other data are reported as mean ± SD or frequency (%). A P value < 0.05 was considered statistically significant. Prior to the study, we chose the null hypothesis (i.e. nosignificantsedation scores between the groups). The number of patients required in each group was determined using power analysis based on previous studies. Assuming that 79% of patients would become drowsy or asleep in the midazolam/ketamine group (15 patients), a sample size of 30 patients per group would have an 80% power of detecting a 20% difference in sedation (from 79% to 99%) at the 0.05 level ofsignificance. We decided to study 66 patients to account for possible dropouts.
Results:
Sixty-six patients were enrolled; four did not receive the study medication and two did not have surgery on the same day, leaving 60 subjects who fulfilled the criteria for the study.Groups were comparable regarding age, sex, weight, ASA physical status, surgical interventions and duration of anaesthesia (Table 1). Operative procedures were evenly distributed and included inguinalherniorrhaphy, hydrocele repair or orchidopexy.
Table 1: Demographic characteristics and duration of anaesthesia:
Group D
Group MK
No of patients
33
33
No of patients excluded
4
2
Age (years)
4.02±1.98
4.2±1.45
Gender (female/male)
13/16
15/16
ASA (I/II)
25/4
25/6
Weight (Kg)
17.72±4.4
16.56±5.1
Duration of Anaesthesia (min)
35.17±5.9
32.7±8.4
Data are expressed as mean ± SD (range). P > 0.05. No significant difference among groups. Dex group (D). Midazolam Ketamine group (MK). ASA, American Society of Anesthesiology physical status.
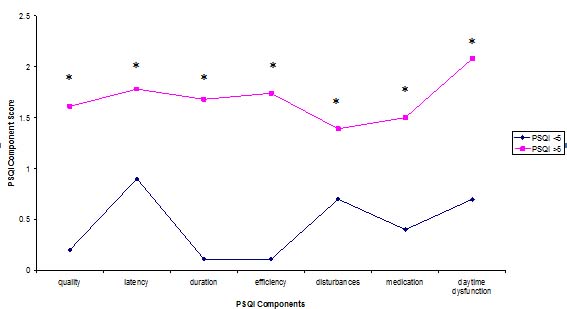
Onset of sedation was significantly faster after premedication with midazolam/ketamine (Fig1), and the level of sedation was significantly better after premedication with midazolam/ketamine 30 minutes after ingestion of the premedicant.
The anxiolysis score revealed 84 % of children in group MK as being friendly and only 51% of children in group D have similar behaviour (Table 2). The taste of oral dexmedetomidine was judged as significantly better; 13% of children rejected the oral midazolam/ketamine combination (Table 2).
Table 2: Distribution of behaviour and sedation status at time of induction:
Group D
Group MK
P
Time to onset of sedation (min)
24.52 ± 3.1
18.36 ± 2.6
0.015*
Preoperative sedation score
1.6±0.5
3.1±0.8
0.003*
% asleep at induction
61%
90%
0.024*
Preoperative anxiolysis score
1.4±0.6
2.9±0.7
0.016*
% Face mask acceptance
58%
88%
0.033*
% Venous line insertion acceptance
72%
90%
0.005*
% Satisfactory parental separation
50%
80%
0.04*
% Parental satisfaction
70%
90%
0.036*
% Taste acceptance
97%
87%
0.002*
Data are expressed as mean ± SD (range) or percentage. Dex group (D). Midazolam Ketamine group (MK). * significantP <0.05.
Application of a facemask at induction of anaesthesia was accepted more readily in patients of group MK (Fig 2).Overall, satisfactory cooperation with venous line insertion was found in 90% of children in group MK, while comparatively 72% of children in group D showed satisfactory cooperation with insertion of a venous line (Table 2). Moreover, most of the MK treated children were more calm and sedated than the D-treated group at the time of separation from parents. Parental satisfaction was significantly higher in group MK.
The time interval from end of surgery to spontaneous eye opening in the PACU was significantly less in group D (Fig 1), while the time to discharge from the PACU to ward was similar for groups (Table 3).
Table 3: Time to eye opening and PACU discharge
Group D
Group MK
P
Time to eye opening (min)
21±4.3
30±6.1
0.032*
Time of PACU discharge (min)
30± 3.9
28.12±5.5
0.316
Data are expressed as median ± SD (range). Dex group (D). Midazolam Ketamine group (MK). * significantP < 0.05.
While no child experienced respiratory complications or arterial oxygendesaturationbefore induction, heart rate and systolic blood pressure were marginally higher after administration of MK. On the other hand, the mean heart rate and systolic blood pressure measurements were 15% lower (than preoperative values) in group D at the same study periods. However, during recovery, haemodynamic responses were similar.
Adverse events were recorded for the three periods. Two children in group MK as well as one in group D experienced nausea but only one patient in group MK vomited before induction. Hallucination was recorded in 10 % of patients in group MK. Excessive salivation occurred in 12% of children receiving the combination of drugs, compared to 7% in D-treated children.
Discussion:
Our study proved that midazolam/ketaminereceiving patients were significantly calmer and more cooperative compared to dexmedetomidine receiving patients during the preoperative period, the insertion of a venous line, during separation from parents and also during the application of a facemask at induction. Several studies have been published demonstrating the advantage of the midazolam/ketamine combination in paediatric premedication4,9, while others have reported superiority of oral dexmedetomidine premedication to oral midazolam10,11.
Based on their experience with using oral dexmedetomidineas a preanaesthetic in children, Kamal et al10 and Zub et al 12 reported that the dose of 3 μg/kg could be safely and effectively applied without haemodynamic side effects.
Midazolam is currently the most commonly usedpaediatric premedication due to easy application, rapid onset, short duration of action and a lack of significant side effects13. Meanwhile oral ketamine was used in the 1970s by dentists to facilitate the treatment of mentally handicapped children. In 1982, Cetina found that rectal or oral preanaesthetic ketamine is an excellent analgesic and amnesic agent with no incidence ofdysphoric reactions, possibly related to its high rate of first-pass metabolism14. The metabolite norketamine has approximately one-third the potency of ketamine, but reaches higher blood concentration and also causes sedation and analgesia 15. The use of midazolam and ketamine in combination as a premedicant combines their properties of sedation and analgesia and attenuates drug induced deliriumGhai et al and Funk et al have also reported that a combination of midazolam and ketamine results in better premedication than the individual drugs given alone4,9.
Like clonidine, dexmedetomidine possesses a high ratio of specificity for the α2 versus the α1 receptor (200: 1 for clonidine and 1600: 1 for dexmedetomidine). Through presynaptic activation of the α2 adrenoceptor, it inhibits the release of norepinephrine and decreases sympathetic tone. There is also an attenuation of the neuroendocrine and haemodynamic responses to anaesthesia and surgery, thereby leading to sedation and analgesia16. One of the highest densities of α2 receptors has been detected in the locus coeruleus, the predominant noradrenergic nucleus in the brain and an important modulator of vigilance. The hypnotic and sedative effects of α2-adrenoceptor activation have been attributed to this site in the CNS16. This allows psychomotor function to be preserved while letting the patient rest comfortably, so patients are able to return to their baseline level of consciousness when stimulated17. Clonidine and dexmedetomidine seems to offer the beneficial properties, but dexmedetomidine has a shorter half-life, which might be more suitable for day surgery. Zuband his colleagues reported that dexmedetomidine may be an effective oral premedicant prior to anaesthesia induction or procedural sedation and it was effective even in patients with neurobehavioural disorders in whom previous attempts at sedation had failedAlso Sakurai et al reported that oral dexmedetomidine could be applied safely and effectively as a preanaesthetic in children18.
While dexmedetomidine is tasteless and odourless17 , with 82% bioavailability after extravascular doses in healthy human adults19, oral midazolam formulations have a bitter taste and were usually prepared by mixing the IV midazolam with a variety of sweet additives. In our study, children judged the taste of oral dexmedetomidine as significantly better than oral midazolam ketamine mixture, although both drugs were given with the same sweet tasting syrup. This observation probably might also reflect the developmental age of these patients and the difficulty of gaining their cooperation in swallowing something that they did not wish to swallow. Recently, new commercially prepared oral midazolam formulations are reported to be more palatable20, but unfortunately, it is not available yet in our country.
Our data confirmed that onset of sedation and peak sedative effect was significantly slower after oral dexmedetomidine compared to oral midazolam ketamine. These results are consistent with studies by Kamal et al and Schmidt et al who reported slow onset of action of oral dexmedetomidine,21In addition, Anttila et al reported that, in adults after oral administration, peak plasma concentration is achieved at 2.2 ± 0.5 h after a lag-time of 0.6 ± 0.3 h19.
In this study, dexmedetomidine premedication with the present study design resulted in slight hypotension and bradycardia, which could be attributed to postsynaptic activation of α2 adrenoceptors in the central nervous system (CNS) that inhibit sympathetic activity and thus can decrease blood pressure and heart rate22. In a finding consistent with our results, Khan et al and Aantaa et al reported that useofdexmedetomidine can beassociatedwithsome cardiovascular side effects including hypotension and bradycardia,24Conversely, Ray and Tobias did not find significant haemodynamic changes when used dexmedetomidine in providing sedation during electroencephalographic analysis in children with autism and seizure disorders25.
There were some limitations to this study; the bioavailability of oral dexmedetomidine is based on the adult dataWe need to decide the timing of the oral administration as apremedicantbased on the data in children. Therefore, the bioavailability of oral dexmedetomidine needs to be studied in children. The premedication period was 30 min, however, if a longer premedication period had been allowed, possibly more subjects could have attained satisfactory sedation at separation from parents and at induction of anaesthesia.
Conclusion:
In this study, premedication with oral midazolam/ketamineappeared to be superior to oral dexmedetomidine with evident haemodynamic stability and a higher degree of parental satisfaction demonstrated, although oral dexmedetomidinewas more accepted by the children. No significant side effects were attributable to either premedication. Emergence from anaesthesia was comparable between groups.
Payment by results was introduced across the National Health Service (NHS) in 2005. It’s aim was to provide a pricing structure (tariff) for the whole country with some allowance for geographical variation1-2. The system uses Healthcare Resource Group codes (HRG) in which treatments in similar cost brackets have the same codeA price / tariff is derived from each hospital patient episode and the patient’s registered Primary Care Trust (PCT) is billed accordingly.
In order to generate an HRG code data is collected by the hospital clinical coding department including primary diagnosis, comorbidity (which incurs an extra charge if applicable), and complications, surgical procedure, age and duration of stay4. Diagnoses (either primary, co morbidities or complications) are coded using ICD-10 codes. Surgical procedure is defined using OPCS-4 codesA piece if software is then utilised to allocate the HRG code. Each HRG code represents a tariff, which is the average cost of a treatment nationwide. Minor regional adjustments are made to reflect the cost of living2.
Payment by results covers all admissions, attendance in accident & emergency departments and outpatients attendances5. The 2004 NHS Improvement plan designated 18 weeks as a target for referral to treatment (RTT)6. It is a common misconception that trauma patients do not account for considerable income within the NHS. Trauma is often seen as the poor relation when compared with elective work where a target based culture now prevails. Elective targets must be met or hospital trusts can incur financial penalty. This situation is not apparent for trauma due to the acute nature of service delivery in the majority of cases. The burden of trauma work can block elective admissions and is seen by some as a barrier to target attainment. At least 36% of orthopaedic surgeons in the United Kingdom describe trauma as part of their sub-specialist interestWe aimed to assess the throughput and income generated from one week of trauma workload and compared this with the elective throughput in our unit for the same week. This was performed by means of a prospective study. We are not aware of any published work in this specific area.
Methods:
We followed all acute patients admitted to our trauma unit between 21/02/2008 and 28/02/2008. This represented a “trauma week” which is how the consultant rota is organised in our trust. We then compared this with the throughput in our elective unit for the same calendar period. No surgeons were on leave this week and no theatre sessions were cancelled other than the on call trauma consultant’s elective operating sessions. Our trust is a busy district general hospital with over 500 beds and approximately 55,000 emergency attendances per year. The orthopaedic directorate is staffed by ten full time consultants and serves a population of 315,000 patients.
All patient details were recorded prospectively and followed until the end of their inpatient episode. Case notes were then reviewed with the coding department and ICD-10 and OPCS-4 codes were generated. Their length of stay and other required variables were reviewed in order to generate the correct HRG code. Once the analysis was complete income for the trauma and elective groups were calculated.
Results:
Trauma:
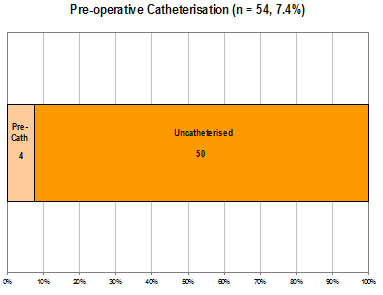
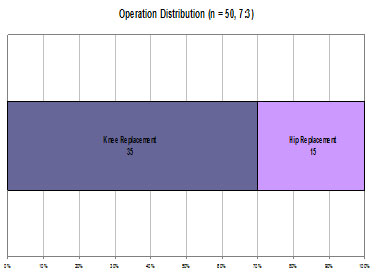
48 patients were admitted (22 male) of which 36 required operative intervention. This utilised 14 theatre sessions. Mean age was 53.75 years (range: 7-93, median: 59). Median stay was 4 days with a mean of 13.3. The median and mean trim points (expected duration of stay before extra charges incurred by PCT) were 14.5 and 26.7 days respectively. Other consultants operated on 6 patients. This was either due to expertise in a specific area or space on an elective list utilised to reduce backlog. The income generated by these cases is included in the trauma total due to them being acute trauma interventions rather than elective cases. These results are summarised in tables 1 and 2.
Table 1: Demographic & Income Data of Trauma and Elective Patients
Trauma
Elective
Median age (yrs)
59
47
Number of Patients
47
71
No of Males
26
30
Median stay (days)
4
1
Range of stay (days)
1 – 107
1 - 7
Total bed days
637
118
Estimated Bed Costs (£)
203,840
26,550
Mean income per pt (£)
3658.32
2117.15
Total Income (£)
171,941
150,318
Table 2: Income by Anatomic Region
Trauma
Elective
Length of stay (median) days
No of pts
Total income (£)
Mean income per patient (£)
Length Of Stay (median) days
No of pts
Total income (£)
Mean income per patient (£)
Upper limb
1
18
32,455
1,803
1
9
11,469
1,274
Spine
1
5
10,327
2,065
0
34
44,887
1,320
Hip
26
13
90,891
5,494
4
12
43,660
3,638
Knee
5
5
19,576
3,915
2
12
45,434
3,786
Foot and ankle
6
7
18,692
2,670
1
4
4,868
1,217
Total
47
171,941
3658
71
150,318
2117
Of the 48 patients admitted 12 required no operative intervention. These cases were general ‘run of the mill’ admissions such as soft tissue infections for intravenous antibiotics, undisplaced fractures where home circumstances obstructed discharge, soft tissue injuries for further investigation and back pain. These will not be discussed further but the income generated (£31,127) does go towards the total. The median stay was 2 days with a mean stay 8.5 days (range: 1 – 47). This reflects the broad comorbidities and social circumstances of this subset.
The group requiring operative intervention included hip fractures (11 patients). Of these, seven required dynamic hip screw fixation but were deemed “complex” due to their comorbidities and therefore attracted the higher tariff rate (£6685). One displaced intracapsular fracture required total hip replacement, attracting a tariff of £7261. One patient required revision from a dynamic hip screw to an intramedullary device and then revision to a total hip arthroplasty. The tariff price was £19,479. The remaining fractured neck of femur patients attracted between £4379 and £6711 dependent on operative procedure. The median stay was 26 days (mean: 14, range 9 – 107). One patient required closed manipulation of a dislocated total hip replacement attracting a tariff price of £1034 and an inpatient stay of one day. In addition one acetabular fracture was sustained requiring open reduction and internal fixation. It attracted a tariff price of £4262 and an inpatient stay of seventeen days.
One patient required open reduction and internal fixation of a patella fracture attracting a tariff of £2405 and was an inpatient for 10 days. Another patient with septic arthritis required two arthroscopic knee washouts, attracting a tariff of £5941 and was an inpatient for 26 days.
Seven ankle fractures were admitted requiring operative intervention, all of these attracted a tariff of £2405 except one, which attracted £4262 due to co morbidity and complexity of injury. The median stay in this group was six days (mean: 4.9, range: 2-7).
Thirteen patients sustained hand and wrist injuries requiring operative intervention. Of these there were two tendon repairs, two abscesses drained and one digital terminalisation. Five wrist fractures required either manipulation and plaster application, closed reduction and Kirschner wiring or open reduction and internal fixation by means of a volar plate. Three fractures of the base of the thumb were manipulated and percutaneously K-wired. These patients attracted a tariff of between £1048 and £3227. Median stay was one day (mean: 1.36, range: 1 – 3). Three of these cases were managed by our hand surgeon on a trauma list.
One patient admitted with cauda equina syndrome required microdiscectomy attracting a tariff of £1271 and was an inpatient for one day. This was performed by one of our spinal surgeons on a trauma list.
Elective:
71 procedures were performed (36 female). This utilised 22 theatre sessions. Mean age was 49.51 years, (11 – 87 median: 47). Mean stay was 2.3 days. The median and mean trimpoints were 2 and 6.35 days respectively. Cases were divided by anatomical region. A table of income for both trauma and elective patients by anatomical region is included (Table 2).
Twelve patients had hip procedures performed. These included hip injections (n=2, tariff £615), sciatic nerve exploration (n=1, tariff £1217), cemented total hip arthroplasty (n=2, tariff £4304), uncemented total hip arthroplasty (n=1, £5305), resurfacing hip arthroplasty (n=5, £4023) and revision hip arthroplasty (n=1, £7185).
Twelve patients had knee procedures performed. These consisted of total knee replacements (n=3, tariff £5613), unicompartmental knee replacements (n=4, £5613), one anterior cruciate ligament reconstruction (£1863), knee arthroscopies (n=2, tariff £1063), one removal of metal work (tariff £1063) and one scar revision (tariff £1091).
Four patients had foot and ankle procedures performed and these all attracted £1217 tariff price. They consisted of one ganglion excision, one hallux valgus correction, one excision of Morton’s neuroma and one ankle arthroscopy.
Nine patients had upper limb procedures performed. These comprised carpal tunnel decompression (n =1 £1217), radial head excision (n=1 £1217), shoulder stabilisations (n=3 £1217), subacromial decompression (n=1 £1217), acromiclavicular joint excision (n=1 £1063), diagnostic shoulder arthroscopy (n=1 £1217) and arthroscopic cuff repair (n=1 £1887).
34 patients had spinal procedures performed. Inpatient stay ranged from 0 to 5 days with trimpoints of 1 – 13 days. These ranged from nerve root injections (n=23, tariff £522), discography (n=3, tariff £615), microdiscectomy and interspinous distraction (n=2, tariff £3192), decompression, fusions and instrumentation (n= 5, tariff £4252 - £5140), and kyphoplasty (n=1, tariff negotiated: no HRG code. Income £1506). Total income for the spinal group was £44,887.
It can be seen from the data that a wide range of trauma and elective surgery was performed and that the elective group was admittedly younger and had a shorter hospital stay (Table 1). Our unit has the benefit of two spinal surgeons who operate a local and tertiary practice, which changes the demographic of our cohort slightly; other units may not have this factor adjusting their income.
The tariff income for the elective group was £150,318, which was lower than that for the trauma group of £171,941.
Discussion:
This paper is, as far as we are aware the first to compare elective and trauma orthopaedic throughput in a busy district general hospital. It would be bold not to draw attention to our studies limitations. We analysed only one week in the financial year and we accept that seasonal variation may occur. The weather for the week in question involved no snow or ice and was warmer than average for this time of year (5.2°C)10. We do not feel that severe weather influenced our admissions. Previous studies have assessed the effect of seasonal variation on admissions rate. One was in a winter sports resort in Switzerland and unsurprisingly showed a positive correlation between season and fracture incidence11. Another study based in Tasmania showed no variation in either vitamin D levels or incidence of femoral neck fracture12. This goes against the findings of a study based at three latitudes, which showed a high seasonal peak in Scotland, Hong Kong and New ZealandOur locality has a temperate climate with no local winter sports resorts; our experience of seasonal variation is minor.
Miscoding and therefore error in calculations may have occurred; as both the authors and experienced coders reviewed the casenotes the likelihood of this is limited.
Our most important finding was that the mean income per trauma patient (£3658.32) was higher than that for an elective patient (£2045.13) and was statistically significant (p=0.001). The HRG code and income generated represents the money actually received by the hospital from the primary care trust. We openly admit that trauma patients represent a larger burden for the hospital. They have a tendency to be older, have complex co-morbidity and have increased length of stay. They are therefore more costly than elective patients. One study performed in a large university hospital calculated the mean cost for a hip fracture to be £8978.56 (range £3450 - £72,564), this rose to £25,940.44 if there was a superficial wound infection (range £4387 - £93,976) and £34,903 if there was a deep infection (range £9408 - £93,976)14.
Although actual income from the PCT was higher the trauma group will have been loss making on account of the hip fracture group. Whilst this is hard to quantify it seems likely given the calculations portrayed in the Nottingham study of 3686 patientsInpatient costs for the trauma group ignoring theatre costs amount to approximately £204,000. This exposes a lack of appreciation of this group’s requirements in comparison with fit elective hip patients and probably inequality in trauma coding for these patients.
Our study has not tackled implant costs partly due to the fact that inpatient costs have significantly dwarfed these but also due to the fact that we consider these a relatively fixed overhead, costs being determined by local bulk purchase agreements. The consequence on overall study outcome would be minimal given that trauma implants are several orders of magnitude cheaper than elective joint prostheses.
It became apparent to us during the course of our study that trauma can be under resourced when compared with elective care. The background team currently provided for trauma patients include the on call medical team (Consultant Orthopaedic Surgeon, Specialist Registrar and Senior House officer). In addition there are ward nursing staff, anaesthetist, theatre staff, occupational therapists and physiotherapists. On the elective side there are 4 waiting list clerks, 3 surgical assistants, 3 preoperative clinic sisters as well as reception staff and the background medical team (anaesthetist, consultant orthopaedic surgeon, specialist registrar and senior house officer). In the elective setting the aim is identification and optimisation of comorbidities pre-operatively and discharge planning to ensure throughput and turnover of patients. We admit that pre admission screening is not applicable to trauma but faster throughput could ensure improved efficiency and reduced duration of stay.
Our elective patients have a 30-bed ward with an additional 8-bed day case unit; the trauma ward has 24 inpatient beds. The elective unit has 7 registered nurses and 4 health care assistants; on the trauma ward this figure is 4 and 3 respectively. Our elective patients have 2.5 full time equivalent physiotherapists whilst our trauma patients have 1.5.
This situation is probably not dissimilar to the situation in many units elsewhere in the country. This work has shown that trauma income is higher than that for elective work and from this we can infer that if resources were directed accordingly then length of stay could be reduced and profit could be a possibility. A recent paper using hospital episode statistics (HESS) data has shown that length of stay fell quickly once payment by results was implemented15. What was unclear was whether this represented a real change in efficiencies or simply a change in data manipulation by trusts. HESS data has repeatedly been noted to be inaccurate with a range from 10 to 98% dependent on region and disease group.16-17. In a 2006 statement by the then Health Minister Mr. A Burnham it was quoted that £88m pounds was being wasted from 390,000 extra unnecessary bed days18. This was based on the cost of an elective bed being £225 per day with acute beds being significantly more (approximately £320 in one study)The total stay for 66 elective patients was 118 days whereas that for 48 trauma patients was 637 days. Several outliers hugely increased the figure for trauma. Ten trauma patients represented 464 days of inpatient care. If the inpatient stay was reduced by one day for fractured neck of femur patients alone, this amounts to 500 less days per year and approximately £160,000 per year reduction in overhead costs for the trust.
One study in the USA assessed the use of a caseworker to expedite discharge for elderly patients with hip fractures19. The study did not utilise extra physiotherapy and occupational therapy support. Findings were increased theatre, anaesthetic and blood product costs in elderly patients. Increasing age did not correlate with length of stay, cost of stay or income for the hospital. They found that a case manager did reduce the average stay but did not reduce the overall cost. The NHS would do well to note these findings - in many trusts patient flow practitioners are being employed to try and expedite discharge and increase patient turnover. We feel that this money could be channelled into rehabilitation services to effect prompt rehabilitation and discharge.
One final issue is the variation in income between secondary and tertiary centres for certain injuries. One acetabular fracture underwent fixation generating £4262. If this had been referred to a tertiary centre a supplementary specialised service code would have been applicable generating more income (up to 70% in some cases) when intervention was identical. We agree that certain injuries require tertiary treatment by a team with high volume experience and specialised skills. There is an income chasm between the income generated between secondary and tertiary centres for the same injury, which seems perverse.
Overall trauma income was higher than elective income, but still ran at a loss. This was on account of the length of stay of the hip fracture patients and current coding underestimating their true cost to the trust. There is a disparity between rehabilitation services provided for trauma and elective patients, which needs to be addressed to improve efficiency.
The Royal College of Psychiatrists defines the 'graduates' as people who have had enduring or episodic severe mental disorder in adulthood and have reached the age of 65 years. Estimates of the most severely affected range from 11 to 60 per 100 000.1 This group of people seems to be uniquely disabled by a combination of social, mental health and physical disadvantages and there is a risk of falling between general adult, rehabilitation services and old age psychiatry.2
There has been an ongoing debate about identifying the best practice in the management of this group of patients who often have spent most of their lives in the old psychiatric asylums. The recommendations include identifying all graduates within the service followed by a full assessment of the patients' health and social care needs and the implementation of a care plan to meet these needs, to be reviewed at least annually. According to the report, the medical responsibility will rest with a principal in general practice or a consultant psychiatrist, and maintenance of continuous review should be the responsibility of the case manager.1
The Recovery and Rehabilitation Team (RRT) in Newham was founded in 1988 to facilitate the discharge of groups of patients from Goodmayes hospital (Essex). Patients discharged to residential care units and other supported schemes usually had spent many years in the institution and the team's remit after relocation into the community was mainly monitoring of mental health by conducting multiprofessional reviews in the care homes, crisis intervention, and the promotion of social networks and leisure activities. Over the following years, the team also received many referrals from Community Mental Health Teams (CMHT) for continuing care of people suffering from long term and severe mental illness. Today, a considerable proportion of these patients have 'graduated' into old age and the current percentage of the total caseload is now nearly 25%.
Our survey was carried out following an independent review by the Health and Social Care Advisory Service (HASCAS) in January 2005 for the rehabilitation services provided in the London Borough of Newham. The recommendations included an assessment of needs for all patients 65 years of age or over, using the Camberwell Assessment of Needs for the Elderly (CANE) .3This is a comprehensive needs assessment tool suitable for use in a variety of settings. It has been successfully used for older people in primary care, sheltered accommodation, residential homes, nursing homes, and mental health services for older people. However, it has not been used before to specifically assess the needs of older people who have graduated within the general adult mental health or rehabilitation services. CANE was found to be a valid and reliable tool and easy to use by different professions.4
Method:
The RRT database was searched for all patients aged 65 years or over. This yielded 52 names, who were then approached between June and September 2005 for a comprehensive assessment after an explanation about the survey. CMHTs were asked for numbers of graduates in their services, obtained from the respective databases.
The CANE is a structured, 24-item questionnaire covering different areas (see table 2), including social, psychological, mental health and physical needs. It is easily applicable by different professions and requires on average about one hour of assessment time. It measures met and unmet needs and obtains views from patients, carers, staff and the rater. Assessments were carried out by members of the multi-disciplinary team that consists of a consultant psychiatrist, the team manager, two senior clinical medical officers, two clinical psychologists, two occupational therapists, two social workers, five community psychiatric nurses and four community support workers. All raters had received a one day training provided by Juanita Hoe, one of the contributors in producing the CANE.
The collected data were analysed using Microsoft Excel.
Results
The total number of patients aged 65 years and above under the care of the rehabilitation services was 52 (24.5% of the total caseload of 212 patients). There were a further ten patients under the care of the adult CMHTs in Newham. Attempts were also made to determine the number of the graduates under the care of mental health services for older people, but these were unsuccessful.
Out of the 52 patients, 50 could be assessed using the CANE, two patients declined the assessment and the assessment sheet of one patient could not be traced, giving a total of 49 patients and a response rate of 79% of all known 'graduate' patients under the care of adult mental health services.
Results describing patient characteristics including mean age, gender, type of accommodation and diagnosis, are summarized in Table 1.
Table: 1 Demographic Details
Variable
Mean Age (years)
72.16
Gender (n(%))
Female
16(32.65%)
Male
33(67.34%)
Type of accommodation (n(%))
Residential care
25(51%)
Supported accommodation
13(26.53%)
Private accommodation
12(24.48%)
Diagnosis (n(%))
Schizophrenia
33(67.34%)
Schizoaffective Disorder
6(12.24%)
Bipolar Affective Disorder
5(10.20%)
Depression
2(4.08%)
Personality Disorder
1(2.04)
OCD
1(2.04%)
Dysthymic Disorder
1(2.04%)
Nearly two-thirds of patients were female, three-quarters of this population were living in supported living or residential care and 90% were suffering from a severe mental illness (two-thirds from schizophrenia).
The met and unmet needs of this population are described in table 2.
Table 2: Levels of needs as rated by the rater (n=49)
Item
No Need
Met Need
Unmet Need
Not Known
n
(%)
n
(%)
n
(%)
n
(%)
Accommodation
22
44.90%
22
44.90%
2
4.08%
3
6.12%
Household skills
5
10.20%
41
83.67%
3
6.12%
0
0.00%
Food
9
18.37%
34
69.39%
6
12.24%
0
0.00%
Self-care
12
24.49%
31
63.27%
6
12.24%
0
0.00%
Caring for other
47
95.92%
2
4.08%
0
0.00%
0
0.00%
Daytime activities
16
32.65%
14
28.57%
18
36.73%
1
2.04%
Memory
34
69.39%
4
8.16%
5
10.20%
6
12.24%
Eyesight/hearing
24
48.98%
14
28.57%
10
20.41%
1
2.04%
Mobility
26
53.06%
18
36.73%
5
10.20%
0
0.00%
Continence
28
57.14%
16
32.65%
3
6.12%
2
4.08%
Physical health
14
28.57%
29
59.18%
6
12.24%
0
0.00%
Drugs
17
34.69%
30
61.22%
2
4.08%
0
0.00%
Psychotic symptoms
18
36.73%
28
57.14%
3
6.12%
0
0.00%
Psychological distress
29
59.18%
14
28.57%
6
12.24%
0
0.00%
Information
28
57.14%
11
22.45%
6
12.24%
4
8.16%
Safety(deliberate self harm)
44
89.80%
4
8.16%
0
0.00%
1
2.04%
Safety(accidental self-harm)
35
71.43%
11
22.45%
2
4.08%
2
4.08%
Safety(abuse or neglect)
35
71.43%
10
20.41%
4
8.16%
1
2.04%
Behaviour
32
65.31%
12
24.49%
4
8.16%
1
2.04%
Alcohol
47
95.92%
2
4.08%
0
0.00%
0
0.00%
Company
29
59.18%
8
16.33%
11
22.45%
1
2.04%
Intimate relationship
40
81.63%
3
6.12%
4
8.16%
2
4.08%
Money
21
42.86%
19
38.78%
9
18.37%
0
0.00%
Benefits
37
75.51%
3
6.12%
4
8.16%
5
10.20%
Regarding unmet needs, the highest value (nearly 37%) was on daytime activities, which 18/49 people scored. This is followed by company (22.5%), which was a problem for 11 people. Eyesight or hearing also scored strongly (20.5%), followed by money (18.4%) and different problems in areas such as food and self-care, physical health and psychological distress (each 12%). Problems with suicidal behaviour and drug or alcohol abuse were not evident in terms of unmet needs.
Discussion
Our results show that the majority of needs identified by the CANE were adequately met by the current service provision or were only identified as unmet needs by a tiny minority (table 2). Since the vast majority of the patients were living in either residential or supported accommodation (25.51% and 26.53% respectively), items associated with domestic needs and activities appeared to be met to a great extent, e.g. accommodation (44.90% no need, 44.90% met need).
In terms of items related to mental state, the majority of patients seemed to be satisfactorily managed and receiving appropriate treatment. The raised number of patients who suffered from psychological distress could be explained by other psychosocial factors such as lack of daytime activities and lack of company which have been identified as the major unmet needs in our population.
A recent article,5 named risk of harm, unpredictability of behaviour, poor motivation, lack of insight and low public acceptability as the major reasons for social disability. However, in our review, over one-third of people clearly expressed the wish for more daytime activities, where the named disabilities might prevent a more active and satisfied lifestyle. In the interviews, it transpired that people mostly wished for an outreach service providing social contact, befriending and activities. The majority of people in our population seemed to be rather reluctant to access general facilities, like day centres for the elderly.
As we have assessed most of the patients under the care of adult mental health services, this survey should be able to inform service planning about the needs of this population. The development of an outreach service offering day time activities including a befriending component could be a challenge for the responsible service providers, e.g. social services, adult community mental health services and old age psychiatry.
The specific physical needs (especially eyesight and hearing) make it necessary for services to monitor these closely and implement this in the care plan in liaison with General Practitioners.
Similar reviews should be undertaken by community mental health services in other boroughs to highlight the needs of this specific group of patients, as the respective unmet needs might be dependent upon the level of service provision.
Hyperthyroidism is one of the most frequently encountered conditions in clinical endocrinology.1 The modes of treatment available are antithyroid drugs, surgery and radioiodine (RAI) and although each of these is highly successful in controlling or curing hyperthyroidism none leads to permanent euthyroidism on a consistent basis. 2 Although over the last three decades RAI therapy has replaced surgery as the leading form of definitive treatment 3,4, 5 there is no universally accepted dose or regime for its use. Previous attempts to individualise the dose of RAI to reduce the rate of post-RAI hyper- or hypothyroidism have been unsuccessful 6, 7. Fixed dose RAI administration has therefore become the most commonly used regime although the actual dose of RAI used varies considerably and ranges between 185MBq to 600MBq 8, 9. For the last two decades we have used a fixed RAI dose of 550MBq for all patients. Others have used this regime with a high success rate 10 and a prospective head to head comparison with the calculated dose method found the fixed dose regimen to be superior for curing Graves’ hyperthyroidism 11.
Conflicting results have been produced in several studies that have attempted to predict outcome following RAI therapy by correlating cure rate with various pre-treatment factors including age, gender, aetiology of hyperthyroidism, goitre size, use of antithyroid drugs, free thyroxine levels at diagnosis and thyroid antibody status. Various forms of calculated or low fixed dose RAI therapy have been used in these studies but no study used a high fixed dose of 550MBq. In this study we have evaluated the overall success rate of high fixed dose RAI therapy and attempted to identify simple clinical predictors of failure to respond the initial RAI dose.
Patients and Methods
The study is a retrospective analysis of 584 consecutive patients referred to the Shropshire endocrinology service (Princess Royal Hospital and Royal Shrewsbury Hospital) over a 14 year period for the treatment of hyperthyroidism. These patients received RAI therapy at Royal Shrewsbury Hospital, which is the only centre providing facilities for RAI administration in the county of Shropshire and also draws referral from adjoining trusts in Powys, North Wales. Information for this study was obtained from the thyroid database which is maintained on all patients who have received RAI since 1985 at the above hospitals.
RAI was administered both as a primary (53%) and as secondary (47%) treatment. A majority of patients with moderate to severe hyperthyroidism were rendered euthyroid by antithyroid drugs (ATD). Ninety percent (518/584) patients were pre-treated to euthyroidism by antithyroid drugs (carbimazole in 95% and propylthiouracil in 5%) before RAI therapy. Carbimazole was withdrawn one week and propylthiouracil 4 weeks prior to RAI therapy. A standard RAI dose of 550MBq was administered to all patients without a prior uptake study. Thyroid function was measured at 6 weeks and at 3, 6 and 12 months following RAI therapy. ATD drugs were not recommenced routinely following RAI therapy and were reserved for patients who were persistently and significantly hyperthyroid following RAI administration. Patients who developed clinical and biochemical hypothyroidism after the initial 6-8 weeks were commenced on thyroxine. Patients with high free thyroxine level (FT4) and a suppressed thyroid stimulating hormone (TSH) level and those on antithyroid medication were defined as being hyperthyroid, those with low FT4 or on thyroxine as hypothyroid and those with normal FT4 and a normal or low TSH as euthyroid. At the end of one year if a patient remained hyperthyroid, another RAI dose of 550MBq was administered. The patient was considered to have been “cured” if euthyroidism or hypothyroidism was achieved during the first year following RAI therapy and “not cured” if patient remained persistent hyperthyroidism at the end of this period.
Information recorded on the database included age, gender, aetiology, indication (primary or secondary), dose of RAI, number of RAI doses, name and duration of antithyroid drugs used, if any, and FT4 and TSH levels at diagnosis, at the time of RAI therapy and at 6 weeks, 3, 6 and 12 months after RAI therapy. Diagnosis of Graves’ disease was based on the presence of Graves’ ophthalmopathy or a combination of a diffuse goitre and a significant titre of thyroid peroxidase antibodies or if radionuclide scan showed diffuse uptake. Toxic nodular disease was diagnosed on the grounds of a nodular goitre and a focal increase in radionuclide uptake. Patients who could not be classified to either of the groups on clinical grounds and where a radionuclide scan could not be performed for a variety of reasons, were categorised as “unclassified” on aetiological grounds.
Statistical analysis
Continuous random variables were compared using t-tests and association of categorical variables by using chi-squared tests. The effect on outcome (cure of hyperthyroidism) of all variables was assessed by using logistic regression analysis and a step-wise routine was applied to choose the best set of predictors. All analyses were carried out by using NCSS2000.
Results
Data on 584 patients was included with a mean age of 56 years (range 20-90) and a female preponderance (82%). Assessment of the aetiology of hyperthyroidism was made by the above-mentioned criteria. In 110(15%) patients precise aetiological diagnosis could not be made. 344/474 (72%) patients had hyperthyroidism secondary to Graves’ disease and 134/474(28%) had toxic nodular disease. 518 patients received pre-RAI antithyroid medications. Mean free thyroxine level at time of diagnosis was 45.4pmol/L in 259 patients in whom this information was available. Data for thyroid status at 3, 6, and 12 months post-radioiodine were available in 97, 94 and 100% patients respectively (see Table 1).
Table 1: Thyroid status at 3, 6 and 12 months
Euthyroid (%)
Hypothyroid (%)
Hyperthyroid (%)
3 months
308 (54%)
176 (31%)
87 (15%)
6 months
210 (38%)
280 (51%)
59 (11%)
12 months
134 (23%)
411 (70%)
39 (7%)
FT4 values were entered onto the database more recently and this result was available in 259 patients. The group of patients where FT4 data was available was comparable to the group where this information was not available in all respects apart from age (mean age (SD) 54 (±15) vs 58 (±14) years respectively, p<0.02). Similarly, the group of patients in whom the aetiology could not be ascertained was not different from the group where the aetiology could be identified in any respect apart from the age (mean age (SD) 60 (±13) vs 55 (±15) respectively).
Table 2 – Forward Stepwise (Wald) logistic regression analysis to identify factors independently associated with failure to respond to first dose of RAI
Variables
P value
Adjusted r2; OR (95% CI)
Free T4 at diagnosis
0.005
0.084; 1.04 (1.01-1.07)
Free T4 > 45 pmol/l at diagnosis*
0.02
0.056; 3.43 (1.17-10.04)
Age
0.81
N/A
Gender
0.18
N/A
Aetiology
0.23
N/A
Pre RAI use of anti-thyroid drugs
0.42
N/A
* Regression analysis carried out with free T4 as a continuous variable and separately as a categorical variable at a cut off of 45pmol/l
One year following RAI treatment, 543(93%) patients were either euthyroid (162;28%) or hypothyroid (383;65%) and considered “cured”; 39(7%) patients remained hyperthyroid and required further doses of RAI, with 34(6%) patients requiring two doses and 5(1%) patients three doses. At 3 months, 484 out of 571 (85%) patients, and at 6 months, 490 out of 549 (89%) patients were “cured” (table 2). On univariate analysis no correlation could be established between the failure to respond to the first dose RAI and age, gender, aetiology or use of antithyroid medication (p = ns for all) although the rate of hypothyroidism was significantly higher at the end of one year in patients with Graves’ disease as compared to those with toxic nodular disease (77.1% vs. 50.3%, p<0.01). These results were not affected by limiting the analyses to any of the following groups: only those patients in whom the aetiological diagnosis could be made (n=478), only those patients in whom FT4 value was available (n=259) or only those patients where both FT4 was available and aetiology could be ascertained (n=209). On univariate analysis FT4 at diagnosis was associated with the outcome when it was used as a continuous variable (p<0.05) or as a categorical variable with the cut off set at mean FT4 value of 45pmol/L (p=0.01) and high values were associated with failure to respond to the first dose of RAI (mean ± SD, 57.28±20.1 v 44.58±16.1 pmol/L, p<0.05). On multivariate analysis with all variables, FT4 was found to be independently associated with outcome and again this association was seen when FT4 was used as a continuous variable (p=0.01) as well as a categorical variable (p=0.02). On using step-wise selection routine only FT4 could be chosen as a predictor when criterion for selection was set at p=0.05 and a value of over 45pmol/L predicted failure to respond to the first dose of RAI.
Discussion
The use of a standard fixed-dose RAI therapy is gaining increasing popularity and several studies have now shown that formal estimation of the required dose based on the thyroid size and iodine kinetics does not lead to a higher cure rate 6,7,10,11 or a lowerhypothyroidism rate 7. For several years we have used 550MBq dose for all patients of hyperthyroidism. The overall success rate with this regime was 93% and only 7% of patients required a repeat RAI dose. These figures are comparable to those from most other centres, which have used a similar dose of RAI 10. In addition to achieving a high cure rate, hyperthyroidism was controlled rapidly with 85% of the patients becoming either euthyroid or hypothyroid within 3 months of treatment. Early onset of hypothyroidism (>70% at 12 months) facilitated institution of thyroxine replacement therapy during the first year during which the patients were being closely followed.
The use of a relatively higher dose of RAI leads to more stringent restrictions to the normal life of patients and these have to be followed for a longer period of time than is the case with the use of a lower dose. Majority of patients accept these restrictions at the prospect of a cure of hyperthyroidism. However, even at this dose, 7% of patients required repeat dosing which in turn led to another restrictive period for these patients. In view of this it is useful to be able to predict failure of the first dose in an individual patient. This would enable us to warn these patients about the higher possibility of requiring repeat dosing, further period of post-RAI restrictions and target them for a closer follow up. To allow us to make this prediction we correlated simple clinical pre-treatment variables to the need for repeat dosing. We found that there was no statistically significant correlation between age, gender, aetiology and the use of anti-thyroid medication prior to RAI and the outcome following RAI therapy although a high free thyroxine level at diagnosis predicted a failure of the first dose to achieve a cure of hyperthyroidism. There are several conflicting reports in the literature on the correlation between these factors and the response to RAI therapy. Most of the studies have failed to show a significant association between the age of the patient and the outcome irrespective of whether the age was used as a continuous or a categorised variable 12-15 although in a study where a standard 150 gray RAI was used age >50 was found to be associated with a higher failure rate 16. In one study, male gender was associated with a lower cure rate following a single dose of RAI in patients with Graves’ disease 12 although others have failed to confirm this association 13,14. Use of antithyroid drugs prior to RAI has been shown to independently reduce the success rate of RAI 17, 18 while other studies have shown such an association with the use of propylthiouracil but not with carbimazole 19, 20. Literature on the association between the aetiology of hyperthyroidism and the outcome is even more confusing. Patients with toxic nodular disease have been considered to be more radio-resistant as compared to patients with Graves’ disease 21 although opposite results have also been noted 22. In other studies no correlation could be established on multivariate analysis between the aetiology and outcome following RAI 14, 18. Our study is the only one which analyses the influence of these factors on the outcome following the use of a standard 550MBq RAI dose and the above studies which have attempted to identify clinical predictors of outcome have either used various forms of the calculated dose regime or a lower fixed-dose RAI regime. We feel that this is the reason for the inconsistencies in the results and when a 550MBq dose RAI is used only FT4 value at diagnosis could predict the failure of RAI therapy to achieve cure. This dose of RAI appears to override the variations in the response induced by the remaining pre-treatment variables studied.
Studies using smaller doses or calculated doses of RAI have shown the outcome to be inversely associated with the thyroid size 14, 16 although this could not be ascertained in our study due to the lack of consistent documentation of the size ofgoitre in the clinical notes. In addition there are several possible confounding factors. Firstly the overall cure rate could have been influenced by the long period of time over which patients have been included (15 years) and the resulting changes in the criteria and threshold for the use of RAI. However if we divide the figures into 3 time periods of 5 years each, the findings remain consistent during each of these periods. Secondly, in over 50% of our patients, RAI was administered as a primary measure and it could be argued that a larger number of patients with milder hyperthyroidism may have been included in our cohort as compared to the patients at other centres where RAI is mainly reserved for patients who fail to respond to ATD. However there was no significant difference in the cure rate between those patients who received RAI as a primary measure and those in whom RAI was administered as a secondary treatment (94% v 93%). Thirdly in 15% of patients the aetiology could not be ascertained by using our well-defined criteria, mainly because of the practical difficulty of performing radionuclide scans in some of the patients where the diagnosis could not be made clinically. We do not feel that our results on the association between the aetiology and the cure rate were affected, as the patients with undefined aetiology were comparable to the remaining patients in all respects apart from age and had similar outcomes. Lastly the information on the FT4 value at diagnosis was available in only 259 patients. To exclude a selection bias this group was compared to the group of patients where this information was not available. Again the only difference between the two groups was the age distribution. In both instances this difference was not large (though statistically significant) and we do not feel it affected the outcome, especially as age does not appear to influence the outcome following RAI therapy. We could not assess the impact of post-RAI use of antithyroid drugs as these were not routinely restarted following RAI therapy at our centre.
In conclusion, high fixed dose RAI therapy is a very effective treatment for patients with hyperthyroidism and has a high success rate. Failure to respond to this dose cannot be predicted by most of the pre-treatment variables apart from the severity of the hyperthyroidism as judged by the FT4 value at diagnosis. Patients who present with severe hyperthyroidism should be warned regarding the higher possibility of requiring further doses of radioiodine even when treated with a dose of 550MBq.
William Osler has said that "A desire to take medicine is perhaps the great feature which distinguishes man from animals" This desire, however may play havoc when a person starts taking medicines on their own (i.e. self-medicating), forgetting that all drugs are toxic and their justifiable use in therapy is based on a calculable risk 1.
Self-medication (SM) can be defined as obtaining and consuming drugs without the advice of a physician2. There is a lot of public and professional concern about the irrational use of drugs in SM. In developing countries like India, easy availability of a wide range of drugs coupled with inadequate health services result in increased proportions of drugs used as SM compared to prescribed drugs2. Although, over-the-counter (OTC) drugs are meant for SM and are of proved efficacy and safety, their improper use due to lack of knowledge of their side effects and interactions could have serious implications, especially in extremes of ages (children and old age) and special physiological conditions like pregnancy and lactation 3, 4. There is always a risk of interaction between active ingredients of hidden preparations of OTC drugs and prescription medicines, as well as increased risk of worsening of existing disease pathology 5 . As very few studies have been published in our community regarding usage of self medication we conducted this cross-sectional study in the coastal region of Pudhucherry, South India, t assess the prevalence and pattern of SM use.
Materials and methods:
The present study was a cross-sectional survey conducted in coastal region of pudhucherry, south India. For this study we recruited 200 patients randomly from both urban and rural communities (100 each) for a period of six months during 2009. Patients who were = 18 years of age and who were able to read and write the local language (Tamil) or English were included in the study after informed consent explaining the purpose of the study. Participants with intellectual, psychiatric and emotional disturbances that could affect the reliability of their responses were excluded from the study. To collect data regarding SM usage a structured questionnaire was prepared, after an extensive literature review.. The structured questionnaire contained 25 items in the form of closed and open ended questions. Initially the tool was validated by a panel of experts in the field of public health for the appropriateness of each item and assessment of content validity (0.91) and re-test reliability coefficient (0.89). Approval to conduct the study was granted by the Institute ethics committee prior to data collection. Each participant underwent a face to face interview to collect data followed by an informal educational counseling about potential adverse effects of consuming common SM. Data collected was analyzed using SPSS for windows statistical software version 14 (SPSS Inc., Chicago, Il, USA). Data was presented using descriptive statistics (i.e. numbers, percentage) and inferential statistics (i.e. Chi-square). A probability value of < 0.05 was considered to be significant.
Results
Basic demographic details:
The majority of the participants were female (56%). Most of the participants (60%) were between 26-45 years of age. There were an equal number of participants from the rural and urban community. Among the total 200 participants 70% were literate.
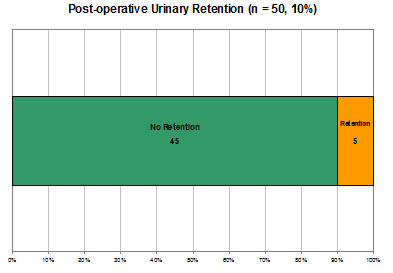
Findings related to usage of SM:
Overall, out of 200 participants, 71 % of them reported that they have used SM in the past. The frequency of SM use varied among the subjects with a minimum of at least one time to maximum of 5 times and above See Figure 1. When the participants were asked about the reasons for SM use, the majority of them - 41.5% - stated lack of time to visit a doctor as the main reason followed by minor illness and quick relief. See Table 1. The major source through which the participants learned to use SM were as follows, directly from pharmacist (57.3%), prescription of previous illness (21.5%), friends (12.5%), television (5.5%) and books (3%).See Table 2. The main indications for SM use were fever (36%), headache (35%), then cough/cold/sore throat (20%). See Table 3 for detailed data.
Figure 1: Frequency of self medication Use
Table 1: Reasons for Self Medication Use
Reasons
Number (%)
Lack of time
41.5
Minor illness
10.5
Economical
14
Quick relief
10
Learning opportunity
2
Ease and convenience
10.5
Avoiding crowd in visiting doctor
6
Unavailability of doctor
5.5
Table 2: Sources of Self Medication Use
Sources for self medication use
Number (%)
Directly from pharmacy without prescription
57.3
Prescription of previous illness
21.5
Friends prescription
12.5
Television media
5.5
Book
3
Table 3: Indications for Self Medication Use
Indications for self medication use
Number (%)
Headache
35
Stomach ache
3
Vomiting
1
Eye symptoms
0.73
Diarrhoea
2
Cough, cold, sore throat
20
Fever
36
Skin symptoms
0.27
Ear symptoms
2
While calculating chi-square to find out the association between usage of SM and selected demographic variables we found an association between residence (i.e. rural or urban) and gender; urban people were more likely to use SM than rural people (urban, 60/100 vs. rural 82/100, p value = .006). In relation to gender females were more likely to use SM in comparison to males (female, 78/112 vs. 43/88, p value= .002). Other variables were not significantly associated with SM use. Finally, when the subjects were asked about the side effects of their used self medications 93.5% of them said that they are not aware of the side effects and only the remaining 6.5% of them said they are aware of the side effects.
Discussion
The current study examined the prevalence and pattern of SM use in a coastal region of South India. The study findings revealed 71% of the people reporting SM use in the past, this prevalence rate in our study is consistent with previous finding3,6,7,8,9,10,11 The figure of participants who use SM is very high, which requires immediate attention. The frequency of self medication use in our study ranged from a minimum of one time to a maximum of 5 times and above, this finding was in line with the findings of a study by Nalini (2010)12.
Participants cited multiple reasons for use of SM like lack of time , quick relief from illness and ease and convenience, a similar reasons were cited in an another Indian study13. In the current study participants reported SM use in a variety of conditions like headache, stomach ache, cough and fever, this these finding are comparable with those of Sontakke et al (2011) 14. The reason for SM use may be mufti-factorial, in our study an association was found between gender and residence, i.e. female and rural people reporting more SM use, this finding was similar to two previous studies15,16 To establish the reasons why requires further research. One potential limitation of this study is the limited sample size, which we tried to overcome by adopting a random sampling method so as to generalize findings.
Conclusion
Factors influencing SM include patient satisfaction with the healthcare provider, cost of the drugs, educational level, socioeconomic factors, age and gender 17. Interactions between prescribed drugs and the drugs taken for SM is an important risk factor of which healthcare providers must be aware of.17,2
Easy availability of wide range of drugs without a prescription is the major factor responsible for irrational use of drugs in SM as, thus resulting in impending health problems (antimicrobial resistance, increased load of mortality and morbidity) and economic loss. The need for promoting appropriate use of drugs in the health care system is not only for financial reasons, with which policy makers and manager are usually most concerned, but also for health and medical care of patients and the community. There is need for authorities to strengthen existing laws regarding OTC drugs to ensure their rational sale and use. Also, specific pharmacovigilance is needed and the patient, pharmacist and physician must be encouraged to report any adverse events. Periodic studies on the knowledge, attitude about and practice of SM may give insight into the changing pattern of drug use in societies.
Sedation is frequently administered outside of the operating theatre by non-anaesthetic doctors to facilitate minor procedures. This can be in both primary care including dental surgeries as well as in hospital departments such as radiology, endoscopy and the emergency department. Clinical practice including medication and monitoring equipment available and the personnel involved, varies not only between hospitals and regions but also between departments.
In the emergency department sedation is often performed in a busy clinical setting by junior doctors. This enables minor procedures to be carried out with subsequent discharge home reducing admission rates and the requirement for general anaesthesia. Other advantages include less workload pressure on the anaesthetic team and a significant improvement in the patient experience. Sedation is not without risk and significant morbidity and mortality is still associated with its use, particularly in the elderly and in combination with other medication1,2. Guidelines and protocols do exist to ensure safe practice but often it is only anaesthetic doctors who are aware of them3-7. A recent study by Fanning highlighted discrepancies in practice, skills and knowledge of doctors of various specialities and grades who administered sedation8. Anecdotal reports from orthopaedic colleagues suggested the variability in competence of doctors with clear implications for patient safety. We therefore sought to ascertain the current clinical practice, knowledge and prior training in sedation techniques of specialist registrars in orthopaedic and trauma surgery in our region.
Materials and Methods
A questionnaire based survey of 53 specialist registrars in orthopaedic and trauma surgery in the neighbouring Severn and South Wales regions was carried out. The questionnaire was modified from that developed by Fanning8 and circulated for completion at regional teaching sessions in Swansea and Bristol (Appendix 1). Each respondent had 15 minutes to complete the questionnaire based on their own experience, practice and knowledge. Respondents were not allowed to confer and full confidentiality was assured. The questionnaire was split into several sections that ascertained the respondents’ clinical practice including the procedures that sedation was used for, prior training, awareness of protocols and safety issues. Knowledge of the basic pharmacology of commonly used sedative agents was also tested. The final section asked respondents whether they had ever encountered any adverse events, the nature of the adverse event and whether assistance was required from the anaesthetic department.
Results
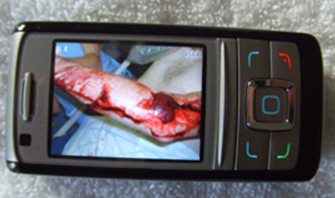
Orthopaedic specialist registrars (post basic surgical training) who were in higher surgical training completed 53 questionnaires. Sedation was performed in the emergency department by all respondents for manipulating fractures, reducing dislocated joints and for applying traction. Twenty-four respondents (45%) had read the sedation protocol for their hospital/emergency department. Thirteen respondents (25%) completed pre-sedation assessment forms, whilst only eleven (21%) completed the during-procedure monitoring data forms and twelve (23%) filled the after-procedure forms (Figure 1). Twenty-eight (53%) respondents ensured that either they or an assistant provided the patient with discharge advice.
Figure 1The percentage of respondents who had read the departmental protocol, completed monitoring forms and given advice prior to discharge.
Table 1: Sedative agents used.
Medication/Sedative Agent
No of Respondents
Diazepam
31
Pethidine
1
Midazolam
35
Propofol
15
Fentanyl
3
Morphine
44
Opiates with BDZs
12
Local anaesthesia with sedation
17
Almost all (98%) respondents administered sedation in the presence of an assistant. Forty-seven (89%) checked their medication with another healthcare professional. All fifty-three respondents supplied patients with concurrent oxygen whilst fifty-two ensured that resuscitation equipment was available nearby. In terms of specific training, forty-seven (89%) registrars had undergone Advanced Life Support training (ALS) but this qualification was only valid (within three years) for thirty-six (68%). Sixteen registrars (30%) stated they had undergone formal training or teaching regarding sedation (Figure 2). With regards to monitoring of patients, thirty-six (68%) respondents used pulse oximetry, fourteen (26%) used electrocardiogram (ECG) monitoring and twenty-eight (53%) measured blood pressure.
Figure 2The proportion of respondents who had received training in administering sedation
Morphine and other opioids were the most commonly used sedative medication (44 responses), followed by midazolam (35 responses), diazepam (31 responses) and propofol (15 responses). Twelve respondents combined opiates and benzodiazepines, whilst seventeen combined local anaesthesia with sedation (Table 1). Two-thirds of respondents (35 out of 53, 66%) administered sedation in boluses rather than calculating the correct dose per kilogram. The pharmacology questions devised by Fanning8 tested knowledge of metabolic pathways, duration of action and side effects. Overall, each question was answered correctly by over 50% of respondents (Figure 3). The mean score was 4.29 out of 7.
Figure 3The percentage of correct answers for each of the seven pharmacology questions.
Eighty percent of surveyed orthopaedic doctors (43 respondents) reported an adverse event after administering sedation. Twenty-nine respondents had at some stage contacted the anaesthetic department for assistance in managing a patient following sedation (Table 2).
Table 2: Adverse Events reported.
Adverse Effects
No of Respondents
Hypoxia
20
Respiratory Depression
13
Loss of consciousness
7
Hypotension
14
Prolonged Sedation
13
Nausea and Vomiting
14
Discussion
Non-anaesthetic doctors are permitted and often required to administer sedation to perform procedures in settings outside of the operating theatre. There are various published guidelines that detail the level of care and monitoring that should be provided when sedation is given3-7. It has been recommended that the same standards of monitoring apply to procedures under sedation or local anaesthesia as to procedures under general anaesthesia, and are irrespective of the location of the procedure3.
The report by an intercollegiate working party led by the Royal College of Anaesthetists summarised the key aspects of administering sedation based on existing guidelines6. Patients should be first assessed before the procedure by attendant staff, risk factors noted and further examination or investigations performed as necessary. Drug administration technique should be “one defined by a relevant specialty organisation”6 and doses adjusted to individual patient requirements. Combinations of drugs should be “employed with particular caution” especially sedatives and opioids. The opioids should be administered first and given time to be maximally effective before any sedative is given. The patient should be monitored during the procedure by a suitably trained individual recording pulse oximetry, blood pressure and electrocardiography. High flow oxygen should also be available. Doctors administering sedation should be able to control an airway using basic manoeuvres or airway adjuncts.
There is significant morbidity and mortality associated with sedation1,2. It is difficult to know the true incidence of cardio-respiratory complications after sedation, as this is often related to the procedure and patient factors. An audit of 14,000 endoscopic procedures reported a 30-day mortality of 1 in 20009 and there are several anecdotal reports of death following sedation10,11.
It is apparent that not all doctors are aware of or follow sedation guidelines. In the study by Fanning8, 42% of respondents completed a pre-procedure assessment form and 70% completed monitoring data sheets. In this study, whilst 45% of respondents had read departmental protocols, only 25% completed a dedicated pre-assessment of the patient and an equally low number recorded monitoring data forms during (21%) and after the procedure (25%). These low numbers are of potential concern. Time and resource constraints may play a part, particularly in a busy emergency department. Also, as junior doctors frequently rotate between hospitals, they may not be aware of departmental policies in each unit. It is understandably impractical to perform a procedure and concurrently complete a data monitoring form. This role should be delegated to an assistant.
Knowledge of basic pharmacology amongst respondents seemed reasonable and indeed better scores were achieved than in Fanning’s original paper. It would appear that a large number of respondents (n=29) have contacted anaesthetic colleagues for help following adverse events. This may simply reflect an acknowledgement of limited anaesthetic capabilities amongst respondents and a pre-emptive call for assistance rather than an anaesthetic “bail out” after cardio-respiratory compromise.
Whilst the questionnaire used is neither a formal assessment tool of clinical competence nor an accurate log of experience, it serves to highlight the potential limitations of current training. A clear issue is the low number of respondents who claim to have received formal teaching or training with regards to sedation. This may be due to the fact that little or no postgraduate training is provided in hospital specialities that require sedation. This is an area that needs to be addressed. The issues raised by this study are not new. In fact, a similar survey by Hewitt and Hartley in 1994 had similar findings and suggested that “sedation techniques should be included in induction teaching for A&E and orthopaedic juniors” and that all doctors administering sedation should have the “opportunity of resuscitation refresher courses”12.
Conclusion
Sedation is widely administered by non-anaesthetic doctors including orthopaedic surgeons in order to perform basic procedures outside of the operating theatres, mainly in the Accident and Emergency department. Whilst this study only involves 53 doctors in one speciality across two regions, it does give an insight into the self-reported clinical practice, knowledge and experience of a group of surgical doctors who are often required to administer sedation. Significantly, the majority of doctors surveyed reported they had not received any formal training. It is also apparent that departmental guidelines are not always known or followed. Due to the inherent risks of sedation, it is important that doctors are aware of and follow available guidelines. It is crucial that adequate training should be given to non-anaesthetic doctors to ensure they have the knowledge and skills to safely administer sedation. Otherwise a medical doctor, perhaps a registrar level from the Accident and Emergency department, should be present for patient assessment and management of airway compromise or any arising complication.
Malaria is a major worldwide scourge, infecting and killing several million individuals each year1. Malaria is common in mostly tropical and subtropical areas such as The Americas, Asia and Africa2, 3.
The NADPH oxidase complex is responsible for the reduction of oxygen in cells, yielding a superoxide anion (O2˚-) that is subsequently converted into other ROS; including hydrogen peroxide (H2O2) and the hydroxyl radical (OH˚)4.
The Sequence analysis showed that the NCF1 wild type gene is 15,236 bp long, contains 11 exons and has an intron/exon structure identical to the highly homologous pseudogene5. The pseudogene which is highly homologous to the wild type gene is located on the same region of the chromosome, which is 7q11.23 of chromosome 76. Comparative sequence analysis between the wild type gene and pseudogene demonstrates greater than 98% homology but the pseudogene has a GT deletion (ΔGT) at the start of exon 27. The genomic pattern of wild type NCF1 gene and its pseudogene may influence the production of reactive oxygen species (ROS) in parasitic and bacterial infections and also in autoimmune diseases.
During malarial infection, the ROS production can contribute to rapid parasite clearance in mild malaria8 but in severe malaria the high capacity production of ROS was associated with anaemia. This means that ROS has a possible role in both parasite clearance and anaemia during P.falciparum infection9. Genetic variation in components of the leukocyte NADPH oxidase may, therefore, influence disease susceptibility to, and disease duration of parasitic infection and autoimmune disease10.
Study Design
Inclusion and exclusion criteria
Patients who had fever with malarial parasites detected microscopically from blood smears and had no evidence of other illnesses were selected. Patients were excluded if they developed other illnesses within three days of admission or if there was any other present infection.
Relatives of patients in the hospital and in the laboratory and members of the community without malaria or any other febrile illness were included after clinical evaluation. These formed the control group of healthy individuals.
Patients and healthy individuals
To determine the association of NCF1 gene in malaria, the blood samples were collected from malarial patients and healthy individuals in storage tubes coated with EDTA. Malaria was diagnosed on the basis of clinical observation and positive smear test containing various types of plasmodium.
Materials and Methods
The restriction fragment length polymorphism (RFLP) method was performed to determine the prevalence of NCF1 gene GT deletion (ΔGT) among patients with malaria and among healthy individuals in a Pakistani population. In order to determine whether there was an association between NCF1 gene GT deletion (ΔGT) at the start of exon 2 with susceptibility to malaria, 88 malarial patients and 100 healthy individuals were genotyped for the GT deletion by restriction enzyme analysis.
Genetic Analysis
Genomic DNA of patients and of the healthy control subjects was extracted from venous blood samples using the nucleospin blood extraction kit (NucleoSpin® Blood, Germany) according to the manufacturer’s protocol. The NCF1 gene was analyzed by the restriction fragment length polymorphism (RFLP) method. The exon 2 was amplified using both forward and reverse primer as shown in Table 1. The reaction mixture (50 μl) for PCR was prepared in 0.2 ml tubes (Axygen®, California, USA) by adding the following: 1.2 μl of sample DNA (50 ng /μl), 5 μl (10X) from the PCR buffer (Fermentas, Burlington, Canada), 4 μl of 25mM magnesium chloride (MgCl2) (MBI Fermentas, Burlington, Canada), 3 μl of 2 mM deoxyribonucleotide triphosphates (dNTPs) mixture (MBI Fermentas, Burlington, Canada), 2.6μl of each forward primer (10 pm/μl), 2.6 μl of the reverse primers (10 pm/μl) and 1.2μl Taq DNA polymerase (MBI Fermentas, Burlington, Canada) in 30.40 μl nuclease free water with cycling conditions 95 °C for 5 min, followed by 35 cycles at 95 °C for 1 min, 60.6 °C for 1 min, 72 °C for 1 min and finally a 10 min extension at 72 °C.
The amplified products were then treated with the restriction enzyme BsrGI (Geobacillus stearothermophilus GR75) (Fermentas life science). For a 20 μl mixture we took 10 μl of PCR product, 2 μl 10X buffer tango, 1 μl BsrGI enzyme and 7 μl of nuclease free water to make the mixture volume up to 20 μl and checked the result on 2% agarose gel.
Table 1: sequence of primers and product size
Deletion Exon
primers
sequence
Product size
DNCF2F
5'-GCTTCCTCCAGTGGGTAGTG-3'
DNCF2R
5-GCAAGACCCTGGGTGACAGA-3'
GTGT
358 bp
GT
356 bp
Statistical Analysis
Statistical analysis was performed using the Study Result Software Version 1.0.4 (CreoStat HB Frolunda, Sweden). The association of both types of genes in malaria patients and healthy individuals were compared using the χ2 or Fischer’s exact test. Similarly to elucidate whether there was an association between the age and gender of both patients and healthy controls, analysis was done using the T-test and chi-square test by the online Graphpade software.
Results
Characteristics of patients
The characteristics of patients and healthy individuals are mentioned in Table 2 and table 3.
Table 2: Total number of patients and healthy individuals with their respective mean ages
Characteristic
Patients
Mean age
Control
Mean age
P value
± SD
Total number of subjects
88
22
100
26
0.43761
0.8627
Adults > 22 year
60
60
Children <22 year
28
40
Table 3: Total number of Patients and healthy individuals enlisted with respective mean age.
Characteristic
Patients
Mean age for patients
Control
Mean age for controls
No of males
75
24
80
26
No of females
13
20
20
27
Total
88
22
100
26
A chi-square test was performed to test the null hypothesis regarding whether there was an association between gender and the number of subjects in the control group and patient groups. No statistically significant association was found, c2 (1, N = 188) = 0.559, p = 0.4545”. Similarly, a chi-square test was performed to test whether there was any association between the gender and ages of subjects in the control group and in the patient group. Again no statistically significant association was found, c2 (1, N = 188) = 0.299, p = 0.5848”.
PCR amplification of exon 2 of NCF1 gene
The exon 2 was amplified by polymerase chain reaction to obtain 358 base pair long regions in the case of the wild type gene and 356 base pair long regions in the case of the pseudogene. The products were treated with a restriction enzyme, Geobacillus stearothermophilus, GR75 (BsrGI) which digests only the wild type gene (GTGT), which meant two bands of 265 bp and 93 bp were obtained respectively. Whereas with the pseudogene (ΔGT) there was no digestion and the original band of 356 bp was obtained. When the individuals had both the wild type gene (GTGT) and the pseudogene (ΔGT)three bands of 265 bp, 93 bp and 356 bp were obtained, two of the wild type gene and one of the pseudogene respectively, which is shown in figure 1.
Figure 1: Agarose gel (2%) showing genotypes of eight patients with malaria. The GT deletions (ΔGT) were checked using the RFLP method, using the restriction enzyme BsrGI. The lane L contains 50 base pair markers, while lane 1 contains a negative sample and 3 and 7 contain amplified wild type gene (GTGT) products. Lane 2, 5 and 6 contain amplified wild type gene and pseudogene (ΔGT) products and lane 4, 8 and 9 contain amplified pseudogene products respectively. The result shows that the 2nd, 5th and 6th patients have both the wild type gene and pseudogene (GT/GTGT). The 3rd and 7th patients have the wild type gene (GTGT) and THE 4th, 8th and 9th patients have the pseudogene (ΔGT).
Genotypic Frequencies of wild type gene and pseudogene in Malaria Patients
It was found that in the Pakistani population, the frequency of the wild type gene in malarial patients (37.5%) was no higher than in healthy individuals (45%) with P = 0.30427. The combination of wild type gene and pseudogene(GTGT/ ΔGT) was equally prevalent in malarial patients (39.8%) as it was in healthy individuals (40%) with P = 0.99999,while the pseudogene (ΔGT) was also slightly different among healthy individuals (15%) as compared to malarial patients (22.7%) with P = 0.19263 which is shown in table 4. There was no significant association found because the P values was greater than 0.05.
Table 4: Show the association of NCF1 gene with malaria
NCF1 gene
Control (n = 100)
Frequency (%)
Patients (n = 88)
Frequency (%)
P value
GTGT
45
45
33
37.5
0.30427
GT
15
15
20
22.7
0.19263
GTGT/GT
40
40
35
39.8
0.99999
Discussion
In this study the association of a wild type gene and a pseudogene with malarial infection, which affects the hepatic, haematological and respiratory systems was investigated.
There was no association found between the wild type gene and pseudogene and the severity of malaria. The innate immune mechanisms that have been proposed to kill malaria parasites are those mediated by ROS and RNS, especially NO and ONOO-, both generated early during infection prior to the activation of adaptive immune mechanisms and later as components of the effector arm of the adaptive immune response11, 12. The parasite-killing role for these molecules has often been conflicting, especially when looking at in vitro and in vivo studies13. It was confirmed that neither RNS nor ROS are essential for the elimination of blood stage malaria parasites14. It was also shown in other studies that on occasion the generation of ROS via NADPH oxidase does kill blood stage malaria parasites, which is a controversial finding. A possible explanation of the discrepancies between Brad et al. and those of Sanni et al. is that these Plasmodium parasites differ in their susceptibility to the action of ROS, with P. yoelii and P chabaudi being more resistant than P. berghei. ROS might be incapable of killing blood stage malarial parasites for several reasons:
(i) The in vivo ability to kill malaria parasites may be masked by the antibody response of the infected host, and (ii) the killing mechanisms mediated by these molecules may function in a redundant fashion15. The present data does not confer the association of the wild type gene and pseudogene with the severity of malaria but there is a need for further study involving a larger population. However within a group of children with severe malaria during the acute disease, a weak association of the wild type gene /pseudogene (ΔGT/GTGT) ratio with ROS production in whole blood was found. It has been suggested that the wild type gene/ pseudogene (ΔGT/GTGT) ratio influences the expression levels of ROS16. However, no influence of the wild type gene /pseudogene ( ΔGT/GTGT) ratio on Plasmodium falciparum malarial infection was detected, although it was previously shown that ROS production plays a role in parasite clearance as well as in the pathology of the disease17, 9. As for parasitic diseases, in humans there has been only one study conducted so far which examined the putative genetic associations of the wild type gene and pseudogene (ΔGT/GTGT) ratio with malaria18.
Urinary tract infection (UTI) is the second most common infectious complaint in geriatric clinics overall, and the most common outpatient complaint caused by bacteria.1 The diagnosis and treatment of UTI in the elderly is not the same as treating UTI in adults. In frail elderly patients with age-associated multiple severe underlying disorders and cognitive impairment, early recognition of bacteraemic UTI and prompt, appropriate treatment are critical in reducing the mortality.2Also, the extensive and inappropriate use of antimicrobial agents has invariably resulted in the development of antibiotic resistance which, in recent years, has become a major problem worldwide.3 The diagnosis and empirical treatment of UTI in the elderly is challenging and a sound knowledge of the prevalent epidemiology of bacteria and their resistance pattern is necessary for the same. However, there is not much information on the aetiology and resistance pattern of UTI in the elderly in India. This study was done to find out the present uropathogen profile causing UTI in our centre and their antibiotic resistance patterns.
Subjects and methods
This prospective study was done at our tertiary care centre from January to December 2008. The study included all patients who were admitted or visited the outpatient departments in the hospital with symptoms of UTI during the study period and had UTI confirmed by positive urine culture reports. Only one sample from each subject was considered. Subjects with clinical symptoms of UTI but no growth on culture were excluded from final analysis. Subjects who were treated with another antimicrobial within the previous 48 hours, or within 24 hours if only a single dose and in the presence of an appropriate positive culture and ileal loops or vesicoureteral reflux were also excluded from the study. Complete data regarding demography, sex preponderance, associated symptoms, pathogenic organisms causing UTI and their antibiotic resistance were collected.
Overall, 194 subjects were included in the study (male: 116, female: 78). The mean age of the study population was 73.54±7.19 years, ranging between the ages of 65 and 96. The distribution of patients according to gender across various age groups is given in table 1. A general trend of more male subject enrolment was seen across all the age groups.
Table 1. Age and gender distribution of complicated and uncomplicated urinary tract infection.
Age group
Male
Percent
Female
Percent
Total
Percent
65-74
66
56.9
48
61.5
114
58.8
75-84
40
34.5
24
30.8
64
33.0
85-94
10
8.6
5
6.4
15
7.7
≥95
0
0
1
1.3
1
.5
Total
116
100.0
78
100.0
194
100.0
Isolation and identification of uropathogens
A clean catch midstream specimen, or suprapubic aspirate in subjects who were unable to give the former, was collected in a sterile, wide-mouth, leak-proof container to hold approximately 50ml from these subjects. Using a calibrated loop method of loop diameter 4 mm, 10 µL of the uncentrifuged specimen was transferred onto the agar plate and streak, using the modified Mayo’s technique without flaming the loop for isolation, and incubated at 35- 370C for 24 hours. A specimen was considered positive for UTI if a single organism was cultured at a concentration of >105 Colony Forming Units/ml. The Gram-positive and Gram-negative organisms culture isolates were further identified by using various biochemical reactions up to genus/species level wherever applicable.
Antibiotic sensitivity testing
In the presence of any potential growth, antibiotic sensitivity testing was done by the Modified Kirby-Bauer disc diffusion method according to the Clinical and Laboratory Standards Institute (CLSI) guidelines.4 The antibiotics tested were Imepenem, Meropenem, Ciprofloxacin, Ofloxacin, Norfloxacin, Amikacin, Gentamicin, Nitrofurantoin and Cotrimoxazole (Pathoteq Labs, India).
Extended Spectrum Beta-Lactamase (ESBL) detection
The screening for ESBL was done using Cefpodoxime (<17mm), Ceftazidime (<22mm), Aztreonam (<27mm), Cefotaxime (<27mm) and Ceftriaxone (<25mm). If the organisms showed the zone of inhibition lower than the minimum for any antibiotic disc, ESBL positivity was suspected. The phenotypic confirmation was done by testing the strain against Ceftazidime (Ca) and Ceftazidime/Clavulanic Acid. A > 5mm diameter of the zone of inhibition for Ceftazidime/Clavulanic Acid in comparison to Ceftazidime was considered indicative of ESBL production. Escherichia coli (E. coli) ATCC 25922 was used as ESBL negative and Klebsiella pneumoniae (K. pneumoniae) 700603 was used as ESBL positive reference strain.4
Statistical analysis
Descriptive statistics (totals, means, percentages, and standard deviations) were conducted using the statistical software package - SPSS Version 16.0 (SPSS Inc., Chicago, USA). Age, gender, organisms causing UTI, their antibiotic sensitivity and resistance, symptomatology of these subjects, and risk factors for UTI were included in the analysis and the results presented in tables and figures.
Results
Fever (57/194 - 29.4%) and dysuria (52/194 - 26.8%) were common symptoms of most UTI patients (Fig. 1). Diabetes mellitus (DM) and recent uro-genital instrumentation were the most common risk factors associated with UTI in the present study (Table 2). The organism profile and their antibiotic resistance profile were similar in patients with or without DM.
Figure 1. Various symptomatologies seen in patients with urinary tract infection during the initial presentation
Table 2. Frequency of various risk factors in subjects with urinary tract infection.
Risk Factor
Frequency
Percent
Catheterization
29
14.9
Diabetes Mellitus
97
50.0
Immunosuppression
2
1.0
Recent history of uro-genital Instrumentation
43
22.2
Recurrent urinary tract infection
14
7.2
Renal stones
5
2.6
E. coli (138/194 - 71.1%) was the most commonly isolated pathogen responsible for UTI in the present study (Figure 2). 56.2% of the total infection was caused by ESBL positive organisms. The antimicrobial potency and spectrum for nine selected antimicrobial agents (Imepenem, Meropenem, Ciprofloxacin, Norfloxacin, Ofloxacin, Gentamicin, Amikacin, Nitrofurantoin and Cotrimoxazole) against the uropathogens were studied. The highest and least antibiotic resistance was noted against fluoroquinolones (79.9%) and carbapenems (3.61%) respectively (Fig. 3).
Figure 2.Frequency and distribution pattern of urinary tract infection pathogens and percentage Extended Spectrum Beta-Lactamase (ESBL) production.
Figure 3. Resistance pattern to various antibiotics of the uropathogens
Discussion
While increased frequency and dysuria are usual symptoms of UTI, uncertainty looms around the same as these symptoms can be masked by catheterisation, or be common and chronic in the elderly even in the absence of UTI.5-10Fever was the most common symptom of UTI in the present study as with similar studies worldwide.11-13 Studies have found that the elderly do not lack a febrile response; that an elevated temperature was the most common initial symptom, a marker for a serious infection, and the most important clinical indicator for antibiotic treatment.14-16 Whitelaw et al17 reported that a delay in interpreting fever as a symptom of UTI led to a high mortality rate in the elderly within 24 hours of admission.
Diabetes isconsidered as an important risk factor for UTI with manyauthors having defined UTI in patients with DM as complicated when the UTI is symptomatic.18-19 However, the authors did not find that DM influenced the organism profile and their antibiotic resistance in the present study. Bonadio et al20 studied the influence of DM on the spectrum of uropathogens and antimicrobial resistance in elderly adult patients with asymptomatic UTI (mostly hospital-acquired). They found that DM per se did not seem to influence the isolation rate of different uropathogens and their susceptibility patterns to antimicrobials. These findings indicate that, although DM is a known immunomodulator, the role played by the same in altering the antibiotic resistance is minimal compared to recent invasive procedures.
Although the uropathogen profile of the present study resembles similar studies worldwide, the antibiotic resistance of these organisms was unusually high.2, 21 Cotrimoxazole is the recommended drug for treating UTI. However, more than one third of the study subjects were resistant to the first-line drug. 79.9% of the uropathogens were resistant to fluoroquinolones, which are considered as the second-line drug. As prior fluoroquinolone use is a known risk factor for fluoroquinolone-resistantE. coli infection, it is plausible that frequent fluoroquinolone prescriptions may be contributing to the observed resistance.22-23 Aypak et al 24 found that treatment durations were statistically longer than the recommended three-day course when patients were empirically treated with fluoroquinolones due to increased resistance rates, and suggested to discourage the empirical use of fluoroquinolones in UTI.
The most troublesome finding of the present study is that ESBL-positive organisms accounted for 56.2% of the total infection. Not much information on ESBL-producing organisms causing UTI is available from India and most of these reports are from the younger population. The prevalence of ESBL-positive UTI in these studies varied between 26.6% and 48.3%.25-26 To the best of our knowledge, this is the highest ever reported prevalence of ESBL-positive UTI in the elderly worldwide. ESBL-producing organisms are frequently resistant to many of the antimicrobial agents usually recommended for the treatment. As lesser new antibiotics are available for their management, we need to be concerned of this issue in years to come especially in tertiary care centres. A unified antibiotic protocol is necessary to limit the morbidity and mortality associated with inappropriate and under-treatment of UTI.
The limitations of the present study were that altered mental status was not considered as one of the clinical manifestations of UTI in the elderly, which could have mitigated the total number of study subjects included in the study. In addition, the phenotypic confirmation of ESBL-positive organisms was done using only Ceftazidime/Clavulanic Acid and not Cefotaxime/Clavulanic Acid as per the latest CLSI guidelines. As a result, there may be under-reporting of the incidence of ESBL organisms in the present study.
In conclusion, we report a significantly high resistance to common antibiotics among the uropathogens in the present study. Furthermore, the very high rate of ESBL-positive UTI is of concern, and monitoring for the same is necessary to prevent treatment failure and increased morbidity and mortality with UTI.
Loss of a limb for any a reason is a major event with profound implications on the psychological health of an individual involved. It has been seen that 20-60% of the amputees attending surgical or rehabilitation clinics are assessed as being clinically depressed1-3. Individuals suffering traumatic limb loss at any age are likely to suffer subsequent difficulties with their body image, but these relationships are more striking in the younger age groups who have experienced traumatic injuries. The psychological reactions to amputation are clearly diverse and range from severe disability at one extreme; determined and effective resumption of a full and active life at other end. Indeed, among adults the age at which an individual receives the amputation is also an important factor. The investigation of psycho-social adaptation to amputation has generated a plethora of clinical and empirical studies 4-7. An amputation is typically equated with loss of once perception of wholeness 8, loss of spouse 9, symbolic castration and even death 10, 11. The individual’s response to a traumatic event is influenced by personality traits, psychiatric premorbid state, gender, peri-traumatic dissociation, prolonged disability of traumatic events, lack of social support and inadequate coping strategies 12-15. Even though the previous research on consequences of amputation has focused primarily on relationships among demographic variables, coping mechanisms, and outcome measures; there is lack of literature on prevalence of various specific psychiatric disorders post-amputation 16, 17. Most of the literature and research on prevalence of specific psychiatric morbidity has largely focused on symptoms of depression18.
To the best of our knowledge there has been very little published about the psychiatric co-morbidity in the victims of amputation. In view of paucity of studies in this field, especially due to prevailing sociopolitical disturbances in Kashmir valley (Indian administered), study of amputation and its co morbid psychiatric conditions seems crucial for planning care management of these patients. Such a study seems justified for more than one reason, as the present state of affairs is in sharp contrast to the traditional circumstances that people of valley used to live in. The aim of our current study is:
To study various socio-demographic variables of amputees.
To find prevalence of psychiatric disorders in amputees from the out-patient population of the bones and joint surgery hospital, Srinagar which also has an artificial limb rehabilitation centre attached with it.
Materials and methods:
The study was conducted in the Post Graduate Department of Orthopaedics, Govt. Medical College, Srinagar. This 200 bedded hospital is the sole orthopaedic hospital in the Kashmir valley and Ladakh and caters to the needs of all districts of the valley and Ladakh region and some areas of Jammu province. It is affiliated to Govt. Medical College, Srinagar as the teaching hospital, for both under and post graduate studies. A total of 100 patients were studied. The sample comprised of 100 consecutive cases of amputation. Patients who had an amputation were identified and diagnosed according to DSM-IV 19 lead criteria for psychiatric co morbidity. After patient consent, a detailed history was taken, and a general physical examination was performed to identify any medical problems. A detailed semi structured interview with all relevant items from MINI 20 (mini international neuro psychiatric interview) was administered to all the cases included in the study. The cases were selected on the basis of inclusion and exclusion criterion.
Inclusion criteria:
Informed consent from the patients under study
Amputation of more than one year duration
Age more than 14 years and less than 60 years
Patients were included in the study irrespective of their sex
Exclusion criteria:
Those who do not give consent
Those persons who have history of any DSM-IV axis I or axis II disorder before the development of amputation.
Presence of disabling medical or neurological conditions like motor neuron disease, Parkinson disease, etc.
Age less than 14 years
Age more than 60 years
Observations and results:
The data was categorised according to age, sex, residential address, education etc. Data obtained from the interview of the subjects was analysed and simple percentages were obtained. Besides socio-demographic profile, prevalence of psychiatric co-morbidities and reason for amputations were calculated. Results are shown in tables 1-3.
Table-1: Socio-demographic characteristics of the amputees
Characteristic
Number (n)
Percentage
Age 15-30
45
45
31-45
30
30
46-60
25
25
Sex Male
79
79
Female
21
21
Education Illiterate
61
61
Literate
39
39
Marriage Married
55
55
Un-married
45
45
Residence Rural
81
81
Urban
19
19
Occupation Domestic workers
42
42
Unskilled laborers
19
19
Students
17
17
Businessmen
16
16
Govt. employees
06
06
Religion Islam
95
95
Sikhism
03
03
Hinduism
02
02
Table-2: Indication/cause of amputation
Indication/cause
Number (n)
Percentage
Motor vehicle accident
53
53
Blast
11
11
Land mine
06
06
Fire arm injury
04
04
Others*
26
26
*The others include fall from tree, electrocution, machinery mishap, fall from hillock.
Table-3: Prevalence of psychiatric co-morbidities in amputees
Co morbidity
Number(n)
Percentage
Major depressive disorder
63
63
Post traumatic stress disorder
20
20
Impulse control disorder
19
19
Phantom limb phenomenon
14
14
Generalized anxiety disorder
10
10
Panic disorder
06
06
Sub syndromal PTSD
04
04
None
16
16
Discussion
Socio-demographic profile: In our study we found that males out-numbered females by approximately 4:1 ratio (79% males, 21% females). The majority (45%) of the amputees were males in the age group of 15-30 years, followed by 30% in the age group of 31-45 years and 25% in the age group of 46-60 years. The most likely explanation for this observation is that younger people are known to have higher exposure to the violence as compared to older people. In addition younger patient readily seek help for their psychological problems in comparison to older people. The results are consistent with the study conducted by Ebrahimzadeh et al 21 and Shukla 1 et al. Male predominance could be derived from the reason that ours is a patriarchal type of society where the men are the bread earners of the family and the women usually prefer to stay at home. Another reason could be that men report for rehabilitation and also seek help for their psychological problems more readily. Similar findings have also been reported by Cavanagh et al where they reported 75% of patients were male 22. 55% of our patients were married which could be due to the reason that majority of our sample were of adults in the marriageable age group. The findings of our study are consistent with the earlier reported studies by Margoob et al 23. We also observed that majority (81%) of our cases were from rural areas with low literacy rates. Most likely explanation for this observation is that the majority (74.9%) of the population in our state is from rural back ground. Low literacy rates is explained on the basis that most of the people who visit government hospitals of our valley are from poor background where it is very difficult for people to achieve and afford formal education. The other reason could be that Jammu & Kashmir is one of the states of India where literacy rates are low (54.46%) than average in India (65.38%) 24. Shukla et al in their study of amputees reported that majority of their patients were uneducated 1. In our study majority of the patients (95%) were Muslim. This is explained by the demographic profiles of the valley of Kashmir-Muslims are the majority community and other communities like Hinduism, Sikhism form part of minority. The greater percentage of Muslims is also substantiated because of mass exodus of minority community in early nineties with start of armed conflict in Kashmir whereby non Muslims migrated amass to different parts of the country.
Reason for amputation: In our study motor vehicle accident account for majority (53%) of the amputations. Most plausible explanations include overwhelming increase of traffic with road being in dilapidated conditions, narrow lanes, lack of driving skills by the motorists, lack of road signs and poor judgment while crossing the road by the pedestrians across the valley 25. The lawlessness and violence in valley also contribute to reckless driving and negligence of law enforcement agencies. The other collective percentage of 21% which includes 11% for blast injuries, 6% for land mine explosions and 4% for fire arm injury is significant by all means because of the ongoing sociopolitical disturbance in Kashmir since 1990s. The above findings are in accordance with high prevalence of traumatic events in Kashmir as observed by Margoob et al 23. The study revealed that 59.51% of adult men and 57.39% of women have lifetime prevalence of exposure to traumatic events.
Prevalence of psychiatric co-morbidities:The most common co morbid psychiatric condition in our study was major depressive disorder. 63% of patients were suffering from it. Our results are in accordance with the study conducted by Shukla et al (70.2%). Similar findings have also been reported by Rendal et al 3 and Kashif et al 26.In our study 40% of patients were suffering from anxiety disorders which included 20% as PTSD (Post Traumatic Stress Disorder), 4% as ssPTSD (sub syndromal PTSD), 10% as GAD (Generalized Anxiety Disorder), and 6% as panic disorder. The higher prevalence of PTSD in our study sample is because of higher rate of PTSD in this part of the world as reported in a series of studies by Margoob et al 23. The results of our study are also in agreement with those reported by Fukunishi 26 (33.9%), and Grieger et al 27. 19 % of patients in our study reported impulse control disorder in the form of crying spells and outbursts of anger. The lower prevalence of phantom phenomenon (14%) in our sample could be attributed to the fact that the time duration since amputation was variable and usually of longer duration. This is in agreement with the study by Ebrahimzadeh et al 21 where it is reported that 40% of the patients had phantom sensation and 32% were suffering from phantom pain. In another study by Lacorix et al 29, 90% had phantom sensation and 29% had phantom pain. Our observation is further substantiated by Melzack 30, Sherman et al 31, and Pezzin Et al 32 who in their respective studies reported that phantom limb sensation and pain gradually decreases with time. In our study 16% of the patients reported to have no psychiatric co morbidity. This could be due to various coping strategies adopted by the patients with primarily religious and spiritual involvement and obedience to local clergy, Imams (person who leads daily worship services at mosques) and spiritual healers 33. This observation is in agreement with the study by Margoob et al 34. In another study Huda et al 33 and Margoob et al 36 found that resorting to religious practices happens to be most often used coping method for dealing with problems and intense emotions of trauma in Kashmiri society. Similar observations have been made by studies in internally displaced people of Chechnya by Jong Kde et al 35.
In light of the above observations of our study, spreading awareness about the co-morbid psychiatric disorders in amputees can be very helpful in diagnosing and proper treatment of such cases and further to prevent chronic debilitating course associated with amputation. More intensive physical and psychiatric rehabilitation with the attention to the provision of prosthesis, retraining, and financial support packages may improve the quality of life of these patients.
Limitations of our study include a small sample size (100). Also results can’t be generalised for rest of India or Asia because of socio-political and religious practice differences.
Conclusion:
Psychiatric co-morbidities are very common in amputees in our study. Most of the patients were married males of younger age group from rural areas. The majority of the sample population comprised of unemployed people and those less educated. Major depressive disorder is the most common co-morbidity followed by anxiety disorders in which PTSD subjects were predominant followed by impulse control disorder and phantom phenomenon respectively. A significant number reported no symptoms of mental health illness.
Troponin T is a protein component of cardiac muscle. When death or damage of the myocardium occurs, it is released in to the circulation and can be detected by immunoassays 1. Troponin T is a sensitive and specific marker of myocardial damage when taken at least 12 hours after a suspected cardiac event and can be detected up to 7-10 days after myocardial damage 1,2. When used in conjunction with clinical history, electrocardiograms (ECGs) and cardiac imaging it is effective in excluding acute coronary syndrome (ACS) and myocardial infarction (MI). The cost of a Troponin T assay is £3.75 per sample inclusive of staff time.
Troponin concentrations have been incorporated in up to date definitions of acute MI. One of the criteria for diagnosis of acute MI is the detection of rise and/or fall of cardiac biomarkers (Troponin) with at least one value above the 99th percentile of the upper reference limit (URL) together with evidence of myocardial ischaemia with at least one of the following: ischaemic symptoms, new ischaemic ECG changes, pathological Q waves on ECG, or imaging suggesting loss of viable myocardium or new regional wall abnormality 3. Other criteria include unexpected cardiac death involving cardiac arrest, Troponin concentrations associated with percutaneous coronary intervention (PCI) and coronary bypass grafting (CABG) and pathological findings of acute MI 3. Troponin T is an important component of the risk stratification of patients with acute myocardial ischaemia and can be used to predict 30-day mortality 4,5.
Detection of a rise and/or fall in Troponin T concentration is important when diagnosing acute MI 3,6. It is the rise and fall that differentiates individuals who have sustained myocardial damage from other causes such as chronic kidney disease (CKD) 3, 7. In these other conditions the elevated Troponin T concentrations are sustained. To establish the diagnosis of MI, one elevated value above the decision level is required. The demonstration of a rise and/or fall in Troponin T levels assists clinicians in distinguishing elevated background Troponin T concentrations from elevations in the same patients suggestive of MI. Detection of rise and/or fall also identifies those patients with re-infarction within a short time period after an acute MI 8.
It is important to remember however that if the patient presents 24 hours after the onset of symptoms this rise and fall of Troponin T concentration is not necessary to make the diagnosis of MI. Troponin T levels must be interpreted in the light of the clinical presentation. An elevated concentration of Troponin T in the absence of clinical evidence of ischaemia should prompt a search for other aetiologies, such as CKD, congestive heart failure, myocarditis, aortic dissection, or pulmonary embolism 3, 6.
Risk stratification also includes the measurement of lipid profile in those presenting with suspected ACS or MI. To ensure that a cholesterol level representative of the patient’s normal baseline the blood sample must be organised within 24 hours of the event. In those with delayed presentation or where cholesterol is omitted on admission clinicians should wait until 3 months after the event to obtain a reliable cholesterol level, although most would be expected to have started lipid-lowering medications 9,10,11.
Method
We studied Troponin T requests made between 4pm and 7pm for a four-month period. Request cards were retrieved and the Troponin T result for each request was obtained. Any other Troponin T results obtained at any time relating to that event were noted as well as any rise and fall of the Troponin T concentrations. Review of the hospital notes for each patient established the working diagnosis, whether any other appropriate investigations had been carried out during admission, co-morbidities that were present and current relevant medications.
The final patient outcome was noted. The number of patients discharged on the same day, who would have otherwise been admitted overnight, based on Troponin T concentration was determined. Those patients with a Troponin T concentration above the 99th percentile of the upper reference limit (URL) used in the local laboratory (Troponin T <0.03ug/L) who were not discharged on the day of Troponin T measurement were identified and the reason for admission determined. The fiscal impact of the extended laboratory service was calculated.
Results
Of 162 Troponin T requests received during the four-month period, 140 (86%) were included in the study; 22 (14%) were excluded (12 haemolysed, 1 unlabelled, 2 not on computer system, 7 clinical notes unavailable).
The study population comprised of 74 (53%) male and 66 (47%) female patients. The age range was 21 – 101 years; mean (±SD) 67.6 (±16.8).
Half of Troponin T requests were received from the Acute Assessment Unit (AAU), 20% from the Emergency Department, 14% from inpatients, 8% from the Critical Care Complex (CCC) and 8% from the Coronary Care Unit (CCU).
Clinical notes indicated that 97 (69%) of Troponin T requests were taken appropriately at least 12 hours after the onset of the event, 19 (14%) were taken less than 12 hours after the event, in the remaining 24 (17%) the time of sample in relation to the event was not known. Interestingly only 30% of request cards had documented that sample was taken at least 12 hours after the event.
The indication documented on each request card is detailed in Figure 1. Indications detailed under other included: trauma, sepsis, collapse, cold & clammy, oesophageal cancer with hypercalcaemia, poor complex tachycardia, post-operative after abdominal aortic aneurysm repair, respiratory infection, sweating, palpitations, fall and repeat bleed because of previously unsuitable sample.
Figure 1: Indication noted on request card for Troponin T. ACS: acute coronary syndrome, MI: myocardial infarction, SOB: shortness of breath, LVF: left ventricular failure, CCF: congestive cardiac failure.
One hundred and two (73%) patients had a non-elevated Troponin T concentration of <0.030ug/L and 38 (27%) had an elevated Troponin T concentration >0.03ug/L. Only 5 (4%) patients had the rise and fall of Troponin T documented.
Eighty-three (59%) patients had no lipid profile measured during the attendance/admission. Of the remaining 57 patients, 31 (54%) had cholesterol assayed within 24 hours of the event, in 16 (28%) the cholesterol was taken between 2 and 17 days after the event and in 10 (18%) patients the time of cholesterol assay in relation to the event was not known. Overall only 1 in 5 patients had a lipid profile obtained within 24 hours of the event.
Interestingly of the 38 patients with raised Troponin T concentration of >0.03ug/L only 13 (34%) had a lipid profile organised. Only 7 of the 13 (54%) were obtained within 24 hours of the event, 4 were taken between 2 and 10 days after the event and in 2 patients it was not known when the lipid profile was obtained in relation to the event.
Overall no correlation was noted between cholesterol and Troponin T concentrations in all patients who had an elevated Troponin T concentration and cholesterol measured. Interestingly in those where cholesterol was measured within 24 hours of the suspected cardiac event there was some correlation, but the numbers involved were small.
The working diagnosis as stated in hospital notes is documented in Table 1.
Table 2: Reason why those patients with non-elevated Troponin T concentration of <0.03 (ug/L) were not discharged on the same day by the clinician.
Reason for admission
Number of patients
Trop T assayed <12hrs
5 (8%)
Ongoing chest pain
10 (15%)
ECG changes
3 (5%)
High CAD risk patient
2 (3%)
Monitoring and cardiology review
2 (3%)
Already inpatient
7 (10%)
Repeat attendance in 24hrs
1 (1%)
Other medical (non-cardiac) problem
28 (42%)
No reason documented
6 (9%)
Outcome not available
1 (1%)
Self discharge
2 (3%)
Total
67 (100%)
All of the 36 (26%) patients except one who were discharged on the day of Troponin T assay had a negative Troponin T concentration of <0.030ug/L. This patient had CABG one month previously and presented with chest pain and associated cough, although his Troponin T was 0.14ug/L, this was deemed not significant in view of a previous Troponin T concentration of 0.16ug/L assayed two days earlier.
Sixty three (45%) patients remained in the AAU or were admitted to a medical ward, 15 (11%) were admitted to CCU, 4 (3%) to CCC and 18 (13%) were already inpatients. Of the remaining 3 patients, 2 self-discharged and in 1 the final destination was not available.
Of those patients with a raised Troponin T concentration of >0.03ug/L 5 died during this attendance.
The majority (60/102) of patients in whom Troponin T was not raised (<0.030ug/L) still required hospital admission (Table 2). Another 6 patients with a non-elevated Troponin T concentration had no obvious reason for admission documented.
Based on an overnight stay cost of £657 we conclude that the laboratory’s extension of Troponin T service of 3 hours would save the hospital £70,956 annually. No additional manpower was required to provide the extended laboratory service as Biomedical Scientists are already providing urgent out of hour on-call service for other biochemical analysis. No additional laboratory costs were incurred, as the same number of samples would have been analysed during working hours the following day.
Discussion
There was sufficient demand for Troponin T assay to justify extension of the laboratory service for 3 hours each day. As expected most requests for Troponin T came from the AAU and the Emergency Department where the majority of patients with chest pain of potential cardiac origin would initially present. In those patients presenting with suspected myocardial damage 3 out of 4 had chest pain of non-cardiac origin.
In those patients where the time of event was known the majority had an appropriate Troponin T assay taken at least 12 hours after the event suggesting that most of the medical and nursing staff were well informed. In contrast it appears that only few of the medical profession were aware of the need to measure lipid profile soon after admission as only 1 in 5 patients had their lipid profile organised within 24 hours of the event.
The majority of requests had appropriate clinical details to justify Troponin T request. However one in four requests were deemed inappropriate (Fig. 1). Since Troponin T may be raised in other conditions the assay should be reserved for those patients where myocardial damage is suspected. Inappropriate testing is potentially hazardous and may expose patients to further unnecessary invasive investigations e.g. cardiac catheterisation with associated morbidity and mortality.
In patients presenting with chest pain, Troponin T assayed appropriately >12 hours after onset of the event can be used effectively to exclude myocardial damage and discharge can be made on the basis of this result without the need for admission. A small proportion (6%) of patients with non-elevated Troponin T concentrations who had no obvious reason for admission, were deemed unnecessary.
Dyslipidaemia plays an important role in the risk stratification of patients with suspected ACS or MI, yet only one in five patients with myocardial damage had a lipid profile organised within 24 hours of the event. Cholesterol measurements organised between 2 and 17 days after the event would not have been representative of the true concentration and were deemed inappropriate. Too few lipid profiles were assayed within 24 hours of the event in patients with an elevated Troponin T concentration to determine whether there is any correlation between cholesterol and Troponin T concentrations.
Similarly only a small number of patients had the rise and fall of Troponin T documented. The lack of serial measurements of Troponin T concentrations may have resulted in failure to recognise some patients with other conditions, which may cause elevated Troponin T concentrations and potentially subject them to unnecessary further invasive investigations.
The provision of the extended laboratory service had a positive impact; it enabled earlier discharge of patients with chest pain of non-cardiac origin, resulted in fewer unnecessary overnight hospital admissions and reduced the demand on hospital beds. Extending the service did not result in extra work for junior doctors, on the contrary by improving the efficiency of the process has not only speeded the patient journey but has improved junior doctors’ time-management.
We have shown that extending the provision of Troponin T assay for 3 hours daily has both fiscal and management benefits and reduces the number of unnecessary hospital admissions. Further extension to incorporate a 24-hour laboratory service for this assay would potentially reduce hospital admissions further with more potential savings.
Conclusion
Extending the provision of Troponin T assay for 3 hours daily has fiscal and management benefits and reduces the number of unnecessary hospital admissions of patients presenting with chest pain of non-cardiac origin.
Learning Points • Extending Troponin T service has a fiscal benefit. • Rise and fall of Troponin T values should be documented. • Lipid profile should be organised within 24 hours in all patients presenting with chest pain of potentially cardiac origin. • Measuring Troponin T where myocardial damage is not clinically suspected is potentially hazardous and may expose patients to further inappropriate and invasive investigations with associated morbidity and mortality. • In the current climate of litigation detailed documentation is necessary.
Patients, in both the pre and post-operative periods, seek and receive advice from a number of health professionals. The advent and subsequent increasing use of day case surgery has also meant that patients have a reduced exposure to the surgical staff. This subsequently results in patients increasingly seeking post-operative advice from their general practitioner and allied health care professionals. The development of innovative surgical techniques has meant that the traditional teachings with regard to time taken for convalescence following surgery are somewhat outdated. The aim of this study was to initially determine the exact time taken for patients to return to work, driving and daily routine for a number of routine general surgical procedures. Secondly we aimed to determine the advice that GPs and surgeons would give to patients following routine surgery.
Patients and Methods
Patients aged 65 years or less, who had routine surgical procedures (open unilateral inguinal hernia repair, laparoscopic cholecystectomy, laparoscopic hernia repair and unilateral varicose vein surgery) over a six month period (January – June 2004) were identified from the theatre database. A single page questionnaire was sent to each patient (Appendix 1). Each patient was questioned with regard to the following:
Occupation
Time taken to return to normal activities following surgery
Time taken to return to driving following surgery and any advice given
Expected and actual time off from work following surgery
Distribution and length of a sick note
Expectations following surgery
Experience of day case surgery
Questionnaires were returned and data collected on a specially constructed database. Concurrent to this a further questionnaire (Appendix 2) was distributed to a number of differing groups of health professionals. These were namely:
GPs – this included the GPs of all patients who had been identified as having undergone surgery in the specified six month period as well as all doctors on the vocational training scheme.
Surgeons – this included all senior house officers on the Yorkshire School of Surgery Basic Surgical Training Scheme and all Higher Surgical Trainees (General Surgery) within the Yorkshire Deanery including non-carrier grade doctors .
Replies were anonymous and each health care professional was asked with regards to the advice they would give to an “average” patient undergoing the four procedures with regard to time it would take to return to work (office or heavy), driving and return to normal activities. They were also asked whether they felt the procedure was suitable for day case surgery. Statistical Analysis Statistical analysis was undertaken using the Analyse-it statistical package (Leeds, UK.). Non-parametric analysis using either Kruskall 1- way ANOVA or the Mann-Whitney U test was used to test for a difference between the medians of independent samples. The Wilcoxon signed-ranks test was used to test for a difference between the medians of 2 related samples. Significance was determined as a p-value < 0.05. Results Nineteen of 48 patients who underwent varicose vein surgery (39%), 44 of 72 patients who underwent a laparoscopic cholecystectomy (61%), 23 of 35 patients who underwent a laparoscopic hernia repair (65%) and 12 of 23 patients who underwent an open inguinal hernia repair (52%) over the six month period returned a completed questionnaire. Of the health care professionals, 65 primary care physicians were identified and sent questionnaire, of which fifty three GPs (81.5%) replied. From the Yorkshire deaneries database sixty five trainees were identified (Spr, SHO, HO, non-carrier grades), of which 41(63.2%) surgically trained doctors returned a completed questionnaire. Among the responders, we also include four consultant surgeons who have performed the operations on patients in our hospital. Overall one hundred and thirty participants were sent study forms, of which 94 (72.3%) health professionals responded with completed questionnaire. Varicose Vein Surgery (Table 1)
Activity
Time (IQR in Weeks)
Overall (K)
Surgeons vs. GPs (M)
Surgeons vs. Patients (M)
GPs vs. Patients (M)
Office Work
Surgeons
2 (1-2)
GPs
2 (1-2)
0.13
0.56
0.10
0.05
Patients
1 (1-2)
Heavy Work
Surgeons
3 (2-5)
GPs
4 (2-4)
<0.01
0.75
<0.01
<0.01
Patients
1 (1-1.75)
Driving
Surgeons
2 (1-2)
GPs
2 (1-2)
<0.01
0.24
<0.01
0.02
Patients
1 (1-1)
Normal Activities
Surgeons
2 (2-4)
GPs
2 (2-4)
0.05
0.57
0.04
0.02
Patients
1.5 (1-2)
Table 1: Time taken to return to work, driving and daily activities as experienced by patients and as suggested by both surgically trained doctors and GPs for unilateral varicose vein surgery. Time: Median time to return to activity (IQR - weeks) K: Kruskal Wallis ANOVA. M: Mann Whitney U test. P<0.05 deemed as significant. Of the 19/48 patients who returned a completed questionnaire, eleven (57.8%) were women with an overall median age 44 years (range 21-64 years). Seventeen of the 19 patients worked (89%), 11 of who undertook office work (57.8%). Patients tended to return to driving and normal activities quicker than that recommended by doctors. GPs and surgeons offered similar advice with regard to return to all activities following varicose vein surgery. Nine of the 19 patients were uncertain about whether they have received any advice or perhaps forgotten any information regarding when to return to driving. Five patients received no advice about when to return to work. No significant difference was observed between expected time off work and actual time off work experienced by the patients (2 weeks vs. 1 week – p=0.15 Wilcoxon Rank test). Fifteen of the 19 patients (79%) said that their recovery was what they had expected with the reasons for not meeting expectations being wound infection in 2, bruising and a larger incision in one patient each. Seventeen patients had their surgery performed as a day case (89.4%). Fifteen patients stated that they would have surgery again as a day case (88.2%). Laparoscopic Cholecystectomy (Table 2)
Activity
Time (IQR - weeks)
Overall (K)
Surgeons vs. GPs (M)
Surgeons vs. Patients (M)
GPs vs. Patients (M)
Office Work
Surgeons
2 (1-2)
GPs
2 (2-3)
<0.01
0.02
<0.01
<0.01
Patients
5 (3-7)
Heavy Work
Surgeons
4 (2-4)
GPs
4 (4-6)
<0.01
<0.01
0.26
0.04
Patients
2 (1.5-4)
Driving
Surgeons
2 (1-2)
GPs
2 (1-3)
0.19
0.19
0.10
0.43
Patients
2 (1-4)
Normal Activities
Surgeons
2 (1-4)
GPs
3 (2-4)
0.19
0.20
0.09
0.47
Patients
4 (2-6)
Table 2: Time taken to return to work, driving and daily activities as experienced by patients and as suggested by both surgically trained doctors and GPs for laparoscopic cholecystectomy. Time: Median time to return to activity (IQR - weeks) K: Kruskal Wallis ANOVA. M: Mann Whitney U test. Of the 44/72 patients who returned a completed questionnaire 39 were women (88.6%) with an overall median age 47 years (range 20-63 years). Thirty-two of the 44 patients worked (72%), 25 of who undertook office work (56%). Patients returned to office work significantly later than that recommended by both groups of doctors. Overall, patients took a significantly shorter time to return to work that involved lifting heavy objects. Surgeons also recommended shorter times to return to work when compared with GPs. Of further interest is the observation that it took a shorter time for those patients undertaking heavy work to return to work when compared with the patients undertaking office work. There was no significant difference in the time taken to return to driving and normal activities experienced by the patients when compared to the advice given by both groups of doctors. Ten of the 44 patients (22%) stated that they had received no advice regarding when to return to driving or perhaps they may have no memory about driving instructions. Seven patients stated they received no advice about when to return to work (15%). Overall, patients expected a significantly shorter time off work than was actually experienced (2.5 weeks vs. 4 weeks – p<0.01 Wilcoxon Rank test). Twenty-one of the 44 patients (48%) said that their recovery was not what they had expected (47%). Of these 21 patients, 6 said that their recovery was better than expected (28%), 5 said that their recovery was longer than expected (23%), and the rest either complained of pain or wound infection. Seventeen patients had their surgery performed as a day case (38%). Of these 17, 11 said that they would have surgery again as a day case (64%). A significantly higher proportion of GPs felt that this procedure was suitable for day case surgery compared with the proportion of patients who actually underwent the procedure as a day case (p=0.02 chi squared test). Laparoscopic Inguinal Hernia Rapair (Table 3)
Activity
Time (IQR - weeks)
Overall (K)
Surgeons vs. GPs (M)
Surgeons vs. Patients (M)
GPs vs. Patients (M)
Office Work
Surgeons
2(1-2)
GPs
2 (1-2)
0.73
0.56
0.48
0.714
Patients
2 (1-2.75)
Heavy Work
Surgeons
6 (4-6)
GPs
4 (4-6)
0.03
0.31
0.01
0.03
Patients
3 (2-4)
Driving
Surgeons
2 (1-4)
GPs
2 (1-2)
0.22
0.21
0.12
0.46
Patients
1 (1-2.25)
Normal Activities
Surgeons
2 (2-4)
GPs
3 (2-4)
0.41
0.87
0.31
0.17
Patients
2.5 (1.25-3)
Table 3: Time taken to return to work, driving and daily activities as experienced by patients and as suggested by both surgically trained doctors and GPs for laparoscopic hernia repair. Time: Median time to return to activity (IQR - weeks) K: Kruskal Wallis ANOVA. M: Mann Whitney U test. Of the 23/35 patients who returned a completed questionnaire, the majority had bilateral hernias repaired. 22 were men (95%) with an overall median age 48 years (range 35-63 years). Twenty one of the 23 patients worked (91%), 10 of who undertook office work (43%). No significant difference was found between the actual time taken to return to office work and the advice given by either group of doctors. Patients returned to heavy work significantly sooner than that recommended by both groups of doctors. There was no significant difference in the time taken to return to driving and normal activities experienced by the patients when compared to the advice given by both groups of doctors. Three (13%) patients were uncertain about receiving advice regarding when to return to driving or they might have no memory of information received. Six (26%) patients stated they cannot recall about receiving any advice regarding when to return to work. There was no significant difference seen in the time patients expected off work than was actually experienced (2 weeks vs. 2 weeks – p>0.05 Wilcoxon Rank test). Nine of the 23 patients (39%) said that their recovery was not what they had expected. Of these 9 patients, 2 (22%) said that their recovery was longer than expected, 4 (44%) said that they experienced more pain than they expected; one (11%) said that the recovery time was much shorter and one (11%) experienced some bleeding from the umbilical port. Twenty patients (86%) underwent their surgery as a day-case. Of these 20, 16 (69%) said that they would have their surgery again as a day case. Open Inguinal Hernia Repair (Table 4)
Activity
Time (IQR - weeks)
Overall (K)
Surgeons vs. GPs (M)
Surgeons vs. Patients (M)
GPs vs. Patients (M)
Office Work
Surgeons
2 (2-2)
GPs
2 (1.25-3)
0.01
0.07
<0.01
0.05
Patients
4 (3-4)
Heavy Work
Surgeons
6 (4-6)
GPs
6 (4-7.75)
0.57
0.49
0.47
0.39
Patients
5 (4.25-5.75)
Driving
Surgeons
3 (2-4)
GPs
2 (2-3)
0.03
0.06
0.02
0.15
Patients
2 (1-2)
Normal Activities
Surgeons
2 (2-2)
GPs
2 (1.25-3)
<0.01
0.07
<0.01
0.01
Patients
4 (2.5-5)
Table 4: Time taken to return to work, driving and daily activities as experienced by patients and as suggested by both surgically trained doctors and GPs for open hernia repair. Time: Median time to return to activity (IQR - weeks) K: Kruskal Wallis ANOVA. M: Mann Whitney U test. P<0.05 deemed as significant. All 12/23 patients who returned a completed questionnaire were men with an overall median age 54 years (range 42-65 years). Nine of the 12 patients worked (75%), 5 of whom undertook office work (41%). Patients took a significantly longer time to return to office work when compared to the advice given by either group of doctors. No significant difference was observed in the time taken for patients to return to manual work and the advice given by either group of doctors. Surgeons advised a longer period of abstinence from driving compared to that actually undertaken by the patients. Patients took a significantly longer time to return to normal activities when compared to the advice given by either group of doctors. Two patients (16%) replied that no information was given or may not recall in regards to when to return to driving and one patient (8.3%) stated that he cannot recall any professional advice he has received about return to work. There was no significant difference seen in the time patients expected off work than was actually experienced (3 weeks vs. 5 weeks – p>0.05 Wilcoxon Rank test). Five patients (41%) said that their recovery was not what they had expected. Of these 5 patients, 4 (80%) said that they experienced more pain than they expected and one (20%) experienced more bruising. Seven patients (58%) underwent their surgery as a day-case and of these, 5 (71%) said that they would have their surgery again as a day case. Discussion With the advent of day case surgery there is an increasing number of health professionals giving advice to patients about their post-operative course. Advocates of minimal access surgical techniquesand day case surgery claim that this is associated with a reduction in the periodof postoperative recovery1, 2. The proposed benefits,however, may never be seen if there is no concordance in the advice given by medical practitioners. The advice given to patients is still based upon personal experience rather than firm scientific evidence and indeed, there have been few studies that have analysed patients return to normal activities following surgery. Majeed et al questioned 59 general practitioners and61 surgeons with regard to the time taken for young (25 years old) and older (55 years old) patients to return to sedentary, light manual and heavy manual work following a number of common surgical procedures (including varicose vein surgery, unilateral open inguinal hernia repair and laparoscopic cholecystectomy) 3. The moststriking finding was the enormous variation in opinion betweendifferent doctors. For example, a 55 year old heavy manual workerhaving a haemorrhoidectomy could be given between one and 16 weeks off work depending on which doctor he or she consulted. Such wide variation was not observed in our study and in general, the advice given by both GPs and surgeons was similar apart from the fact that surgeons advised a shorter period off office work for patients undergoing laparoscopic cholecystectomy. The end of the twentieth century has brought an exponential growth in new surgical techniques for standard general surgical procedures. Not only there has been an increase in the use of mesh for open inguinal hernia repairs but there has also been an increasing use of laparoscopic hernia repair, with the recent guidance by the national institute for health and clinical excellence (NICE) liable to further increase the role of laparoscopic repair 4. Furthermore, there has been the widespread acceptance of laparoscopic cholecystectomy and an increased awareness of the role of general anaesthetic in increasing the number of procedures that can be undertaken as a day case. Given these continuing developments in surgical technique as well as in both pre- and post-operative care the present advice and experience of GPs could be seen to be somewhat out-dated. Two surgeons within the unit perform laparoscopic hernia repair (one the transabdominal preperitoneal repair (TAPP) and one the totally extraperitoneal (TEP) repair) with three performing solely the open technique. Although our results based on small sample size but match with evidence based recommendation by NICE (www.nice.org.uk,), suggests that laparoscopic repair does reduce the time taken for post operative recovery when compared to open repair. In fact, all patients returning to heavy work following laparoscopic hernia repair do so quicker than that advised by either GP's or surgeons although unlike the surgeons, GPs do tend to recognise the likely reduction in pain experienced following a laparoscopic repair and alter the advice given to those in heavy work accordingly. Restriction of activity on the advice of surgeons may be basedon their concern for tissue healing and strength, which may have arisen in the days when absorbablesutures such as catgut were used. The use of mesh should now change this thinking and it has indeed been shown that there is no increase in the recurrence of inguinal herniasafter early return to work 5. Office workers undergoing an open inguinal hernia repair take a longer time to return to work (4 weeks) than that advised by both groups of doctors. Furthermore, patients undergoing laparoscopic cholecystectomy take a shorter time to return to heavy work than office work. These results do require more evaluation. At face value it would appear that doctors underestimate the time taken for return to office work and in the case of the cholecystectomy overestimate the time it takes to return to heavy work. In fact the patients in office work took a significantly longer time to return to work following cholecystectomy than those in heavy work. Although only 20% of the working cohort of patients who underwent cholecystectomy were in “heavy work” this result probably represents the fact that a high proportion of people in heavy work are self-employed and time off work is money lost. Patients who are selfemployed return to work much sooner than those in salaried jobs 6. Furthermore, there may well be an element of low job satisfaction in people in office work, which has also been shown to be a major predictor of delayed return to work 7. The time taken to return to work, however, may be dependant on the patients' expectation of convalescencetime formed prior to surgery, which in many cases is based upon advice given by medical practitioners. Furthermore, the attitude of the medical profession in the post-operative period is important as they have to issue the certification necessaryto ensure financial compensation for the patient. Patients undergoing varicose vein surgery returned to heavy work, driving and normal activities significantly sooner than that suggested by either group of doctors. This may well be down to a recently concerted effort to encourage patients to walk to reduce the risk of DVT. All patients had long saphenous vein (LSV) surgery by either the standard high tie, stripping of the LSV and multiple stab avulsions or by local ligation of the LSV. Overall it would appear that a one-week period of recuperation is all that is needed following unilateral varicose vein surgery. The advent of minimally invasive treatment for varicose veins may result in a shorter post-operative recovery period 8. There are some shortcomings associated with this study. Questionnaire based studies always present methodological issues including problems with response rate. There is never an “average patient” and normal activities for one patient may be completely different from those of another patients and any advice given should be individually tailored. Furthermore, occupations were not classified as either manual or office based prior to the start of this study, but were classified on an individual basis during collation of the data. However, we hope that the data presented here will help medical practitioners advising their patients about postoperative routine life activities. Conclusion: We believe that our overall practice is not different with regards to the pre, peri and post-operative management of patients when compared to the majority of units within the UK. However, there may well be some variation with regard to healing and time taken to return to work and we would encourage other units to undertake similar studies to determine convalescence times.
Appendix 1
Sex (Male / Female)
Age at time of surgery.
Do you work
Yes / No
If yes, what job do you do?
How long did it take to you to return to your normal activities of daily living following your operation (weeks).
If you drive, how long did it take for you to start driving again (weeks).
What advice, if any, were you given about driving after your operation?
The following questions are to be completed if you do work.
Prior to your surgery, did you receive any information about how long you would be off work?
Yes / No
If YES, what information was given to you?
How long did you expect to be off work following your surgery (weeks)?
How long were you actually off work following your surgery (weeks)?
If you are in employment:
Did you get a sick-note:
· From the hospital
Yes / No
· From the GP
Yes / No
How long was the sick note for (weeks)?
Did the sick note need to be extended?
Yes / No
Was the recovery after your operation as you had expected it to be?
Yes / No
If no, why not?
Did you go home on the same day as you had your operation?
Yes / No
If YES, would you do the same if you had the operation again or would you prefer to stay overnight after your operation?
If you would prefer to stay overnight, why?
Appendix 2 Dear Doctor. We at xxxxxx Hospital are undertaking a study to determine whether the information given to patients following routine general surgical procedures is consistent and compares to the actual recovery period experienced by the patients themselves. We would be grateful if you would consider the four general surgical procedures below and give us an average length of time (in weeks) that you would advise the patient to abstain from:(a) office work(b) heavy work(c) driving(d) to return to normal activities of daily living The general surgical procedure to be considered are1) mesh repair of an inguinal hernia (unilateral)2) laparoscopic hernia repair 3) unilateral varicose vein surgery4) laparoscopic cholecystectomy
Both Hepatitis B Virus (HBV) and Hepatitis C Virus (HCV) are diseases characterized by a high global prevalence, complex clinical course, and limited effectiveness of currently available antiviral therapy. Approximately 2 billion people worldwide have been infected with the HBV and about 350 million live with chronic infection. An estimated 600,000 persons die each year due to the acute or chronic consequences of HBV 1, 2. WHO also estimates that about 200 million people, or 3% of the world's population, are infected with HCV and 3 to 4 million persons are newly infected each year. This results in 170 million chronic carriers globally at risk of developing liver cirrhosis and/or liver cancer 3, 4. Hence, HBV and HCV infections account for a substantial proportion of liver diseases worldwide.
These viruses have some differences, like HBV belongs to the Hepadnaviridae family and HCV belongs to the Flaviviridae family. HBV has a circular, partially double-stranded DNA genome of approximately 3.2 kb, whereas HCV has a single RNA strand genome of approximately 9.6 kb. HBV and HCV show some common biological features. Both HBV and HCV show a large heterogenicity of their viral genomes producing various genotypes. Based on genomic nucleotide sequence divergence of greater than 8%, HBV has been classified into eight genotypes labeled A through H 5,6,7,8. Different isolates of HCV show substantial nucleotide sequence variation distributed throughout the genome. Regions encoding the envelope proteins are the most variable, whereas the 5’ non-coding region (NCR) is the most conserved 9. Because it is the most conserved with minor heterogeneity, several researchers have considered the 5’ NCR the region of choice for virus detection by reverse transcription (RT)-PCR. Sequence analysis performed on isolates from different geographical areas around the world has revealed the presence of different genotypes, genotypes 1 to 6 10. A typing scheme using restriction fragment length polymorphism analysis of the 5’ NCR was able to differentiate the six major genotypes 11. Hence both HBV and HCV genotypes display significant differences in their global distribution and prevalence, making genotyping a useful method for determining the source of HBV and HCV transmission in an infected localized population 12 - 27.
Many studies have been conducted to study the prevalence of HBV and HCV co-infection among HIV-infected individuals and intravenous drug users globally 28 -3 4.There are only a few studies relevant to the epidemiology of these types of infection in the normal healthy population 35,36,37. The objective in this study was to determine the seroprevalence of HBV and HCV, co-infection of both these viruses and their genotypes, among an apparently healthy female population as well as from known HBV patients in Karachi, a major city in the province of Sindh, Pakistan. This study is also aimed at providing the baseline data on HBV/HCV co-infection, in order to gain a better understanding of the public health issues in Pakistan. We evaluated the antigen, antibody and genotypes of both HBV and HCV in 144 otherwise healthy female individuals and 28 diagnosed HBV patients.
Materials and Methods:
Study duration:From March 2002 to October 2006 & April 2009
Study participants: Total 4000blood serum samples were collected from healthy female student volunteers and 28 serum samples (April 2009) from already diagnosed Hepatitis B positive patients, aged 16 to 65 years from two Karachi universities and one Karachi hospital. University samples were obtained through the Department of Microbiology, University of Karachi and the Department of Microbiology, Jinnah University for Women. Hospital samples were obtained through the Pathological Laboratory of Burgor Anklesaria Nursing Home and Hospital.
Ethical Consent: Signed informed consent forms were collected from all volunteers following Institutional Review Board policies of the respective institutes.
Pre study screening:All 4028 volunteers had health checkups by a medical doctor before collection of specimens, they were asked about their history of jaundice, blood transfusion, sexual contacts, and exposure to needles, and if they had undergone any surgical and dental procedures.
Biochemical & Hematological screening:On completion of the medical checkups, volunteers were asked to give 5mL of blood for different haematological [(complete blood picture (CP), haemoglobin percentage (Hb%) and erythrocyte sedimentation rate (ESR)] and 10mL for different biochemical tests [(direct bilirubin, indirect bilirubin, total bilirubin, aspartate aminotransferase (AST), alanine aminotransferase (ALT), and alkaline phosphatase (ALP)]. Serological analysis:Samples were also subjected to serological analysis for hepatitis B surface Antigen (HBsAg), HBs antibodies and HCV antibodiesusing rapid immunochromatography kits (ICT, Australia and Abbott, USA). Confirmatory test for HBsAg was done by using ELISA (IMX, Abbott, USA).
All the above mentioned preliminary tests were conducted at the respective institutes in Karachi. Out of 4000 female volunteer from the two universities, 144 otherwise healthy females tested positive for HBsAg. 2 out of the 144 HBsAg positive females were also found to be positive for anti-HCV antibodies. The other 28 positive HBV patients from Anklesaria Hospital were only tested for HBsAg and all 28 were positive for HBsAg. Hence, a total of 172 HBV positive samples (144 + 28 = 172) including the 39 HCV positive serum samples obtained from Karachi were used for genotypic evaluation at Claflin University, South Carolina, USA. Specific ethnicity was not determined but we assume these study participants represent a collection of different ethnic groups in Pakistan.
DNA/RNA extraction and amplification of 172 HBV positive samples: DNA was extracted for HBV, and RNA was extracted for HCV analysis from 200μL of all 172 positive HBV serum samples using PureLink™ Viral RNA/DNA Mini Kit according to manufacturer’s instructions (Invitrogen, CA). Amplification was carried out using puReTaq Ready –To-Go PCR Beads (Amersham Biosciences, UK).
Determination of HBV and HCV genotypes by nested PCR: The primer sets for first-round PCR and second-round PCR, PCR amplification protocol, and primers for both HBV and HCV genomes and genotyping amplification for all 172 samples followed previously reported methods [45, 46]. First round amplification targeted 1063bp for the HBV genome and 470bp for the HCV genome. These respective PCR products for both HBV and HCV were used as a template for genotyping different HBV genotypes A to F and HCV genotypes from 1 to 6. HBV A through HBV F genotypes and HCV 1 through 6 genotypes for each sample were determined by separating the genotype-specific DNA bands on 2% agarose gels, stained with ethidium bromide. The sizes of PCR products were estimated according to the migration pattern of a 50bp DNA ladder (Promega, WI).
Results:
Before screening for HBV status, all 4000 healthy female volunteers from the Department of Microbiology, University of Karachi, and the Department of Microbiology, Jinnah University for Women were subjected to routine physical checkups for exclusion criteria i.e., either they were apparently unhealthy or malnourished (23 volunteers were excluded). All 4000 serum samples were screened by immunochromatography for the presence of HBsAg, anti HBs antibodies and anti-HCV antibodies. Positive results were confirmed by ELISA. Out of 4000 subjects 144 (3.6%) tested positive for HB surface antigen (HBsAg), 2 (0.05%) were positive for anti-HCV antibodies, and 3856 (96.4%) were negative for HBsAg and 3998 (99.95%) were negative for HCV antibodies by both immunochromatography and ELISA. Out of these 144 individuals who tested positive for HBsAg, 20 (13.8%) were positive for anti-HB surface antibodies and 2 (1.4%) tested positive for anti-HCV antibodies. The rest of the 28 serum samples obtained from already diagnosed HBV positive samples from Anklesaria Hospital were only tested for HBsAg and were all positive for HBsAg.
The haematological parameters: WBC count, RBC count, hematocrit and platelet count of the 172 HBsAg positive individuals were within the normal recommended range of values, while mean Hb% was 9.8±1.6 g/dL. Direct bilirubin (0 to 0.3 mg/dL), indirect bilirubin (0.1 - 1.0 mg/dL), total serum bilirubin (0.3 to 1.9 mg/dL), ALT (0 - 36 U/L), AST (0 - 31 U/L) and alkaline phosphatase (20 - 125 U/L) were also within the normal range for 129 HBsAg positive individuals, except for the raised ALT (>36 U/L) and AST (>31 U/L) levels in 38 participants with a previous history of jaundice who were also positive for HBsAg.
All 172 samples that were positive for HBsAg were confirmed for the presence of different HBV genotypes as well as for different HCV genotypes by PCR to see the co-infection of both these viruses. Genotyping was carried out at the South Carolina Center for Biotechology, Department of Biology, Claflin University, Orangeburg, SC, U.S.A. For HBV: Mix A primers were targeted to amplify genotypes A, B and C, and primers for Mix B were targeted to amplify genotypes D, E and F. For HCV: primers for Mix A were targeted to amplify genotypes 1a, 1b, 1c, 3a, 3c and 4. Primers of Mix B for HCV were targeted to amplify genotypes 2a, 2b, 2c, 3b, 5a, and 6a.
Table 1. Prevalence of both single and co-infection of HBV genotypes among the apparently healthy female student sample and known HBV positive patients from Anklesaria hospital in Karachi.
2 Universities
Samples
Percentage
Total HBV
144
Genotype D
70
48.6%
Genotype A
8
5.5%
Genotype F
7
4.9%
Genotype B
5
3.5%
Genotype E
3
2.1%
Genotype C
2
1.4%
Co-infections of HBV Genotypes
49/144
34%
Genotype B/D
30/144
20.8%
Genotype A/D
11/144
7.6%
Genotype A/D
4/144
2.8%
Genotype B/C
4/144
2.8%
Anklesaria Hospital
Samples
Percentage
Total HBV
28
Genotype D
19
67.9%
Genotype A
3
10.7%
Genotype B
1
3.6%
Genotype C
1
3.6%
Genotype F
1
3.6%
Co-infections of HBV Genotypes
Genotype B/A
3/28
10.7%
Figure 1: Electrophoresis patterns of PCR products from different HBV genotypes as determined by PCR genotyping system. Genotype A: 68bp, genotype B: 281bp, genotype C: 122bp, genotype D: 119bp, genotype E: 167bp and genotype F: 97bp.
Table 1 illustrates the prevalence of both single and co-infection of HBV genotypes from both the universities in Karachi and Anklesaria hospital. Representative 10 samples in Fig. 1 show single and co-infections for HBV.
Besides looking at the HBV genotypic status of these 172 patients by PCR, we also looked at the HCV genotypic status of the positive HBV patients by PCR so as to see if there was existence of co-infection of the two viruses i.e. HBV and HCV in the same individuals as only 2 samples tested positive for anti-HCV antibodies by rapid immunochromatography. Table 2 shows the prevalence of HCV genotypes among the apparently healthy female student population from the 2 universities in Karachi and known HBV individuals samples obtained from Anklesaria hospital. Fig. 2 shows different HCV genotype infection in the 10 representative samples shown in Fig. 1 showing HBV infection with different genotypes.
Table 2. Prevalence of HCV genotypes among the apparently healthy female student sample, and known HBV individuals from Anklesaria hospital in Karachi.
2 Universities
Samples
Percentage
Total HCV/Total HBV
39/144
27.1%
Genotype 3a
26/39
66.6%
Genotype 6a
5/39
12.8%
Genotype 3b
4/39
10.3%
Genotype 5a
4/39
10.3%
Anklesaria Hospital
Samples
Percentage
Total HCV/HBV
4/28
14.3%
Genotype 3a
2/28
7.14%
Genotype 2a
1/28
3.6%
Genotype 5a
1/28
3.6%
Figure 2: The sizes of the genotype-specific bands for HCV amplified by PCR genotyping method are as follows: genotype 2a, 190 bp; genotype 3a, 258 bp; genotype 3b, 232 bp; genotype 5a, 417 bp; and genotype 6a, 300 bp.
To summarize the results it was found that out of 172 HBsAg positive samples from the two universities (144 HBV samples) and Anklesaria Hospital (28 HBV samples), 89 (51.7%) were genotype D, 11 were genotype A (6.4%), 8 were genotype F (4.6%), 6 were genotype B (3.5%), 3 were genotype E (1.7%), and 3 were genotype C (1.7%). Out of 43 positive for HCV by PCR from the two universities (39/144 HBV samples) and Anklesaria Hospital (4/28 HBV samples), 65.1% (28/43) showed infection with 3a, followed by genotypes 5a (5/43 = 11.6%), 6a (5/43 = 11.6%), 3b (4/43 = 9.3%) and 2a (1/43 = 2.3%).
Discussion:
Viral hepatitis due to HBV and HCV has significant morbidity and mortality worldwide. The global prevalence of HCV is 3% 38 and the carrier rate of HBsAg varies from 0.1% to 0.2% in Britain and the USA, to 3% in Greece and southern Italy and up to 15% in Africa and the Asia 39. Pakistan is highly endemic with HBV. Studies are too limited to give a clear picture of the prevalence of HBV at the national level, especially among apparently healthy individuals. Most previous studies targeted different small groups of individuals with some clinical indications, so they do not accurately reflect the overall prevalence in Pakistan40. Our previous study was conducted on a first group of 4000 healthy female students from the two universities i.e., Department of Microbiology, University of Karachi and Department of Microbiology, Jinnah University for Women for the prevalence of HBV. We have reported earlier that genotype D appears to be the dominant genotype prevalent in Karachi, Pakistan’s apparently healthy female population, and genotype B appears to be the next most prevalent genotype 41, 42. In this study we checked the prevalence of both HBV and HCV in a second group of 4000 healthy female students from the same two universities in Karachi mentioned above, as well as the already 28 diagnosed HBV patients from Anklesaria Hospital in Karachi, Pakistan.
Both HBV and HCV are present in the Pakistani population and there are varying reports of disease prevalence. HCV is one of the silent killer infections spreading undetected in Pakistan because there are often no clinical symptoms and, when HCV is diagnosed, considerable damage has already been done to the patient. In Pakistan alone, the prevalence of HBsAg has been reported to be from 0.99% to 10% in different groups of individuals 43 - 52 and 2.2% to 14% for HCV antibodies 53 - 56. A recent study conducted in Pakistan showed that out of 5707 young men tested, 95 (1.70%) were positive for anti-HCV and 167 (2.93%) for HBsAg 57. Our previous study showed the prevalence of HBsAg among young otherwise healthy women to be 4.5% 41,42. Our present study shows that the prevalence of HBsAg in otherwise young healthy women to be 3.6%, with 0.98% testing positive for anti-HCV antibodies. On the basis of other studies conducted in different provinces of Pakistan, we can say that there is a variation in the prevalence of HBsAg and HCV antibodies in the Pakistani population as the population sample selected is limited to a particular area or segment of the provinces.
HBV and HCV genotyping is important to track the route and pathogenesis of the virus. In particular, the variants may differ in their patterns of serologic reactivity, pathogenecity, virulence, and response to therapy. Both HBV and HCV has genetic variations which correspond to the geographic distribution and has been classified into 8 genotypes (A to H) on the basis of whole genome sequence diversity of greater than 8% and 6 genotypes (1 to 6) using restriction fragment length polymorphism analysis of the 5’ non-coding region (NCR), respectively .
In this study genotyping was carried out for 6 HBV genotypes (A through F) and 6 HCV genotypes (1 through 6). This study suggests that the HBV D genotype is the most prevalent (114/144 = 79.2%) among otherwise healthy females alone or in co-infection with other HBV genotypes in Karachi, Sindh, Pakistan. In our previous study HBV D genotype was found to be ubiquitous (100%) among otherwise healthy females alone or in co-infection with other HBV genotypes in Karachi followed by genotype B 41,42. The earlier two studies conducted for prevalence of HBV genotypes in known hepatitis B positive patients in Pakistan report the prevalence of genotypes HBV A (68%) and HBV D (100%) in the province of Sindh 58,59. Interestingly, in this study we also found the HBV D genotype to be the prevalent genotype but it was followed by genotypes HBV A (5.5%) and HBV F (4.9%). The prevalence of genotype HBV B in this study was found to be 3.5% as our earlier study has shown the prevalence of genotype B in otherwise healthy females to be 16.1% 60. These findings respectively contradict and corroborate the previous studies for HBV genotype distributions reported here as the subjects in this study were also asymptomatic but comprised of second group of female volunteer students at the two universities. Out of 144 subjects positive for HBsAg, 10 reported a previous history of jaundice and the rest were not aware of their HBV status. In the nearby north Indian population, HBV D was reported as the predominant genotype (75%) in patients diagnosed with chronic liver disease (CLDB) 60. In this study we also found other HBV genotypes existed in the study population such as HBV genotype F (4.9%) followed by genotype E (2.1%), and genotype C (1.4%). We also saw mixed HBV infections of genotypes B and D, A and D, C and D as well as B and C (20.8%, 7.6%, 2.8% and 2.8%) among these otherwise healthy females.
Among the 28 diagnosed HBV patients from Anklesaria Hospital, 67.9% showed HBV genotype D infection followed by genotype A infection (10.7%). In this group of 28 HBV positive patients we also saw infections with genotypes B (3.6%), C (3.6%) and F (3.6%). This group exhibited 10.7% co-infection with genotypes B and A.
As far as the HCV status of these 144 otherwise healthy females who were HBV positive is concerned only 2 (1.4%) tested positive for HCV antibodies by rapid immunochromatography. But the PCR results showed 39 (27.15%) of these 144 otherwise healthy females that were HBV positive for different genotypes were also positive for HCV including the 2 otherwise healthy females that tested positive for HCV antibodies by rapid immunochromatography. Of the 39 HCV positive otherwise healthy females, we found the predominant HCV genotype to be 3a (66.6%) followed by genotypes 6a (12.8%), 3b (10.3%), and 5a (10.3%) infections. The earlier study conducted with samples from women at the two universities in Pakistan had shown that among the HCV positive apparently healthy females 51.44% were genotype 3a, 24.03% exhibited a mix of genotype 3a and 3b, 15.86% were genotype 3b, and 4.80% were genotype 1b 42. Interestingly, among the group of 28 diagnosed HBV patients, the prevalence of HCV 3a genotype infection was dominant but was 7.1% much lower than that found in the otherwise healthy females, followed by infections with genotypes 2a (3.6%) and 5a (3.6%). Hence we see there is 25% co-infection of both these viruses i.e., HBV and HCV among the HBsAg positive individuals. The sample of 28 HBV positive patients was from a hospital located in the center of the metropolis that represents an area of Karachi where sanitation, malnourishment, illiteracy, and lack of awareness is very common. Prostitution can also be considered as one factor in some of the localities of Karachi in the spread of both HBV and HCV.
Conclusion:
In conclusion, genotype D appears to be the dominant HBV genotype and genotype 3a for HCV appears to be prevalent in Sindh, Pakistan’s otherwise healthy young female population as well as in HBV diagnosed individuals. Co-infection of both the viruses i.e., HBV and HCV exists among HBsAg positive individuals. The young female participants were advised to seek appropriate medical care for both their own benefit and public health benefit.
In 1940, Reid and Brace 1 first described the haemodynamic response to laryngoscopy and intubation due to noxious stimuli of the upper airway. Evidence from laboratory data demonstrates that epipharyngeal and laryngopharyngeal stimulation augments cervical sympathetic activity in the efferent fibres to the heart. This explains the increase in plasma levels of norepinephrine and, to a lesser extent, epinephrine, which occur during airway instrumentation 2. The rise in the pulse rate and blood pressure is usually transient occurring 30 seconds after intubation and lasting for less than 10 minutes 3. Usually these changes are well tolerated by healthy individuals. However, these changes may be fatal in patients with hypertension, coronary artery disease or intracranial hypertension 3. Numerous agents have therefore been utilised to blunt these stimulatory effects on the cardiovascular system induced by laryngoscopy and endotracheal intubation such as deepening of anaesthesia 3, pretreatment with vasodilators such as nitroglycerin 4, beta-blockers 5, and opioids 6 etc.
Lornoxicam is a nonsteroidal anti-inflammatory drug (NSAID) that belongs chemically to the oxicams and has been successfully used as a perioperative analgesic agent with a better safety profile regarding renal and hepatic function tests, in addition to better gastrointestinal tract tolerability compared to selective COX 2inhibitors 7. Riad and Moussa 8 reported that lornoxicam added to fentanyl attenuates the haemodynamic response to laryngoscopy and tracheal intubation in the elderly. Other than this, few data are available regarding the efficacy of lornoxicam in controlling the haemodynamic variations during the peri-intubation period. Therefore the present study was designed as a double-blind randomised placebo-controlled trial to investigate the effect of lornoxicam individually on the haemodynamic response and serum catecholamine levels following laryngoscopy and tracheal intubation.
Methods:
After obtaining the approval of the Hospital Research & Ethical Committee and patients' informed consent, fifty ASA I patients, aged 18-40 years, scheduled for elective surgical procedures under general anaesthesia requiring endotracheal intubation, were enrolled in this randomised, double-blinded placebo-controlled study. Those who had taken drugs that could influence haemodynamic and autonomic function, were excluded from the study. Further exclusion criteria consisted of patients with risk of pulmonary aspiration, predictably difficult airways or obesity (body mass index (BMI) > 30%) and patients with a known allergy to NSAIDs.
In a double-blind fashion and using a sealed envelope technique, patients were randomly allocated to one of two groups to receive intravenous injection (i.v.) of either Lornoxicam 16 mg diluted in 4 ml (Group L, n = 25) or placebo received saline 4 ml (Group S, n = 25) half an hour before induction of anaesthesia as the time taken by lornoxicam to reach peak plasma concentration (Tmax) was determined to be 0.5 h 9. Since lornoxicam is yellow while placebo is a clear fluid, syringes containing both solutions were prepared covered in a double blind fashion, by a collaborator not involved in data recording. The same collaborator administered drugs while a blind observer collected data.
Patients were not premedicated. In the holding area, an i.v. cannula was inserted and an i.v. infusion of Lactated Ringer’s 10 ml Kg-1 was started half an hour before induction of anaesthesia. Additionally, a 16-gauge i.v. catheter, attached to a stopcock and flushing device, was inserted into an antecubital vein of the contralateral arm to collect blood samples. Heart rate (HR), systolic blood pressure (SBP), diastolic blood pressure (DBP), mean arterial pressure (MAP) and arterial oxygen saturation (SpO2) were recorded before induction (baseline value).
After 3 min of pre-oxygenation, anaesthesia was induced with propofol 2.5mg kg-1 and cisatracurium 0.15 mg kg-1 to facilitate tracheal intubation which was performed using direct laryngoscopy when neuromuscular block was achieved by train of four-Guard monitor. SBP, DBP, MAP and HR were recorded before and after administration of the i.v. anaesthetic, immediately after intubation and cuff inflation, and every minute (min) for 10 mins. after intubation. All intubations were performed by a single anaesthetist, the duration of laryngoscopy and intubation were limited to the minimum possible time and were recorded. Data from patients in whom intubationrequired longer than 20 seconds (sec) were excluded.
Blood samples were drawn before (baseline) and 1 min. after intubation and cuff inflation for measurement of serum catecholamine concentrations. The samples were collected into pre-chilled tubes containing EDTA/Na and immediately centrifuged. Plasma concentrations of epinephrine and norepinephrine were measured in duplicate by using high-pressure liquid chromatography 10.
After tracheal intubation, patients were ventilated to normocapnia with sevoflurane (2-3% end tidal) in 50% oxygen in air. Two mins. after intubation (after collecting the blood sample), all patients received fentanyl i.v. 1.5 µg kg-1 and were monitored with ECG, SBP, DBP, MAP, SpO2 and end tidal carbon dioxide (EtCO2). All measurements were completed before skin incision. At the end of surgery, muscle relaxation was reversed and patients were extubated.
Statistical analysis was performed using SPSS version 17. Numerical data are presented as mean ± SD. Statistical comparisons among the groups were performed using unpaired t-test. Haemodynamic responses to induction and intubation in a given group were analysed using a paired t-test. The number of subjects enrolled was based on a power calculation of finding a 20% difference between the two groups in MAP and HR from the baseline values at alpha error of 0.05 and beta of 0.2. Categorical data were expressed as numbers and wereanalysed by using the 2 test where appropriate. A P value <0.05was considered statistically significant.
Results:
The two groups were comparable in demographic profile, duration of laryngoscopy and intubation as well as baseline haemodynamic parameters (table 1).
Table 1: Demographic, baseline haemodynamic characteristics and duration of laryngoscopy
Group S (Saline)
Group L (Lornoxicam)
No. of patients
25
25
Sex (female/male)
10/15
12/13
Age (yrs)
31.5 ± 5.6
33.1 ± 4.4
ASA (I/II)
19/6
20/5
Weight (Kg)
69.7 ± 4.2
66.9 ± 6.7
Height (cm)
167.9 ± 8.6
170.2 ± 4.5
Duration of laryngoscopy and intubation (sec)
14.9 (1.7)
16.2 (1.2)
HR/ minute
80.13±8.69
81.87±11.62
MAP mmHg
89.97±10.1
85.83±9.23
Systolic BP mmHg
120.2±11.2
117.44±17.1
Diastolic BP mmHg
78.7±9.91
73.13±12.42
(mean ± SD or number). No significant difference among groups
Table 2: Changes in Heart rate/minute
Group S
(Saline)
Group L
(Lornoxicam)
P
After induction
85.15±10.76
83.32±8.44
.062
0 minute after intubation
106±14.3
88.17±8.89
.000*
1 minute
101.71±11.15
86.92±9.11
.000*
2 minute
97.39±12.07
84.88±10.36
.019*
3 minute
95.48±12.95
81±9.91
.036*
Table 3: Changes in mean arterial pressure mmHg
Group S
(Saline)
Group L
(Lornoxicam)
P
After induction
84.65±8.3
79.77±9.92
.055
0 minute after intubation
129±16.54
91.73±10.7
.000*
1 minute
119.95±18.2
86.01±8.99
.000*
2 minute
105.33±13.15
83.62±10.63
.008*
3 minute
96.1±10.11
83.47±8.8
.024*
(mean ± SD). *P ≤ 0.05 is statistically significant change.
All tracheal intubations were performed successfully by the same anaesthetist at the first attempt. Following the induction of anaesthesia; SBP, DBP and MAP decreased in both groups (fig. 1 and 2).
After intubation the attenuation of the increase in SAP, DBP, MAP and HR in group L was statistically significant compared to group S, and then remained significant until 3 mins. after intubation. Haemodynamic variables are summarised in tables 2,3,4,5. The maximum rise in MAP and HR in group S at intubation was 30.5% and 42% respectively. While in group L the maximum rise in MAP and HR was 7.1% and 6.2% respectively over the entire observation period. After that, SBP, DBP, MAP and HR decreased gradually in both groups to values similar to those noted before induction. Furthermore, blood samples collected one minute following intubation showed a significant increase in serum epinephrine and norepinephrine concentrations in group S compared to group L in the same observation period (fig. 3) (table 6).
Table 4: Changes in systolic blood pressure mmHg
Group S
(Saline)
Group L
(Lornoxicam)
P
After induction
107.38±11.71
102.25±12.89
.069
0 minute after intubation
169.27±18.29
117.35±13.5
.0001*
1 minute
141.53±15.51
113.68±12.91
.005*
2 minute
128 ±11.2
115.39±14.17
.014*
3 minute
122.99±12.56
111.67±14.8
.037*
(mean ± SD). *P ≤ 0.05 is statistically significant change
Table 5: Changes in diastolic blood pressure mmHg
Group S
(Saline)
Group L
(Lornoxicam)
P
After induction
72.49±8.79
68.99±8.1
.085
0 minute after intubation
109.53±14.22
78.48±8.51
.000*
1 minute
92.18±10.63
74 ±7.75
.007*
2 minute
89.77 ±11.34
78.12±7.98
.02*
3 minute
81.45±8.8
73.6±8.21
.043*
(mean ± SD). *P ≤ 0.05 is statistically significant change
Table 6: Changes in serum catecholamine level nmol/L
Group S
(Saline)
Group L
(Lornoxicam)
P
Epinephrine
Pre intubation
.195±.119
.179±.104
.085
1 min postintubation
.206±.112
.181±.087
.038*
Norepinephrine
Pre intubation
1.11±.633
1.098±.51
.059
1 min postintubation
1.499±.903
1.107±.524
.000*
(mean ± SD). *P ≤ 0.05 is statistically significant change
Discussion:
Lornoxicam has been successfully used in prevention and treatment of postoperative pain 11. It was reported that i.v. 8 mg of lornoxicam was equianalgesic with 20 mg of morphine 12, 50 mg of pethidine 13, while 16 mg of lornoxicam had a superior analgesic effect compared with 100 mg of tramadol 14 and was comparable to 100 µg of fentanyl as intraoperative analgesia in mild to moderate day case ENT surgical procedures 15.
Our results showed a significant fall in SBP, DBP and MAP in both groups after induction. This might be due to the vasodilatation associated with the administration of propofol. Patients in both groups exhibited an increase in heart rate since no medicine other than Lornoxicam was added to propofol to decrease pain on injection. Propofol can cause significant tachycardia from pain in addition to reflex tachycardia due to a decrease in SVR. As the SBP, DBP and MAP rose significantly for the first 3 minutes after intubation in the control group, a further reduction in SVR due to the vasodilator effect of sevoflurane is the probable reason for the return of the MAP to nearly baseline values over the entire observation period. The fall in HR over the same period might be partly due to the bradycardia associated with fentanyl administered 2 minutes after intubation in both groups.
In our study, lornoxicam attenuated the pressor response to laryngoscopy and tracheal intubation; SBP, DBP, MAP and HR were significantly lower in L group compared to S group in the first 3 min after intubation. This may be attributable to the analgesic action of lornoxicam mediated through the antiprostaglandin effect of COX inhibition, the release of endogenous dynorphin and β-endorphin 14, a decrease in peripheral and central prostaglandin production, 16 as well as it exerting some of its analgesic activity via the central nervous system 17.
In agreement with our results, Bruder and colleagues 18 reported that laryngoscopy and intubation violate the patient's protective airway reflexes with marked reflex changes in the cardiovascular system and lead to an average increase in blood pressure by 40-50% and a 20% increase in heart rate. Kihara and colleagues 19, when comparing the haemodynamic response to direct laryngoscopy with the intubating laryngeal mask and the Trachlight device, reported that the HR increased compared with preoperative baseline values in all groups. Moreover, both systolic and diastolic pressure increased after tracheal intubation for 2 mins. with the highest values in the hypertensive group receiving direct laryngoscopy.
In a previous study done by Riad and Moussa 7, i.v. administration of 8 mg lornoxicam half an hour before surgery added to fentanyl 1 µg Kg-1 during induction of anaesthesia was found to attenuate the haemodynamic response to laryngoscopy and tracheal intubation in the elderly. However, it was unclear whether this was attributed to the drug's narcotic effect. Therefore, our study was designed to evaluate the use of lornoxicam individually, in a single i.v. administration of 16 mg lornoxicam half an hour before surgery. Lornoxicam 8 mg was not used as it was proven to have an inadequate analgesic effect 15.
There have been a few studies which have measured catecholamine levels after intubation. Our results are consistent with those of Russell et al 2 and Shribman et al 20 who reported significant elevations in serum levels of norepinephrine and epinephrine following laryngoscopy and tracheal intubation. Hassan and colleagues 21 concluded that during laryngoscopy and endotracheal intubation, placing the tube through the cords and inflating the cuff in the infraglottic region contributes significantly to sympathoadrenal response caused by supraglottic stimulation.
When assessing techniques to ameliorate the cardiovascular responses to intubation; the drugs used to induce anaesthesia may influence the results. We induced anaesthesia with propofol which produces hypotension. This may compensate in part for the cardiovascular changes attributable to laryngoscopy and tracheal intubation. This could be considered a limitation of the present study. The omission of opioids during the induction of anaesthesia in healthy young patients should not be a concern.
In conclusion, pretreatment with lornoxicam in the doses given in this study, attenuates the pressor response to laryngoscopy and the intubation of the trachea.
As highlighted in the World Health Report 2002, just a few Non Communicable Disease (NCD) risk factors, account for the majority of non communicable disease burden. These risk factors; tobacco use, alcohol consumption, raised blood pressure, raised lipid levels, increased BMI, low fruit/vegetable intake, physical inactivity, and diabetes, are the focus of the STEPs approach to NCD risk factor surveillance. 3
A tool for surveillance of risk factors, WHO STEPS, has been developed to help low and middle income countries get started. It is based on collection ofstandardised data from representative populations of specified sample size to ensure comparability over time and across locations. Step one gathers information on risk factors that can be obtained from the general population by questionnaire. This includes information on socio-demographic features, tobacco use, alcohol consumption, physical inactivity, and fruit/vegetable intake. Step two includes objective data by simple physical measurements needed to examine risk factors that are physiologic attributes of the human body. These are height, weight, and waist circumference (for obesity) and blood pressure. Step three carries the objective measurements of physiologic attributes one step further with the inclusion of blood samples for measuring lipid and glucose levels.4 The risk factors studied by MONICA project of the World Health Organization (WHO), included cigarette smoking, blood pressure, blood cholesterol and body weight.5In many resource-poor settings, laboratory access can be difficultand expensive. A screening algorithm that includesgender, age, cardiovascular disease history, blood pressure,weight and height, and a urine dipstick test for glucose andprotein is likely to be more practical and may well providemuch of the predictive value of more complex blood-based assessments.6In addition, such algorithms should, wherever possible, useregional data on morbidity and mortality, because backgroundrates vary considerably between regions.7 WHO/ISH (World Health Organization/International Society of hypertension) risk prediction charts provide approximate estimates of cardiovascular disease (CVD) risk in people who do not have established coronary heart disease, stroke or other atherosclerotic disease. They are useful as tools to help identify those at high cardio vascular risk, and to motivate patients, particularly to change behavior and, when appropriate, to take antihypertensive, lipid-lowering drugs and aspirin.8 After reviewing the above information about standardised methods available for identifying the risk factors for CAD, the present study was undertaken to assess the prevalence of risk factors in the community in Tripoli, the capital of Libya. The aim of this paper also includes suggesting priorities and strategy to deal with the risk factors that were found most important. Appropriate statistical tests were applied using the software SPSS 17 for determining the relative importance of different risk factors. The specific statistical tests have been stated below. Material and Methods 528 individuals were selected from general community for the study by random sampling from different geographical areas of Tripoli. They were interviewed about risk factors for CAD and where possible, facts stated by them were validated from medical records available with them. Their body weight, height and blood pressure were also recorded. The intern doctors posted with community medicine department were briefed and trained by faculty members for the above observations and recording the body measurement and blood pressure using the uniform technique. The WHO/ISH risk prediction colourcharts for Eastern Mediterranean Region B (which includes Libya) were used as questionnaire for the study. The option of charts available for settings where blood cholesterol can’t be measured was selected as it was found difficult to convince the individuals not suffering from disease to provide blood samples. The following criteria were used for defining Blood Pressure, BMI, Diabetes & MI : According to the WHO definition, individuals with systolic blood pressure ≥ 140 mmHg or those with diastolic blood pressure ≥ 90 mmHg were considered hypertensive. 21. Known cases of diabetes were termed as individuals for whom the diagnosis of diabetes had been established by a physician in the past, or those who were under treatment with anti diabetic drugs. 22 Body mass index (BMI) is calculated as weight divided by height squared (kg/m2). Overweight is defined as BMI 25–29.9 kg/m2, and obesity as BMI ≥ 30 kg/m2 for all subjects.19 Known cases of Myocardial Infarction (MI) were termed as individuals for whom the diagnosis of MI had been established by a physician in the past. ObservationsThe comparison of population characteristics of people with and without having a MI stated in the table below reveals that: distribution of males and females was similar in both the groups. 88% of individuals with a MI were from age group 35 and above. Whereas 11.43% of people with MI were from age group 15 to 34 years which shows the need of starting screening as well as control of risk factors from teenage. Using SPSS software, independent sample t test was applied on age distribution of individuals with and without history of MI. The result revealed that the mean age of individuals with a positive history of MI was 54. It was 43.74 for subjects with negative history of MI. The difference of age between the above 2 groups was found highly significant (P>0.001). In the same manner using SPSS software, Chi square test was applied on sex distribution of individuals with and without history of MI. The result revealed that the difference in sex distribution in the two groups was not significant (P = 0.522) Table 1 : Age & Sex wise distribution of persons with and without MI:
Characteristics
Individuals with MI in percentage, (N= 70)
Individuals without MI in percentage, (N = 458)
Sex; Male
68.57 (48)
68.78 (315)
Female
31.43 (22)
31.22 (143)
Age 15-34 years
11.43(8)
34.93 (160)
35-54 years
30.00 (21)
37.55 (172)
55 & above
58.57 (41)
27.51 (126)
Independent risk factorsAs presented in Fig.1, in males with MI in terms of percentage the most prevalent risk factor was found to be hypertension (11.05% higher than non MI group), followed by diabetes (higher by 10.78%), smoking (higher by 8.12%) and BMI 25 & above (higher by 5.13%). As presented in Fig.2, in females with MI in terms of percentage the most prevalent risk factor was found to be hypertension (20.55% higher than non MI group), followed by BMI 25 & above (higher by 8.77%) and diabetes (higher by 6.85%). There were no smokers in the female group with MI and only one smoker was found in the females without MI. Using SPSS software, under general linear model, multivariate analysis was performed after splitting the cases under male and female. History of MI was kept as fixed factor and age, history of hypertension, diabetes and stroke, smoking, systolic blood pressure and BMI were kept as dependent variables. The results reveal that in the males with positive history of MI, value of P was less than 0.001(highly significant) for age, History of hypertension & diabetes and systolic BP of140 and greater, followed by history of stroke (P>0.002) suggesting that prevalence of these variables were significantly higher in males with history of MI. The prevalence of BMI 25 & above (P>0.616) and smoking (P>0.882) in males with history of MI was found insignificant. In case of females with positive history of MI, the only variable having significant prevalence was f history of hypertension (P>0.008). An important reason for inability to assess significance for other variables in females may be the smaller number of females of only 22 with history of MI. Among the community members with MI, 94.38% males and 78.57% females had one or the other risk factor which have been stated above. Hence with focused attention to health education and screening for risk factors, identifying most of the individuals at risk of MI, should be possible. (Fig.1) Distribution of Risk Factors in Males with and without MI (The total number of responses are more than number of respondents because of more than one risk factor being present in many respondents) (Fig.2) Distribution of Risk Factors in Females with and without MI (The total number of responses are more than number of respondents because of more than one risk factor being present in many respondents) Combination of risk factorsOut of 48 males with MI, 22 (45.83%) had both diabetes and hypertension and half of them (22.92%) were also smokers. The next group among males having multiple risk factors were that of smokers 14 (29.17%), out of which half (14.58%) also had hypertension. Out of 22 females with MI, 13 (59.09%) had hypertension and 27.27 % out of them were also diabetic. The next group was that of diabetics 3 (13.64%). Hence looking at the combination of risk factors in both males and females with MI the most common risk factor in terms of prevalence was found to be hypertension followed by smoking in men and diabetes in women. As Hypertension and BMI in age group of 35 to 54 years were found to be significant and commonly present risk factors, the data was further explored. Systolic BP 140 and above: The percentage of persons with MI having a systolic BP of 140 and above in the age group 35 to 54 years was more than double in comparison to the percentage expected by number of persons present in this age group that is 66.67% as stated in Fig.3, against 30% as stated above in Table1. Hence in this age group there appears to be considerable opportunity of detecting and treating cases of hypertension in the general community before they reach to the advanced stage of coronary artery disease and MI. (Fig.3) Age wise distribution of blood pressure (both sexes)Body Mass Index: As presented below in Fig.4, the percentage of overweight and obese individuals were found to be 5 to 9 percent higher in those with MI than those without MI. The percentage of obese people increased by 2 times in both the groups that is with and without MI as age advanced to 35-54 years from 15-34 years. The percentage of overweight individuals was 1.48 times in those without MI and 1.77 times in those with MI in age group 35-54 years in comparison to the age group of 15-34 years. (Fig. 4) Age wise distribution of weight (both sexes) Discussion: Comparison with other relevant studies: In our study the most common risk factors observed in community members without MI were hypertension (total 24.35%, males 23.78 & females 25.88), followed by diabetes (total 21.13%, males 19.56 & females 25.29) and smoking (Total 27.26%, males 37.33 & females 0.59) as stated above in Fig.1 & 2. In similar studies performed in countries of Mediterranean region14-18 26% of study population were found to be suffering from hypertension, 40% males and 13% females were smokers and 14.5% were suffering from diabetes. 13 The percentage of diabetics was 10.6 in study population aged 30 years and above in Iran11. The percentage of diabetics were 11% in males and 7% in females in United Arab Emirates (UAE)10 and the figures were the similar in Saudi Arabia in subjects aged 30 years and above were 17.3% and 12.18% respectively.9. All the above studies were performed in the period from year 2000 to 2004 except the study in UAE which was performed in 1995. It can be seen from our study in Libya that in comparison to mean percentage for the same risk factors in other countries of Mediterranean Region, the percentage of hypertension was lower by about 2%. In Libya the percentage of total diabetics in the general community was greater by 6.6%, while the percentage of smokers were less by about 13% in males and 12.5% in females. The percentage of total overweight and obese individuals in all age groups and both sexes were 66.6 % in the general community without MI in our present study (Fig,4). The percentage for those overweight and obese in individuals above 19 years of age was 26.2% in study from Iran12 and 27 % in UAE10 in the age group of 30 to 64 years. The study of 12 countries of the Eastern Mediterranean Region(EMR) by the WHO conducted in 2004, reveals that regional adjusted mean for these countries was 43 % for overweight and obese individuals in all age groups and both sexes20. Hence in comparison to developing countries of the region having similar religious, social and dietary situation among the risk factors for CAD, diabetes and obesity can be seen as emerging major risk factors in Libya followed by hypertension and smoking. Smokers among females were found to be uncommon in Libya.Conclusion The findings of this study reveal that in comparison to those without MI the prevalence of following risk factors was higher in individuals with MI. In males aged 35 to 54, the percentage of those with a systolic BP of 140 and greater was more than double and in females 1.6 times greater. Those with diabetes were greater by 10.78% in males and 6.85% in females, while smokers were higher by 8.12% in males. The percentage of diabetes in individuals without MI was 21.13%. The prevalence of smokers was found to be 37.33% in males without MI which suggests urgent need for prevention and control measures. Considering multiple risk factors out of 48 males with MI, 22 (45.83%) had both diabetes and hypertension and half of them (22.92%) were also smokers. Out of 22 females with MI, 13 (59.09%) had hypertension and 27.27 % out of them were also diabetic. In view of large number of individuals having risk factors of CAD in Tripoli, we would like to recommend that health education for preventing overweight and obesity, hypertension, smoking and diabetes may be started with school children and their parents as early as primary school. The screening for above risk factors needs to be implemented in the age group of 34 years and above for detecting individuals at risk as close to 34 years as possible. This step needs to be followed by relevant health education and treatment as soon as possible. More studies on a larger population sample are required from different geographical areas of Libya to refine our focus on the target population identified. At the same time waiting for action, till these additional studies are completed, is not recommended. To make the comparison of risk factors more fruitful among different countries and in the same country over time, we need to agree on uniform criteria such as using WHO/ISH risk prediction charts. Limitations of present studyIt is a cross sectional study based on the questions stated in WHO/ISH prediction charts for situations where collecting blood samples is not feasible. Due to the small sample size we can only say that the prevalence of MI is indicative of the pattern observed. These figures may get refined as we cover a larger number of the population over time. Due care has been taken in selecting sample size to represent different geographical divisions of Tripoli and to ensure that this is a random sample, but it is a systematic random sample and not the stratified random sample. Hence within each geographical division all the socio economic strata of community may not have been proportionately represented. AppendixThe questionnaire used for the study is stated below. It is based on the questionnaire recommended on page 21 of WHO/ ISH risk prediction charts for Eastern Mediterranean Region B of W.H.O. in which Libya is included.QuestionnairePrecautions: Do not interview persons below the age of 14 years. You should take height, weight and Blood Pressure of the person yourself, before recording it in the form below
S.N.
Question
Subject
1
2
3
4
5
1
Name of Person:
2
Address in Libya
4
Age
5
Sex: M / F
6
Do you smoke: Yes / No
8
Do you have History of suffering from Diabetes: Yes / No
9
Hist. of suffering from: Mayo cardial Infarction: Yes/ No
Antibiotics serve a very useful therapeutic purpose in eradicating pathogens1,2. Unfortunately excessive and inappropriate use of antibiotics results in antibiotic resistance which is a rapidly increasing global problem with a strong impact on morbidity and mortality 3-5. It is now evident that self-medication is widely practiced in both developing 6-11, as well as developed countries 12-18. India is also experiencing this problem of inappropriate use of self-medications in significant numbers 19,20.
Unlike the rest of the population, when physicians become ill,they can prescribe medicines for themselves very easily. Medical knowledgeand access to prescription of medications increase the potentialfor self-treatment. Although many warn of the loss of objectivitythat can accompany self-prescription, previous studies suggest that self-prescription is common among practicing physicians 21-24. The purpose of the present studyis to evaluate self-prescription and self-care practices amonggovernment doctors in the Hassan District of Karnataka. Materials and methods
A cross section of doctors attending the CME programme at Hassan Institute of Medical Sciences, Hassan, was selected for the project during August 2009. A self –assessment questionnaire was distributed amongst the participants after explaining the purpose of the study and after taking informed oral consent. The study was given prior approval from the institutional ethics committee. A total of 160 doctors (all participants were male) were chosen randomly for participation in the study.
The questionnaire consisted of both closed and open-ended questions. A total of 21 questions were stated concerning the following: Socio-demographic characteristics (like age, sex and personal habits), patterns of self – medication with antibiotics (e.g. type of antibiotics used, frequency, whether the course of antibiotic was completed, and the health condition that lead to self-medication).
After completion of data collection, it was reviewed, organized and evaluated using the Chi-square test and analysis of variance (One-way ANOVA) using the Statistical Package of Social Science (SPSS Inc., Chicago, IL) for windows version 14 and p-value of <0.05 was considered statistically significant. Results
A total of 160 male doctors agreed to participate in the study. Twenty eight percent of them were postgraduate qualified (e.g. MD, MS in different specialities) and 72% were only MBBS qualified. Eighty six percent of them were aged between 36-45 years.
Fifty three percent of doctors had used self-prescribed antibiotics with self-diagnosis within the last 6 months before the study.
Table – 1
Characteristics of the Respondents
Variables
Doctors %
Used self-medication with antibiotics
53.0
How many times
Once / day
55.8
Twice / day
10.4
> 3 times
16.1
Completed the course
26.8
Table – 2
Factors that lead to Self-medication
Conditions
Doctors %
Respiratory Infections
66.7
GI problems
23.4
Systemic Problems
7.7
Skin Problems
2.6
Urinary tract conditions
0
Table – 3
Antibiotics used for self-medication
Name of the antibiotic
Doctors %
Penicillines
68.0
Amoxicillin
40.0
Flouroquinolones
13.3
Co-amoxiclav
6.8
Macrolides
8.0
Tetracyclines
2.7
Cephalosporins
4.0
Sulphonamides
2.2
Metronidazole
1.2
Tinidazole
2.0
The frequency of antibiotic use was once in 55.8%, twice in 10.4% and thrice or more in 16.1% in the study period (p < 0.05). Only 26.8% of all doctors attended in this study completed the course of antibiotic therapy (p < 0.05) (Table 1).
The factors that lead to self-medication among respondents were perceived respiratory infections in 66.7%, gastrointestinal diseases in 23.4%, systemic diseases in 7.7% and skin diseases in 2.6% (Table 2).
Table 3 shows the antibiotics that were most frequently used for self-medication. Penicillins were ranked highest (68%) and in this group Amoxicillin was most frequently used (40%). Next were the flouroquinolones with 13.3% followed by Macrolides 8%. Other relatively lesser used drugs were co-amoxiclav, cephalosporins, tetracyclines, sulphonamides, Tinidazole and Metronidazole. Discussion
The current study examined antibiotic self-medication among government medical doctors in Hassan district. They were attending a CME programme at HIMS, Hassan. Studies on factors associated with antibiotic use are important to prevent the occurrence of antibiotic resistance 9, which is a well known problem in many countries 7-18. Antibiotic use in different diseases was always empirical without proper opinion and laboratory investigation in self- medication.
The source of the antibiotics was from medical representatives (47.8%), from drug stores (44.8%) without prescription, even though antibiotics are prescription only medicines. The fact that the violation of this law is subject to financial penalty and is not strictly implemented in case of doctors, has resulted in the continuation of this practice. Self-medication with antibiotics may increase the risk of inappropriate use and the selection of resistant bacterial strains 25,26. There have been several reports addressing the extent of self-medication practices with antibiotics among university students in other countries 27,28, but few about doctors. This should be further analyzed.
In this study, more than 53% of the respondents practiced self-medication with antibiotics within the last 6 months before the study. This rate is similar to the findings of a study in Turkey with 45.8% of self-medication with antibiotics 29 and also a recent study in Jordan (40.7%) 9 and other studies in Sudan (48%) 7, Lithuania (39.9% ) 30 and also in USA ( 43% ) 17.
Higher rates of self-medication are reported from China(59.4%) and Greece (74.6%) 14. Lower rates are reported from Palestinian students (19.9) 27, Mexico (5%) 31, Malta (19.2%) 18 and Finland (28%) 12. It seems that the lower rates of self-medication in these cases were due to respiratory diseases being treated symptomatically rather that with antibiotics.
Only 26.8% of respondents completed the course of antibiotic therapy. This is similar to the result of study in Jordan (37.6%) 9.
The most common disease treated by antibiotics was respiratory tract infections (common cold, sore throat, and sinusitis). Such diseases were also reported to be the common cause for self-medicated in Jordan 9, Palestine 27, Turkey 28 and European countries 16. The above conditions are known to be of viral origin 32, requiring no antibiotic treatment.
The main antibiotics used in self-medication were penicillins in general, and particularly Amoxicillin. Similar results are reported by other studies from different parts of the world 8,33. This may be due to the low cost of broad spectrum penicillin throughout the world 8.
It is agreed by some researchers that adverse effects due to inadequate and inappropriate use of antibiotics without prescription can be minimized by proper education 34. This can be effectively done through national awareness programmes, educational programmes (Rational Drug Use, Intensive Medical Monitoring of Prescription, evidence based practice, and essential drug use) and CME programmes.
We also suggest specific education about antibiotics in all educational and research institutions.
There are a few limitations in this study for all doctors irrespective of gender. First, is its reliance on self-reported dataabout self-medication with antibiotics. Secondly, it refers to any previous use of self-medication with antibiotics (retrospective study). Another limitation is that our population samplemay not be representative of the doctors’ population in the entire district. National education programmes about the dangers of irrational antibiotic use and restriction of antibiotics without prescriptions should be the priority. This study indicated that with reference to doctors, knowledge regarding antibiotics cannot be evaluated alone since it did not always correlate with behaviour. Conclusion
Almost all medical doctors practice self-treatment when they are ill. Although they prefer to be treated by a physician, due to complex reasons including ego and a busy professional work pattern, there is a certain amount of hesitation in consulting professional colleagues when they need medical help.
The prevalence of self medication practices is alarmingly high in the medical profession, despite the majority knowing that it is incorrect. We recommend that a holistic approach must be taken to prevent this problem from escalating, which would involve: (i) awareness and education regarding the implications of self medication (ii) strategies to prevent the supply of medicines without prescription by pharmacies (iii) strict rules regarding pharmaceutical advertising; and (iv) strategies to make receiving health care much less difficult.
Our study has also opened gateways for further research on this issue, besides showing that it is a real problem and should not be ignored in and around Karnataka, India and all over the world.
Humans have always been interested in altering their body. Whether through piercings or tattoos, for aesthetics, religious reasons, or self-expression, the practice of body modification is a well known art.1 One not as familiar or easily observed body modification type is genital piercings. Genital piercings (GP) are defined as developing a tract under the skin with a large bore needle to create an opening into the anatomical region for decorative ornaments such as jewelry.2-3 Historically, GPs are not a new procedure.
Currently, this once taboo practice is on the rise and more men with GP are presenting with a variety of medical needs to clinics and hospitals.3 From the rare Pubic Piercing (a piercing through the dorsal base of the penis) to the Guiche (a piercing through the perineum), the male genitalia provides ample area to pierce. Men commonly choose from nine different types of GP and often use three major types of piercing jewellery (Figure 1).3-6
Figure 1 Common Types of Genital Piercings (GP) Worn by Men
Illustrations by Larry Starr, Senior Design Specialist Texas Tech University Health Sciences Center. Text modified with permission: Urologic Nursing 2006, 26(3), 175-176.
This rapid growth trend is creating its own set of complications and questions among clinicians. The medical literature suggests the most common risks are infection and bleeding, but there are other structural considerations as well.3-4, 6-8 An example of this is with the most widely known and commonly encountered male GP, the Prince Albert; the jewellery pierces the urethral meatus, exiting through the ventral surface of the penis. The piercing effectively creates a fistula for urine to drain, and many men report experiencing the need to sit down during urination due to the change in stream and difficulty in aiming.3,4 Other reported single case histories of more severe complications are Fournier’s gangrene, urethral tears, priapism, post-coital bleeding or lost jewellery in female partners, paraphimosis, and recurrent sexually transmitted diseases.8-20
Given the variety of negative issues that could arise from GP, any subject related to the health and well being of men having an intimate piercing should be directed to a well informed clinician. Currently, when questions or problems arise, men are more likely to seek assistance from the internet or a piercer rather than a health care provider.3,21-22 Considering the limited medical literature, as well as the minimal availability of clinicians knowledgeable about body piercings and modifications, men with GP are at high risk for delays in appropriate treatment of complications related to piercings as well as for overall preventive healthcare. Over concentration on the presence of GP by clinicians could delay important health care.23
Our purpose for this study was to elucidate information about men with GP in order to aid the clinician in providing relevant information for patients considering GP, as well as to provide further scientific evidence by examining their demographics, risk behaviours, procedural motives and post-piercing experiences. Additionally, several motives or characteristics of those with body art such as depression, abuse, self-esteem, and need for uniqueness were examined.24-29 Authors of this study have experience in urology, various aspects of piercing, and two decades of published body art research.
Problems in attempting any study about those with GP is reaching a sizeable sample for a study and an acceptable data collection methodology as those with GP have a hidden variable of study, making it difficult to make contact. Networking or “snowball” sampling for data collection, as well as anonymous questionnaires, becomes one approach,30 but this also makes it difficult to validate if respondents actually have GP. In an effort to address this issue, survey questions were specifically written for individuals with GP, making it extremely difficult and time-consuming to answer if the respondents did not have applicable experiences. Previous research experience also indicates that after about 10-15 questions, interest can wane and the questionnaire will not be completed.3,7,31
Only two published studies could be located to provide preliminary information about individuals with GP.21,22 In the first study21 data, collected in 2000 and actually published in 2005 had a national convenience sample of 63 women and 83 men with nipple and/or GP. Forty-eight men in the study had GP; the average man was 31 years of age, single, heterosexual, Caucasian, in good-excellent health, who sought out annual physicals, possessed some college education, and spoke of moderately strong religious faith. Almost all were employed, reporting an average annual salary of $36,000, or higher. Over half admitted and continued their belief they were risk takers; many of them also had 3 or more general body piercings. Most did not smoke or use drugs routinely and in this study, no questions about alcohol use were asked. Their average age at first sexual intercourse was 15.7 (the national male average is 16.9).32 Of those that participated (37%) in sport activities or exercise, they reported with no problems. They voiced minimal, if any, regrets to obtaining a genital piercing and would repeat the procedure. The Prince Albert was the most common male GP. Few (12%) voiced any problems with their GP, with urinary flow changes and site hypersensitivity being the most frequently mentioned. Six participants stated partners had refused sexual intercourse with them after their GP. One case of STD (Gonorrhoea) was reported post-procedurally.
As the internet survey demonstrated marked success in reaching those with GP, a similar study was undertaken to query a larger cohort of men with GP to increase clinician awareness in caring for men with GP. Thus, a cross-sectional descriptive study of men with GP was conducted so the collected information could be compared with the previously mentioned studies of those with GP.21,22 To ensure that the rights and dignity of all research participants were protected, exempt study status was obtained for this study from the university institutional review board. Notices of the study and a request for participation were posted on a number of popular body piercing sites with the assistance of an internationally-known Expert Piercer. The survey was available on the web for a total of 6 months during late 2008 and early 2009.
Questionnaire
Questionnaire items were based on a review of literature, the Armstrong Team Piercing Attitude Survey,31 previous work examining women with GP, 3,21-22, 33 and recent findings about those with body art. 24-29 The study purpose and benefits were presented on the front page of the survey. The subjects were informed that completion of the survey indicated their consent to participate in the study and that they could stop at any point during the survey if they were uncomfortable with a question (s). Ethnicity was included to note GP acquisition patterns; the ethnic categories were not defined and participants self-reported. Assurances were provided that the information would be analyzed as group data and no identifying information would be sought. Respondents were encouraged to answer questions honestly and not to be offended by any questions as some of them directly related to unsubstantiated assumptions written about GP in the medical literature. 21-22 There was no ability to tabulate how many individuals viewed the survey if they did not start the survey.
The survey had 4 sections: (a) Obtaining the GP (13 questions); (b) Personal experiences with the GP (32 questions); (c) General information including depression and abuse (26 questions), and (d) Sexual behaviour including forced sexual activity (12 questions). Four scales were also included: motives (14), outcomes (16), pre and post procedural self-esteem (16), and need for uniqueness (4). The previous reliabilities for the motive scale was 0.75,22 outcome scale 0.88,22 and need for uniqueness scale was 0.80;25 data was not available for the self-esteem scale.34 Various response formats were used throughout the survey such as a 5 point Likert scale (1 = strongly disagree or unlikely to 5 = strongly agree or likely), multiple choice, and short answers.
Data Analysis
The Statistical Package for the Social Sciences (16.0 Ed.) was used for data analysis to obtain frequencies, cross-tabulation, and chi-square analysis.30 Additionally, T-tests were used to compare means of similar questions from both the 2005 and 2008 studies with data from the current study. Significant differences were found in both study samples so they were judged as different groups from this current study.
RESULTS
Study Population
While 545 respondents started the survey, responses were analyzed from 445 men with GP (82%) residing in 42 states and 26 international countries; they declared a total of 656 piercings. Clusters of participants were evident from CA (22), NY (17), TX (16), FL (11), Europe (43), Canada (21), and Australia (20). Ages of the men with GP at survey time ranged from 15 to 72 (Table 1). The average participant in this study was 36 years of age, Caucasian, some college education, married, in excellent health, who sought out annual physicals, reported no/few friends with GPs, and declared a salary of $45,000 or higher. Religious beliefs were grouped into either non-existent or moderately to very strong faith. There was almost equal numbers of blue collar and white collar workers: others were from health care, arts, academia or military, while some were self-employed; very few mentioned unemployment, or retirement.
Table 1 Self-Reported Characteristics Of Men with Genital Piercings (GPs) continued
Demographics
Current Study* N = 445
Age at time of survey 20 or < 21-35 36-50 51+
61/29% 77/36% 41/19% 33/16%
Ethnicity Caucasian
319/89%
Martial Status Single Living/significant other Married with/out children
96/27% 69/20 143/41%
Education High school Diploma Some college Bachelor’s degree Graduate/Doctoral degree
34/10% 113/32% 77/22% 88/20%
Occupations Technical/vocational Professional Students Artists
90/28%
92/29%
44/14% 23/07%
Salary <45,000 $45,000+
135/44% 169/56%
Strength/Religious Faith Non-existent Mod Strong-Strong
135/39% 99/28%
State of Health Excellent
310/88%
Health care visits Annual physicals Only when problems
150/43% 142/40%
Close friends w/GPs None 1-3 4+
239/68% 100/28% 14/ 4%
Feel sad/depressed
Little/Some Pre-piercing Post-piercing
248/57% 210/59%
*Numbers will not always add up to 100 because of missing data or multiple answers.
Risk Behaviours
Those who reported pre-procedural risk taking tendencies continued to have significant tendencies for them post-procedurally (χ2 = 2.13) = 16; p = 0.000) (Table 2). Some risky behavior was observed; over half had body art, with an average of 2 piercings or more, as well as tattoos. Alcohol use was infrequent, but when they did, they had 5+ drinks. Other answers did not bear out the risk taker image with their monogamous, heterosexual relationships, limited tobacco, and drugs. Their average age at first intercourse was 17.05 (national male average 16.9).32 Most (391/88%) did not report STDs before their piercings, but of those that did itemize their STDs, Chlamydia was the most frequently mentioned (n =18).
Table 2 Self-Reported Risk Behavior From Men with Genital Piercings (GPs)
Risk Behaviour
Current Study* N = 445
Age at first intercourse Never had intercourse 12 or less 13-15 16-18 19+
12/03% 14/04% 80/25% 160/48% 74 /23%
Sexual Orientation Women
286/82%
Risk Taker Before Piercing
222/52%
Remains Risk Taker
198/52%
Cigarettes Smoked None ½-1 pack daily
252/75% 75/22%
Monthly Alcohol Consumption 1-3 times 5+ drinks @ one setting, 1-3x
118/33% 191/55%
Drugs Used monthly None 1-15 times
294/87% 27/08%
Sexual Partners in 6 months One Two or more
211/62% 98/32%
General body piercings None 1-4 piercings 5+ piercings
119/27% 259/59% 108/33%
Tattoos None 1-4 5+
115/35% 134/38% 76/21%
STDs before piercing
54/12%
*Numbers will not always add up to 100 because of missing data or multiple answers.
Genital Piercing Procedure
A deliberate time delay between their consideration to making the decision to have a GP was present as many had waited almost 5 years before procurement (Table 3). Over half reported the Prince Albert GP, with another third choosing a Frenum/Frenum Ladder (Figure 1). While a small-moderate amount of pain and bleeding was reported procedurally, virtually no drugs or alcohol were used before their GP.
Table 3 Self-Reported Procedural Information From Men with Genital Piercings (GPs)
Genital piercing procedure
Current Study* N = 445
Amt of decision time Waited long time, then a few minutes A long time (over a year)
49/24% 143/37%
Age of GP Decisions Consideration Procurement
29 years 34 years
Type of Genital Piercings Ampallang Apadavya Dydoe Foreskin Frenum/Frenum ladder Guiche Hafada Prince Albert Other
*Numbers will not always add up to 100 because of missing data or multiple answers.
Motives and Outcomes
Table 4 illustrates participant motives and outcomes for each group in the various GP studies.21,22 For the highest motive response of “just wanted one” there was consistency over the three studies; of the top five responses, they were similar but just ranked differently. Alpha measurements for the motive response scale ranged from 0.40 to 0. 75 except for our current study, where the covariance matrix was zero or approximately zero so the statistics based on its inverse matrix could not be computed. Motives centered around wanting a GP, trying something new, have more functional sexual control, and seeking uniqueness. Measureable outcomes (Alpha range 0.88-0.89) of their GP evolved around their sexual expression, uniqueness, and aesthetics, as well as the improvement of their personal and partner’s sexual pleasure. In review, their motives for the GP were met in their stated outcomes.
Table 4A Three Study Comparison Of Self-Reported Motives and Outcomes From Those Wearing Genital Piercings.
Variable
Caliendo et al, 2005 Study: Data Collected 2000 Men with GPs N = 48*
Young, et al, 2010 Study Data collected 2008 Women with GPs N = 240*
Current Study Data collected 2009 Men with GPs N = 445*
Motives for their genital piercing
34/71% “Just wanted one” 24/50% “Trying to feel sexier”
23/45% “For the heck of it”
18/38% “Wanted to be different” 18/38% “Make myself more attractive” (alpha 0.40)
163/70% “Just wanted one” 120/51% “Trying to feel sexier” 111/48% “More control over my body” 93/40% “Seeking uniqueness” 91/39% “Make myself more attractive” (alpha 0.75)
196/90% “Just wanted one”
73/60% “For the heck of it” 67/60% “Trying to feel sexier” 56/58% “More control over body” 51/56% “Seeking uniqueness” (alpha unobtainable)
Outcomes of their genital piercing
36/77% “Improved my sexual pleasure”
35/73% “Helped express myself sexually” 35/73% “Helped me feel unique”
176/76% “Helped express myself sexually 173/75% “Improved my sexual pleasure 157/68% “Helped me express myself 134/58% “Helped me feel feminine” 134/58% “Helped me feel unique” (alpha 0.88)
278/81% “Improved my sexual pleasure
234/71% “Helped express myself sexually”
218/67% “Helped me feel unique” 229/67% “Improved partners sexual pleasure 211/64% “Helped genital look better” (alpha 0.88)
*Numbers will not always add up to 100 because of missing data or multiple answers.
Post-piercing Experiences
The men reported continued satisfaction with their GP and would repeat the procedure. While not many were engaged in exercise/sport activities, those that did, were active (Table 5). A few reported partner refusal of sexual activities when their GP was in place. Almost half reported no piercing complications; of those that did, only 2 major problems were cited. First, with over half reporting Prince Albert piercings, it was not surprising that 25% discussed changes in their urinary flow. Site hypersensitivity was the second most reported problem (23%), otherwise there were no further trends of other severe complications. While 80 (18%) reported STDs after their GP, only 19 itemized the specific type: the most responses were Chlamydia (9). Those that had a history of STDs (Table 2 & 5) before their piercings were significantly more likely to have them post-procedurally (χ2 = 11.5) = 1; p = 0.001).
Table 5 Self-Reported Post Procedural Information From Men with Genital Piercings (GPs)
Complications from piercing No problems Change in urinary flow Site hypersensitivity Skin irritation Rips/tears at site Problems using condoms Keloids @ site Site infection Urinary tract infection Site hyposensitivity Sexual problems Jewellery embedded Erection problems Other, not named
*Numbers will not always add up to 100 because of missing data or multiple answers.
Depression, Abuse, Self-Esteem, and Need for Uniqueness
Four additional characteristics about individuals with GP were examined.24-29 Men with GP respondents reported a small amount of “sad or depressed feelings”; those that had these depressed feelings before their piercings were significantly more likely to continue these depressed feelings post-procedurally (χ2 = 4.1), = 16; p = 0.00). Only 5 (1%) reported being forced to participate in sexual activity against their will, while a few cited (56/12%) physical, emotional, or sexual abuse.
To extract a profile of self-esteem, 8 questions were asked in the pre and post piercing survey sections; internal consistency (Cronbach alpha) of both scales was 0.75. Their responses to both the pre procedure (M = 22.3, SD = 4.51) and the post piercing time (M = 23.1, SD = 3.97) was highly correlated at 0.79 (P<0.01). Two statements triggered split, negative and positive responses with “I make demands on myself that I would make on others” and “I blame myself when things do not work the way I expected.” Lastly, their Need for Uniqueness (NU) was asked using a four item scale24,25in the pre-piercing survey section. When all five responses of the scale were totaled (20), the mean was 11.3 documenting a more positive perspective about their GP, close to the moderate level (Cronbach alpha 0.86), for intentionally wanting to be different, distinctive, and unique. When asked if their overall feelings of NU had changed since obtaining their GPs, those that had NU before their piercings were significantly more likely to have them post-procedurally (χ2 = 11.5) = 16; p = 0.03).
DISCUSSION
When examining this data from men with GP alongside the 2005 published study,21 the cohort almost equalled 500 participants. To our knowledge this is the largest repository of data currently available to provide further evidence of the demographics and health issues regarding men with GP. The anonymous data, obtained by networking sampling and accessible, economical web-based survey, could be viewed as a study limitation. Yet, finding similarities between this data and data collected almost ten years ago suggests that our findings tapped into a core body of knowledge about men with GP. Similar data, obtained at different times, from different respondents increases the credibility and lends the information to further generalizability to influence use in practice.30
The “social reality” 2 of the GP phenomenon is here. All of the men had one type of GP, and some had multiple GP, and many had other general body piercings.35 Awareness of the current types of body modification including GP will help the clinician educate and inform adequately, to give professional advice, and also provide a realistic picture of structural considerations. Respondents stated their GP were an important and satisfying part of their life, they still liked them, and would repeat the procedure; the GP improved their sexual activities, few refused sexual intercourse, those that exercised were active, and they were not troubled by the GP complications. From a medical standpoint the insertion of a GP could be considered a minor surgical procedure, and yet the data suggests that when the GP is performed by experienced hands only minimal side effects are reported. Thus, finding a knowledgeable, expert piercer is an important educational theme. However, patients need to also be aware that certain types of piercing may require some behavioral changes such as toileting and consistent body cleaning. Unfortunately virtually no health care providers, including clinicians, were mentioned in the GP decision making process or care, they usually went to the internet or returned to a piercer for information.21,22 Hopefully, as more clinicians are made aware of GPs, those who are considering GP will find their physician to be a helpful and more informative resource.
These study participants with GP were older, well-educated men, often in a stable relationship, different than what is usually thought about people with body piercings.7, 22,26-27,29,31 This scientific evidence about their overall demographics pose challenges to the current medical literature. Sample demographics from this study and the other two cited GP studies 21,22 do not reflect individuals from stereotypical low performing social and economical backgrounds. Demographically, the people with GP were in their early thirties, Caucasian, heterosexual, well educated, employed, in good health, with some religious beliefs, but not ethnically diverse. In contrast to literature describing men with GP as antisocial miscreants or mostly homosexual, 2,4,18 our data support that these men are more part of the mainstream culture. The avoidance of “rushing to judgment”28 is an important aspect, especially in the way they are often perceived.
Men with GP did not deny their propensity to be risk takers, but being a risk taker was not synonymous with being deviant, but more with achieving individualization.21,28,31 Threads about stable relationships were provided throughout their information, including sexual orientation, marital status, GP complications, and even their lack of many risk behaviours. Their first time for sexual intercourse was close to the male national average. While procurement of any type of body art is thought to be impulsive 7,21-23, their time for GP decision-making was deliberate, as well as their practice of on-going, conscientious care of their piercings.21,22 Absence of alcohol and/or drug consumption before the GP procedure has been a frequent finding in other body art studies.7,21-22,31 Reputable piercing artists advocate for no use of alcohol and drugs as they want their customers to be making realistic procedural decisions about their GP and listening carefully to post GP care instructions.
The unsubstantiated assumptions in the literature about GP complications such as male infertility, scrotal infections, reduction of erotic stimulation, and frequent infections with bicycle rides were also challenged.6,21,36-40 Overall, only two problems of urinary flow changes and site hypersensitivity were reported with their GP. They took their sexual concerns seriously, as part of their internal influences of self esteem and their need for uniqueness. Their documented motives reflected sexual enhancement, aesthetics, as well as uniqueness. Their stated outcomes of the GPs reflected an ability to better express themselves sexually and create a sense of uniqueness; these elements obviously took precedence over the two problems of urinary flow changes and hypersensitivity. Both these motives and outcomes were similar when compared with the other two studies.21,22 Further procedural research is suggested to obtain more information about the reasons some with Prince Albert GP have urinary flow changes, while others do not, to eliminate this as a possible side-effect.
Negative bias continues with the assumption that individuals with GP frequently have STDs.18-20, 36-40 Historically, concern for those who have “exotic adornments” such as body piercings have led some health facilities to require STD screening, no matter what the nature of the presenting complaint.22,35 Yet, in this study and the other two related GP studies,21,22 respondents reported only a few STDs. Their reporting incidence of STD was low compared to the national Guttmacher Institute report of one in three sexually active people will have contracted a STD by age 24.32 As in this study, Chlamydia remains the most highly reported STD in the US.32 While it is important to always conduct a thorough sexual history, 20 perhaps the conscientious care related to the deliberate decision for the GP, and the mostly monogamous relationships reported may account for the limited reporting of STDs. One STD clinic study found that neither socioeconomic status, method of contraception, multiple partners, or the presence of genital infections correlated with GP.38 Further longitudinal research is suggested to examine the long-term effects of GPs, as well as further GP complications and STD prevalence.19
Men, like women, with GP21 reported depressed feelings26,27,29 both pre and post procedure, but gender differences were present with abuse and forced sexual activity. The men with GP reported few incidents of abuse (emotional, physical, or sexual) or forced sexual activity against their will whereas over a third of the women with GP22 reported this. Although women frequently spoke of their use of GPs to take more control in reclaiming their body to “free them from the bonds of molestation and give them strong feelings of empowerment,” 22 men verbalized their use of GPs to give them more sexual control.
STUDY LIMITATIONS
As with any study, several limitations to generalizability of data must be considered and one of methodology has been previously discussed. This was a non experimental, descriptive study design and the respondents self-selected to complete a web-based survey. Bias, inaccurate recall, and/or inflation can result from self-reporting.30 Respondents had to use their personal judgment to interpret questions with the use of an anonymous survey so socially desirable responses could have been entered. Participants with strong negative or positive feelings may have been more likely to complete the survey. Yet, as random sampling is almost impossible in a population with hidden variables, and in spite of these limitations, the respondents did contribute further quantitative data.21,22
CONCLUSIONS
The trend of those obtaining GP continues to increase and is not limited by age, gender, socio-economical backgrounds, or sexual preferences. Many in this study still reported seeking advice of a piercer or the internet. As an identified population at risk for quality health care, further evidence of demographics, piercings and jewellery, motivations, outcomes, and health issues were presented about men with GP so clinicians can provide clinically competent and applicable approaches for care. The collective data examined here, along with some collected almost ten years ago, begins to dispel some of the negative assumptions about this segment of the body modification population regarding their overall demographics, GP complications, and STD prevalence.
Cosmetic outcome following breast-conserving surgery depends on various factors including location of the tumour, weight of the specimen excised, number of surgical procedures, volume of breast, length of scar and postoperative adjuvant treatment1. The best method of cosmetic assessment following breast-conserving surgery is still unclear. However various objective and subjective methods in combination are known to give a good assessment of cosmesis2, 3, 4. It has been shown that photographic assessment is as effective as live assessment in the post-surgical setting5. Methods to assess cosmesis following breast-conserving surgery are varied and more recently computer software are being used to assess cosmesis following breast-conserving surgery.
The aim of this study was to compare three different methods of cosmetic assessment following breast-conserving surgery and to assess the influence of various factors on final cosmetic outcome.
Methods:
One hundred and fifteen patients underwent breast-conserving surgery for carcinoma of breast by wide local excision and level 2 axillary clearance. Following wide local excision, cavity shavings were taken to ensure adequate local excision. Breast drainage was not used but suction drains were used routinely following axillary clearance. All patients received adjuvant breast radiotherapy (46 Gy, 23 fractions with a cavity boost of 12 Gy in 4 fractions) administered over a period of 6 weeks.
Figure-1: Measurement of Breast Retraction Assessment6 (reprinted with permission from Elsevier, ref 6 (page 670), copyright 1999)
Digital photographs were taken at one year in three views; frontal with arm by the side, frontal and oblique with arm abducted to 90 degrees. The photographs were used for subjective and objective assessment of cosmesis. The objective assessment of cosmesis was carried out using Breast Retraction Assessment (BRA) and Nipple Deviation (ND). BRA was calculated as indicated in figure 16. ND was calculated as a percentage difference from suprasternal notch to nipple on normal side compared with the operated side. BRA and ND were then categorised into three groups; BRA: (excellent to good <3.1 cm, fair 3.1-6.5, poor >6.5), ND: (difference of <5% - excellent to good, 5-10% fair and >10% poor). Subjective assessment was carried out using a panel consisting of a Consultant Breast Surgeon, Research Fellow, Secretary, Breast Care Nurse and Nurse Practitioner with each scoring independently. The method described by Harris et al7 with a score of 9-10 for excellent (no visible difference between two breasts), good (slight difference; score 7-8), fair (obvious difference but no major distortion; score 4-6) and poor (major distortion; score <4) was used to categorise patients.
Figure- 2: Measurement of breast volume (Sloane method) Formula for calculation of breast volume: 1/3 π r2h (reprinted with kind permission from Sloane project)
The volume of breast tissue excised was estimated with the length (L), width (W) and height (H) of the excised tissue specimen and the cavity shave measured by the pathologist and using the formulas for a prolate ellipse (V= 0.52* L* W* H); this was added on to the volume of cavity shave calculated using the formula 0.79* L* W* H. The total breast volume was estimated using the mammogram and applying the formula (1/3 πr2h) as shown in figure-2. Based on these measurements the percentage breast volume excised was calculated and compared with cosmetic outcome.
Statistics:
Multirater kappa statistics8 were used to assess inter-observer agreement between five different members of the panel and also to test agreement between the three different methods for assessing cosmesis. The average value given by the panel was used and categories good and excellent were combined in order to compare the three methods of cosmetic assessment. A kappa statistic of less than or equal to 0.20 was considered to demonstrate poor agreement, 0.21 to 0.40 fair agreement, 0.41 to 0.60 moderate agreement, 0.61 to 0.80 good agreement and 0.81-1.00 very good agreement9.
The effect of the percentage volume of the breast tissue excised and the tumour size on the three methods of cosmetic assessment was examined using where appropriate a Jonckhneere-Terpstra test for trend, a Kruskal Wallis test or a Mann-Whitney U test. The effect of the number of breast operations performed and the location of the tumour were assessed using Chi-square test or Fisher’s exact test when appropriate.
Results:
Of the 115 patients assessed using panel assessment 64 (56%) scored good to excellent, 39 (34%) scored fair and 12 (10%) scored poor. ND scored 50(43%) as good to excellent, 32 (28%) as fair and 33 (29%) as poor. Using BRA, the scores were 76 (66%), 38 (33%) and 1(1%) respectively. These results are shown graphically in figure-3.
Figure- 3: Number of patients classified into each of the three categories poor, fair and good/excellent for the three methods bra, nipple deviation and panel assessment. BRA= breast retraction assessment; Panel= assessment by different panel members; ND= nipple deviation
Taking the mean scores for these three methods of assessment and dichotomising the results into two categories of good to excellent and poor to fair, 52% of patients in this study had good to excellent cosmetic result and 48% were categorised as fair to poor cosmetic result. The Kappa statistic was calculated on 115 patients for the three methods of assessment and it was found to have a value of –0.23 (95% CI (–0.35, – 0.11) which falls within the poor agreement category.
Figure- 4: Comparison of panel assessment by different panel members. Pa, Ph, Pg, Pk and Pd= Codes for the different panel members
Examining the panel assessment using the kappa statistics for the 115 patients assessed there was moderate agreement between the panel members (Kappa statistic of 0.42; 95% confidence interval of (0.37, 0.47). This suggests there is moderate chance that the panel members will categorise each patient the same way. If one plots the panel assessment graphically one can see that excellent is used least by all and fair most frequently (figure 4).
Factors affecting cosmesis:
1) Percentage breast volume excised
Figure -5: Effect of percentage breast volume excised on cosmetic outcome using Panel assessment, BRA and ND
For panel assessment it appears that removal of a larger percentage volume gives a poor cosmetic result and a smaller percentage volume an excellent/good result (figure 5) as would be expected clinically. This is supported by a Jonckhneere-Terpstra test for trend (=0.01). Using ND median percentage volumes across the groups did not appear to differ (χ2=1.05 p=0.59, Kruskal Wallis test). However, for BRA, only one patient was classified as poor and no difference was seen between those with fair and good/excellent results (U=477, p=0.34). The median volume excised for different cosmetic outcome using the three methods is shown in table 1.
Table-1: Medians volumes for the three measurements.
Panel assessment
BRA
Nipple deviation
Poor
157.56
(only 1 poor value)
100.61
Fair
88.58
93.11
55.96
Good/Excellent
68.33
76.55
81.33
BRA= breast retraction assessment
BRA= breast retraction assessment
The percentage breast volume excised was then compared with cosmetic outcome using the three methods of assessment. As shown in table 2, 45-65% of patients with <10% estimated breast volume excised had good to excellent cosmetic result compared with 35-50% good to excellent result if >10% breast volume was excised.
2) Tumour location:
Tumour location was divided into inner or outer quadrants of the breast. The distribution of tumours in the breast and the cosmetic outcome with each of the three methods of assessment is shown in table 3. The location of tumour within the breast was not significantly associated with cosmetic outcome (χ2 =1.86, p=0.39 for panel assessment), (p=0.23, Fisher’s exact test for BRA) and (χ2 =0.21, p=0.90 for ND).
Table-2: Estimated percentage breast volume excised and cosmetic outcome
< 10% breast volume excised
> 10% breast volume excised
Panel Assessment
Good to excellent (%)
32 (65)
7 (35)
Fair (%)
15 (31)
6 (30)
Poor (%)
2 (4)
7 (35)
Breast Retraction Assessment
Good to excellent (%)
32 (65)
10 (50)
Fair (%)
16 (33)
10 (50)
Poor (%)
1 (2)
0
Nipple Deviation
Good to excellent (%)
22 (45)
8 (40)
Fair (%)
15 (31)
4 (20)
Poor (%)
12 (24)
8 (40)
3) Number of breast operations:
The influence of number of operations (1 vs 2) was examined for each of the three methods of assessment. Using BRA and Panel assessment there was no significant difference in the cosmetic outcome for patients who underwent one or two operations ( p=0.70 for panel assessment), (p=0.99, Fisher’s exact test for BRA). For ND there does appear to be a larger proportion in the poor group for those with two operations (p =0.30 Fisher’s exact test for ND). This is illustrated in Table 3.
Table-3: Factors affecting cosmesis
Table-3: Factors affecting cosmesis
Panel
BRA
ND
Percentage volume excised
Poor (median (IQR))
Fair (median (IQR))
Good/Excellent (median (IQR))
13.8 (11.0,16.5)
8.4 (4.4,10.4)
5.8 (3.9,8.0)
-
8.0 (4.6,11.6)
6.9 (4.3,10.1)
8.5 (5.1,11.4)
5.8 (3.9,9.4)
7.2 (4.4,11.0)
Location
Poor (outer (n), inner (n))
Fair (outer (n), inner (n))
Good/Excellent (outer (n), inner (n))
8, 2
22,8
47,8
0,1
26,5
51,12
9,1
23,6
33,8
No. of Operations
Poor (One (n), Two (n))
Fair (One (n), Two (n))
Good/Excellent (One (n), Two (n))
9,1
24,6
48,8
1,0
26,5
54,10
20,5
27,2
34,8
Tumour size (mm)
Poor (median (IQR)
Fair (median (IQR)
Good/ Excellent (median (IQR)
12 (9, 15)
11 (9, 19)
12 (7, 15)
-
11 (8,15)
12 (7, 15)
12 (10, 15)
12 (8, 16)
9 (6,14)
Panel= panel assessment; BRA= breast retraction assessment; ND= nipple deviation; IQR= inter quartile range
Panel= panel assessment; BRA= breast retraction assessment; ND= nipple deviation; IQR= inter quartile range
4) Tumour size:
Table 3 shows the median tumour size and interquartile range for the three categories, good/ excellent, fair and poor and one can see that there is no significant difference in tumour size for these categories using panel assessment (Jonckheere-Terpstra p=0.31) or BRA (U =873, p=0.55). However, using ND there was evidence to suggest that large tumour size resulted in poor outcome (Jonckheere-Terpstra, p=0.04).
Thus, tumour size had a significant influence on the cosmetic outcome when ND was used as the method of assessment.
Discussion:
Cosmetic outcome following breast-conserving surgery is assessed using a combination of subjective and objective methods. The subjective method uses a panel of members from different backgrounds to assess overall cosmesis. However, Pezner et al10 showed relatively low level of agreement between observers when a four-point scale was used for assessment of overall cosmesis. The objective methods, which mainly compare the position of the nipple, are easy to reproduce but do not take into account skin changes and give poor assessment of cosmesis for lower quadrant tumours.
In this study the cosmetic outcome was assessed in 115 patients one year post-operatively. The mean cosmetic result using the three different methods of assessment was good to excellent in 55% of the patients, which compares favourably with other studies reported in the literature2, 4. Looking at inter-observer variation for the panel assessment, moderate agreement was found between different panel members. This compares favourably with an earlier study that looked at cosmetic outcome in the EORTC trial 22881/108826. However, when the three methods of cosmetic assessment were compared with each using kappa statistic there was poor concordance. Although some agreement was noted, this was likely to be due to chance as the kappa statistic was low. It is difficult to explain this finding as other authors1, 6 have reported moderate to good agreement between subjective and objective methods. One explanation for this lack of agreement is that each method assesses a different aspect of cosmesis.
The two objective methods of cosmetic assessment (BRA and ND) that are used to assess upward retraction of nipple have been found to be a very good determinant of cosmetic outcome and are easy to reproduce according to Fujishiro et al11. Furthermore, evaluation of nipple position has also been shown to be moderately representative of overall cosmetic result6. BRA is a two dimensional measurement of nipple position and some cosmetic factors such as volume, shape or skin changes cannot be accurately assessed11. This is probably the reason why BRA shows a better cosmetic outcome when compared with subjective assessment by panel members. In this study only one (1%) patient was deemed to have a poor cosmetic outcome using BRA compared with 12 (10%) using panel assessment.
A criticism of the current study is that patients’ perceptions of their own cosmetic outcome were not assessed. Previous studies have shown a significant correlation between patient satisfaction after breast-conserving surgery and their self-assessment of cosmesis12, 13. This study shows that there is need to find a reproducible method of cosmetic assessment which takes into account all the limitations of the methods currently used. More recently computer software like BCCT.core and Breast Analysing Tool have been developed and early results using these software are promising14, 15. There are various factors that are known to affect cosmesis following breast-conserving surgery. As expected larger percentage volume of excised breast tissue was associated with poorer cosmetic result. This was particularly evident from panel assessment. Such a relationship was less clear with BRA and ND. The effect of percentage volume of breast tissue excised and the outcome is consistent with a recent report that showed higher patient satisfaction if estimated percentage breast volume excised was < 10%16. Cosmetic outcome based on tumour location varies depending on the method of assessment used. BRA is adversely affected by tumour in the upper and outer quadrants of the breast, suggesting that surgery causes larger nipple deviation in this quadrant, while panel assessment gives poor scores for tumours located in inferior quadrant2, 11. In this study only 19% of patients had tumours located in the inner quadrant and the small number may explain why, no significant difference in cosmetic outcome was found. Tumour location or the number of operations performed did not appear to affect the cosmetic outcome in this study. The volume of breast tissue excised depends on tumour size. Since the majority of tumours in this study were small, the size of the tumour did not affect cosmetic outcome except when nipple deviation was used. This once again indicates that these three methods of assessment may be looking at different aspects of cosmesis.
In conclusion, cosmetic outcome following breast-conserving surgery is an important, measurable end point. However, the best method of assessment of cosmesis has not been devised17. Although, the objective methods are easier to apply and reproduce, they do not give a good assessment of global cosmetic results. Panel Assessment however, does appear to provide concordant results between different observers and may be a useful, simple measure of cosmetic assessment following breast-conserving surgery.
The fundamental responsibility of an anesthesiologist is to maintain adequate gas exchange through a patent airway. Failure to maintain a patent airway for more than a few minutes results in brain damage or death1. Anaesthesia in a patient with a difficult airway can lead to both direct airway trauma and morbidity from hypoxia and hypercarbia. Direct airway trauma occurs because the management of the difficult airway often involves the application of more physical force to the patient’s airway than is normally used. Much of the morbidity specifically attributable to managing a difficult airway comes from an interruption of gas exchange (hypoxia and hypercapnia), which may then cause brain damage and cardiovascular activation or depression2.
Though endotracheal intubation is a routine procedure for all anesthesiologists, occasions may arise when even an experienced anesthesiologist might have great difficulty in the technique of intubation for successful control of the airway. As difficult intubation occurs infrequently and is not easy to define, research has been directed at predicting difficult laryngoscopy, i.e. when is not possible to visualize any portion of the vocal cords after multiple attempts at conventional laryngoscopy. It is argued that if difficult laryngoscopy has been predicted and intubation is essential, skilled assistance and specialist equipment should be provided. Although the incidence of difficult or failed tracheal intubation is comparatively low, unexpected difficulties and poorly managed situations may result in a life threatening condition or even death3.
Difficulty in intubation is usually associated with difficulty in exposing the glottis by direct laryngoscopy. This involves a series of manoeuvres, including extending the head, opening the mouth, displacing and compressing the tongue into the submandibular space and lifting the mandible forward. The ease or difficulty in performing each of these manoeuvres can be assessed by one or more parameters4.
Extension of the head at the atlanto-occipital joint can be assessed by simply looking at the movements of the head, measuring the sternomental distance, or by using devices to measure the angle5. Mouth opening can be assessed by measuring the distance between upper and lower incisors with the mouth fully open. The ease of lifting the mandible can be assessed by comparing the relative position of the lower incisors in comparison with the upper incisors after forward protrusion of the mandible6. The measurement of the mento-hyoid distance and thyromental distance provide a rough estimate of the submandibular space7. The ability of the patient to move the lower incisor in front of the upper incisor tells us about jaw movement. The classification provided by Mallampati et al8 and later modified by Samsoon and Young9 helps to assess the size of tongue relative to the oropharynx. Abnormalities in one or more of these parameters may help predict difficulty in direct laryngoscopy1.
Initial studies attempted to compare individual parameters to predict difficult intubation with mixed results8,9. Later studies have attempted to create a scoring system3,10 or a complex mathematical model11,12. This study is an attempt to verify which of these factors are significantly associated with difficult exposure of glottis and to rank them according to the strength of association.
Materials & methods
The study was conducted after obtaining institutional review board approval. Six hundred ASA I & II adult patients, scheduled for various elective procedures under general anesthesia, were included in the study after obtaining informed consent. Patients with gross abnormalities of the airway were excluded from the study. All patients were assessed the evening before surgery by a single observer. The details of airway assessment are given in Table I.
Table I: Method of assessment of various airway parameters (predictors)
Airway Parameter
Method of assessment
Modified Mallampati Scoring
Class I: Faucial pillars, soft palate and uvula visible.
Class II: Soft palate and base of uvula seen
Class III: Only soft palate visible.
Class IV: Soft palate not seen
Class I & II : Easy Intubation
Class III & IV: Difficult Intubation
Obesity
Obese BMI (≥ 25)
Non Obese BMI (< 25)
Inter Incisor Gap
Distance between the incisors with mouth fully open(cms)
Thyromental distance
Distance between the tip of thyroid cartilage and tip of chin, with fully extended(cms)
Degree of Head Extension
Grade I ≥ 90◦
Grade II = 80◦-90◦
Grade III < 80◦
Grading of Prognathism
Class A: - Lower incisor protruded anterior to the upper incisor.
Class B: - Lower incisor brought edge to edge with upper incisor but not anterior to them.
Class C: - Lower incisors could be brought edge to edge.
In addition the patients were examined for the following.
High arched palate.
Protruding maximally incisor (Buck teeth)
Wide & short Neck
Direct laryngoscopy with Macintosh blade was performed by an anaesthetist who was blinded to preoperative assessment.
Glottic exposure was graded as per Cormack-Lehane classification13 (Fig 1).
Figure 1: Cormack-Lehane grading of glottic exposure on direct laryngoscopy
Grade 1: most of the glottis visible; Grade 2: only the posterior extremity of the glottis and the epiglottis visible; Grade 3: no part of the glottis visible, only the epiglottis seen; Grade 4: not even the epiglottis seen. Grades 1 and 2 were considered as ‘easy’ and grades 3 and 4 as ‘difficult’.
Results
Glottic exposure on direct laryngoscopy was difficult in 20 (3.3%) patients.
The frequency of patients in various categories of ‘predictor’ variables is given in Table-II
Table II: The frequency analysis of predictor parameters
Airway Parameter
Group
Frequency (%)
Modified Mallampati Scoring
Class 1&2
Class 3&4
96%
4%
Obesity
Obese BMI (≥ 25)
Non Obese BMI (< 25)
28.7%
71.3%
Inter Incisor Gap
Class I : >4cm
Class II: <4cm
93.5%
6.5%
Thyromental distance
Class I: ≥ 6cm.
Class II: ≤6cm.
94.6%
5.4%
Head & Neck Movements
Difficult {class II & III (90˚)}
Easy {class I(>90˚)}
16%
84%
Grading of Prognathism
Difficult (class III)
Easy (class I + II)
96.1%
3.9%
Wide and Short neck
Normal neck body ratio 1:13
Difficult (Ratio≥ 1:13)
86.9%
13.1%
High arched Palate
Yes
No
1.9%
98.1%
Protruding Incisors
Yes
No
4.2%
95.8%
The association between different variables and difficulty in intubation was evaluated using the chi-square test for qualitative data and the student’s test for quantitative data and p<0.05 was regarded as significant. The clinical data of each test was used to obtain the sensitivity, specificity and positive and negative predictive values. Results are shown in Table III.
Table III: Comparative analysis of various physical factors and scoring systems
Physical factors and various Scoring Systems
Sensitivity ( % )
Specificity ( % )
PPV
( % )
NPV
( % )
Obesity
81.8
72.76
6.34
99.43
Inter incisor gap
18.8
94.14
6.6
98.1
Thyromental distance
72.7
96.5
32.0
99.4
Head and Neck movement
86.36
86.0
34.6
99.7
Prognathism
4.5
96.3
2.7
97.9
Wide and Short neck
45.5
87.9
7.8
98.6
High arched palate
40.1
99.38
60.0
98.67
Protruding incisor
4.6
95.9
2.5
97.79
Mallampati scoring system
77.3
98.2
48.57
99.5
Cormack and Lehane’s scoring system
100
99.7
88
100
Discussion
Difficulty in endotracheal intubation constitutes an important cause of morbidity and mortality, especially when it is not anticipated preoperatively. This unexpected difficulty in intubation is the result of a lack of accurate predictive tests and inadequate preoperative assessment of the airway. Risk factors if identified at the preoperative visit help to alert the anaesthetist so that alternative methods of securing the airway can be used or additional expertise sought before hand.
Direct laryngoscopy is the gold standard for tracheal intubation. There is no single definition of difficult intubation but the ASA defines it as occurring when “tracheal intubation requires multiple attempts, in the presence or absence of tracheal pathology”. Difficult glottic view on direct laryngoscopy is the most common cause of difficult intubation. The incidence of difficult intubation in this study is similar to that found in others.
As for as the predictors are concerned, different parameters for the prediction of difficult airways have been studied. Restriction of head and neck movement and decreased mandibular space have been identified as important predictors in other studies. Mallampati classification has been reported to be a good predictor by many but found to be of limited value by others14. Interincisor gap, forward movement of jaw and thyromental distance have produced variable results in predicting difficult airways in previous studies7,15. Even though thyromental distance is a measure of mandibular space, it is influenced by degree of head extension.
There have been attempts to create various scores in the past. Many of them could not be reproduced by others or were shown to be of limited practical value. Complicated mathematical models based on clinical and/or radiological parameters have been proposed in the past16, but these are difficult to understand and follow in clinical settings. Many of these studies consider all the parameters to be of equal importance.
Instead of trying to find ‘ideal’ predictor(s), scores or models, we simply arranged them in an order based on the strength of association with difficult intubation. Restricted extension of head, decreased thyromental distance and poor Mallampati class are significantly associated with difficult intubation.
In other words patients with decreased head extension are at much higher risk of having a difficult intubation compared to those with abnormalities in other parameters. The type of equipment needed can be chosen according to the parameter which is abnormal. For example in a patient with decreased mandibular space, it may be prudent to choose devices which do not involve displacement of the tongue like the Bullard laryngoscope or Fiber-optic laryngoscope. Similarly in patients with decreased head extension devices like the McCoy Larngoscope are likely to be more successful.
Conclusion
This prospective study assessed the efficacy of various parameters of airway assessment as predictors of difficult intubation. We have find that head and neck movements, high arched palate, thyromental distance & Modified Malampatti classification are the best predictors of difficult intubation.
The implementation of Modernising Medical Careers (MMC) significantly altered the structure of postgraduate medical education in the UK. MMC oversees the training of all UK doctors from the outset of their career, the first two years of which comprise the Foundation Programme. Successful completion of the Foundation Programme is based upon doctors’ Foundation Portfolios in which they must demonstrate achievement of essential competences and work-based assessments. Doctors are also encouraged to attain additional competencies and to develop their portfolio further. Voluntary educational activities undertaken outside the workplace form the basis of this.
Application into Specialist Training following the Foundation Programme is highly competitive, with an average of three applicants for each post in 20081. Points-based shortlisting criteria are used to select candidates, and are based upon the contents of the Foundation Portfolio and application form. This means that points can be scored for activities not required for completion of the Foundation Programme, such as Royal College membership examinations and course attendance. Foundation Programme doctors undertake voluntary activities to improve their portfolios however no quantifiable evidence currently exists as to what doctors undertake in this respect.
We aimed, therefore, to determine firstly what voluntary educational activities Foundation doctors are undertaking. We also aimed to establish their underlying motivating and deterring factors, financial costs incurred, and use of annual and study leave and ‘specialty taster days’, to assess the overall extent and impact of portfolio activities. The authors hope the results are useful in informing medical students and Foundation trainees of the scope of activities of their peers, and in advising supervisors of the activities of their trainees.
Methods
A two page anonymous questionnaire was posted at random to 100 Foundation doctors across five hospitals in East Midlands Deanery (50 Foundation Year 1, 50 Foundation Year 2). See Appendix 1
Demographics
The first section of the questionnaire asked for the sex and grade of respondents (Foundation Year 1 (FY1), or Foundation Year 2 (FY2))
Activities
Respondents were directly asked whether they were attending courses or conferences, using on-line e-learning packages, joining professional bodies/societies or sitting higher professional examinations such as royal college membership examinations/higher degrees.
Cost
Doctors were asked how much money (excluding that of teaching allowances) and days of annual leave they used on the above activities. They were also asked how many of their allowed ‘specialty taster days’ they had taken during each year.
Motivating and deterring factors
Doctors were asked to rank from a list the motivating and deterring factors determining what activities they were undertaking.
Professional development
Doctors were finally asked to rank which educational activities they thought would make them a better overall Foundation doctor.
Results
Response rate was 49% with 49 doctors returning the questionnaire. Of these 69.4% (n=34) were Foundation Year 1 (FY1) and 30.6% (n=15) were Foundation Year 2 (FY2), with 53.1% female and 46.9% male.
Activities
Overall 89.8% (n=44) of respondents were engaged in voluntary educational activity (FY1 85.3%, FY2 100%). The most common mode (89.8%, n=44) was e-learning packages (FY1 85.3% (n=29), FY2 100% (n=15)) followed by joining/ becoming a member of professional bodies or societies ie BMA etc (73.5%, n=36) (FY1 64.7% (n=22), FY2 93.3% (n=14)), followed by courses (69.4%, n=34) (FY1 55.9% (n=19), FY2 100% (n=15)), undertaking higher qualifications (36.7%) (FY1 14.7% (n=5), FY2 86.7% (n=13)) and attending conferences (14.3%) (FY1 14.7% (n=5), FY2 13.3% (n=2))– See figure 1.
Fig 1 – A graph to show the percentage of Foundation year 1 and 2 doctors involved in each mode of voluntary educational activity.
Of the courses attended, 25.5% pertained to teaching, 25.5% to advanced life support and 18.0% to surgical skills. The remaining 31% of courses related to a variety of other interests such as anaesthetic skill days, expedition medicine courses, and sub speciality specific courses such as movement disorder workshops and laparoscopic surgery.
Cost
The mean amount spent by Foundation Year 1 Doctors on these activities was £581 (range £0 - £3100) Foundation Year 2 Doctors spent significantly more at £1842 (range £0 - £3500). The mean cost per activity is shown in figure 2.
Fig 2 – A graph to show the mean amount of money spent by foundation year 1 and 2 doctors on each mode of
educational activity.
The mean number of days of annual leave used by doctors for these activities was 2.8 in FY1 and 5.3 in FY2, therefore combining to average 8.1 days in total that would be used over the whole foundation programme. Of their five allowed ‘taster – days’ the mean number attended was 1.3 and 2.9 by FY1 and FY2 doctors respectively. Only 20.4% of doctors took their full entitled allowance.
Motivating and deterring factors
The most common factor motivating Foundation doctors to undertake portfolio educational activities was the belief they would help candidates achieve a specialist training post (67.3%). Only 12.2% engaged primarily out of personal interest with 8.2% to improve their medical competence (See Table 1).
Primary Motivating Factor
FY1 Doctors
FY2 Doctors
Overall
Percentage (%)
Number
Percentage (%)
Number
Percentage (%)
Number
Improve chance of specialist training post
58.8
20
86.7
13
67.3
33
Personal interest
14.7
5
6.7
1
12.2
6
To improve medical competencies
11.8
4
0
0
8.2
4
On advice of seniors
11.8
4
6.7
1
10.2
5
Other
2.9
1
0
0
2
1
TOTAL
100
34
100
15
100
49
Table 1 – A table to show the primary motivating factors of foundation doctors to undertake voluntary portfolio educational activities.
The most common deterrents were a lack of study leave (42.9%), lack of annual leave (22.4%) and expense (20.4%) (See Table 2).
Primary Deterring Factor
FY1 Doctors
FY2 Doctors
Overall
Percentage (%)
Number
Percentage (%)
Number
Percentage (%)
Number
Lack of study leave
38.2
13
53.3
8
42.9
21
Lack of annual leave
23.5
8
20
3
22.4
11
Financial expense
17.6
6
26.7
4
20.4
10
Lack of career choice
11.8
4
0
0
8.2
4
Not relevant to Foundation doctors
8.8
3
0
0
6.1
3
Other
0
0
0
0
0
0
TOTAL
100
34
100
15
100
49
Table 2 – A table to show the primary deterring factors listed by foundation doctors that deter them from undertaking voluntary educational portfolio activities.
Professional development
The final section of the questionnaire asked respondents which educational activity they felt was most influential in making them a better Foundation doctor. Interestingly 83.7% (n=41)(FY1 88.2% (n=30), FY2 73.3%( n=11)) felt on-call experience was most influential, with only 6.1% (FY1 2.9% (n=1), FY2 13.3% (n=2)) citing courses, 6.1 % (FY1 2.9% (n=1), FY2 13.3% (n=2)) e-learning packages and 4.1% (FY1 2.9% (n=1), FY2 6.7% (n=1)) qualifications (Fig 3).
The academic conference was ranked least influential by 89.8% (n=44) (FY1 85.3% (n=29), FY2 100% (n=15)) of respondents, followed by 6.1% (n=3) (FY1 8.8% (n=3), FY2 0.0% (n=0)) citing courses, and 4.8% (FY1 5.8% (n=2), FY2 0.0% (n=0)) e-learning packages (Fig 3).
Fig 3 – The above graph was the response of Foundation doctors when asked which activities they thought were most and least influential in making them a better foundation doctor.
Discussion
This survey suggests that Foundation doctors undertake numerous activities at significant personal expense to expand their portfolios, and are primarily motivated by a belief that this will increase their chance of obtaining higher specialist training posts.
Educational activities and opportunities
The advent of the European Working Time Directive and New Deal document2 have resulted in junior doctors working considerably fewer hours than in previous years. This has led some authors to conclude that the quality of learning opportunities in the working environment has reduced 3 .With 89.8% of Foundation doctors in this survey actively undertaking some form of educational activity outside of work, this suggests that Foundation doctors may be going some way to re-dressing this balance. It may also come as a surprising yet reassuring figure to Foundation Programme educational supervisors who may be unaware of the education of their trainees outside of work.
We found the most popular mode of educational activity to be the e-learning package. E-learning is an effective and extensively employed method for both distance learning4 , and as an adjunct to “traditional” lecture-based techniques across several disciplines. It has also been shown to be a well received and practical method of supplementary education for doctors5 and our study suggests this is particularly true for the Foundation years. The reasons why e-learning is popular in this group was not explored, but its low cost, easily accessible and modular nature may have some part to play. As medical schools continue to utilise this modality to a greater extent, its follow-through into the Foundation years and postgraduate medical education in general is inevitable. With such high uptake, e-learning packages are a promising format for delivering education to this group.
Popular courses undertaken by Foundation doctors related to obtaining teaching skills, or advanced life support. This suggests that Foundation doctors place a high emphasis on teaching and training, and on recognising and managing acutely ill patients. These are two core objectives of the Foundation Programme. However, one could also argue that doctors undertaking courses outside work to achieve essential competencies casts doubt on the ability of the Foundation Programme to deliver them. We submit that educational supervisors are in a prime position to appraise this issue.
The least popular mode of activity in our survey was the attendance of a medical conference. It was also regarded as least influential by 89.7% of respondents. There is a global shortage of medical academics6, and as conferences serve to introduce junior doctors to academic medicine and research, perhaps academic doctors should take a more prominent role in promoting conferences as an educational activity.
Time and money
Doctors incur the majority of their costs attending courses with Foundation Year 1 and 2 doctors spending £365 and £1120 respectively on this area (fig 2). This highlights the possibility that Foundation doctors may be prone to financial exploitation by a growing number of courses which are often unvalidated. As senior advice was the primary motivating factor for only 10.2% of activities, this suggests that educational supervisors could play a greater role in assessing, appraising and advising their trainees on the courses best suited for them and their professional development.
The overall financial cost incurred for all portfolio educational activities was £581 for FY1 and £1842 for FY2. Whilst previous estimates have been made in this area, this is the first specific to the Foundation Programme and to include non-mandatory outlay, and represents 3 % and 7% of the basic salary for FY1 and FY2 doctors before tax. As our survey found financial expense to be a significant deterrent to portfolio activity (20.4% of respondents), a potentially serious implication is that expense will limit the uptake of postgraduate education in the future. From the authors’ own experience such professional costs are not explained to medical students and that this issue merits more attention in undergraduate education.
A lack of study leave was highlighted as the main deterring factors to educational portfolio activities (42.9%). This is of particular interest as only 20.4% of Foundation doctors use their full ‘taster-day’ entitlement. These ‘taster days’ are a fundamental aspect of the Foundation Programme, offering doctors the opportunity to explore a specialty for up to five days per year. However, whilst doctors fail to utilise them, they take an average of 8.1 days’ annual leave over the two year programme for educational purposes.
The reasons behind this are unclear, but may be due to a lack of awareness of these ‘taster days’. With a lack of study leave hindering educational activities, a potential solution might be for doctors to have the option to utilise ‘taster days’ as a form of study leave.
Professional education and motivation
Between 1998 and 2005, the number of medical students in the UK has risen by 57%7. Increasing numbers of doctors and decreasing working hours may reduce the amount of on-call experience for those in the Foundation Programme. However, it is this on-call experience that is regarded by the vast majority (83.7% in this study) as the most important educational modality in making them a better foundation doctor. Although time and money are perceived as barriers to portfolio educational activities it appears that doctors value this on-call experience above all. With key aims of the Foundation Programme being training and emergency competence, efforts must be made to preserve this experience.
Whilst Foundation doctors are engaging in numerous portfolio activities, their underlying motivations are interesting. It appears this group are primarily motivated not by the educational benefits of these activities, but rather by their perceived ability to help attain a specialist training post. This could suggest that the educational portfolio is at risk of becoming a ‘tick-box’ means for career progression, rather than addressing limitations, exploring interests and aspiring to clinical excellence. This contrasts with the conclusions of the most recent assessment of postgraduate medical education in the UK8.
As competition for jobs appears to be driving Foundation doctors to undertake educational activities it remains unclear whether engaging in these activities to obtain jobs, rather than competencies, reduces their validity and educational outcomes. Furthermore it is unclear whether trainees will be more likely to achieve their overriding aim of obtaining a specialist training post through these activities. Determining the career outcomes of doctors undertaking these activities will provide an evidence base, allowing educational supervisors to optimally advise their trainee in portfolio educational activities.
Conclusions
This is a baseline survey quantifying portfolio educational activities in the Foundation Programme, applicable to trainees and supervisors alike. Whilst the latter are well aware of assessments such as DOPS (Direct Observation of Procedural Skills) and CbD’s (Case-based Discussions), they are often less aware of the voluntary educational activities of their trainees.
Our study would suggest that Foundation Programme doctors are a cohort driven to undertake numerous voluntary educational activities, albeit largely to achieve career progression rather than accrue educational benefit. To this end they undertake activities such as e-learning, courses and higher qualifications at the expense of conferences. For this they spend significant amounts of money and leave, yet continue to site a lack of traditional study leave as a barrier to further educational development. The authors would suggest that further work is needed to develop the role of educational supervisors in the Foundation Programme in harnessing the motivation of their trainees, and guiding them appropriately.
Key Points
·Foundation Doctors spend significant amounts of time and money on voluntary educational activities.
·Foundation Doctors are primarily driven to undertake these activities due to the belief that it will help them obtain specialist training posts.
·A lack of study leave is the primary barrier to voluntary education.
·The academic medical conference is viewed as the activity least likely to improve medical competence, whereas on-call experience is regarded as the most likely.
·Foundation Programme educational supervisors are best placed to guide their trainees towards the most appropriate educational modalities
The Western world is experiencing a rapid increase in the incidence of femoral neck fractures, from 50000 fractures in 1990 to a projected 120000 in 20151 as the age of the population increases. Hip fractures account for approximately 20 percent of orthopaedic bed occupancies in Britain at a total cost of up to £25000 per patient1.Around half of these fractures are intracapsular in nature of which two thirds are displaced.
The ideal surgical treatment for displaced intracapsular femoral neck fractures remains controversial with studies indicating a lack of consensus among treatment centres2,3. Options include reduction with internal fixation, cemented or cementless hemi-arthroplasty and total hip replacement. Internal fixation is less traumatic than arthroplasty but has a higher re-operation rate4,5 whilst cemented femoral prostheses are associated with a lower rate of revision compared to cementless implants. In addition there are statistically significant improvements in pain scores, walking ability, use of walking aids and activities of daily living within the cemented group6,7. The cementation process may however be associated with increased morbidity due to fat embolisation and increased length of operation8.
Treatment planning for intracapsular fractures, therefore, needs to take into account the patient’s medical fitness and activity level as well as the cost-effectiveness of the procedure.
Figure 1: Exeter Trauma Stem (ETS) Implant
The Exeter Trauma Stem is a new monoblock unipolar implant using an intermediate size 1.5, forty millimetre offset Exeter stem with a large head sized to match the patient’s anatomy (Figure 1, 2).
Figure 2: X-ray of ETS with correct length. Neck cut has been made 1cm above lesser trochanter with shoulder of prosthesis sunk below greater trochanter to ensure equal leg length
As yet there are no independent published series of the results of using this implant. Purported advantages of the ETS include the use of a tried and tested polished, tapered stainless steel stem with which many primary hip surgeons are familiar, ease of ‘cement-in-cement’ revision to a total hip replacement should the patient develop acetabular erosion and the relatively low cost of £240 compared to many contemporary cemented implants.
This study prospectively evaluates the first 50 ETS hemiarthroplasties performed at the Norfolk and Norwich University Hospital, UK over a six month period providing an indication of early outcomes and complications involved with the use of this prosthesis.
METHOD
Patients presenting to our unit with a displaced intracapsular femoral neck fracture who were sufficiently active to get out of their home independently, had an ASA grade of 1 or 2 and were not significantly cognitively impaired were treated with a cemented ETS prosthesis. In addition, patients with displaced intracapsular fractures associated with significant comminution of the medial femoral neck precluding the use of our standard calcar-bearing Austin Moore (Stryker Howmedica Osteonics Ltd) hemiarthroplasty were also treated with an ETS regardless of functional capability and medical condition.
The first fifty patients who underwent ETS hemiarthroplasty as a primary treatment for fractured neck of femur were included in the study. Four patients were excluded. Two of these patients had an ETS performed due to failure of cancellous screw fixation and two as part of a two stage revision for infected uncemented prosthesis.
All fifty procedures were performed with the patient in the lateral position via the modified lateral approach with the glutei incised at the musculotendinous junction. Cefuroxime was given on induction in each instance followed by two post operative doses at eight and sixteen hours after the procedure. Patients were scored by the hospital protocol for risk of thrombosis and were administered aspirin or subcutaneous low-molecular weight heparin as appropriate. All drains were removed between twenty-four and forty-eight hours and patients were mobilised within one day of operation as pain allowed.
Patient demographics and operative details were gathered both from the patients’ notes and from the ORSOS computerised theatre system.
Radiographic evaluation involved the Barrack9 cementation grading system, Dorr’s criteria10,11 including varus/valgus alignment of the prosthesis and leg length measurement.. Measurements of length and varus/valgus were performed using the PACS (GE Medical Systems 2005) digital imaging system by two orthopaedic registrars independent of one another.
Finally all fifty patients were sent an Oxford Hip Score12 at between two and four months postoperatively. Three patients died before the questionnaires were sent and of the remaining forty seven, there was a 98% response rate with 44 questionnaires completed solely by the patient and a further two completed with the aid of a carer.
RESULTS
1. Patient Demographics and operative details
Of the fifty patients in the study, thirty six were female and fourteen male. The mean age was 78 (range 38 to 99). Forty four ETS hemiarthroplasties were performed due to patient fitness and activity levels (Type 1 patients) with six undertaken in frail patients due to fracture extension into the calcar (Type 2). All type 1 patients were ASA grade 1 or 2 with all type 2 patients ASA grade 2-4. All type 1 patients had a mini-mental test score of 10/10 with type 2 patients ranging from 0-7.
The mean delay to surgery was 26 hours (9-58). Eight procedures were performed by consultants, thirty eight by registrars (training years three to six) and four by the trauma fellow under supervision by a senior. The mean operative time was sixty four minutes and the mean haemoglobin drop was 2.6 g/dl3 . Seven patients required post operative transfusion of either two or three units of packed cells.
Thirty four of the patients mobilised unaided pre-injury with eight using one stick, four using two sticks and four using a frame. Using the four categories above, the average drop in mobility from injury to discharge was 1.6 levels.
The average hospital stay was 8.6 days (range 5-69) with thirty five patients discharged to their own house, four to their own residential home and eleven to a rehabilitation ward.
2. Radiographic Evaluation
The cement mantle was firstly evaluated using Barrack’s grading:-
grade A: medullary canal completely filled w/ cement (white out). grade B: a slight radiolucency exists at the bone cement interface. grade C: a radiolucency of more than 50% at the bone cement interface. grade D: radiolucency involving more than 100% of the interface between bone and cement in any projection, including absence of cement distal to the stem tip
Post-operative radiographic evaluation according to this system showed that 54% of cement mantles were Barrack grade B (27 cases) with the majority of the remainder grade C (12 cases) and grade A (eight cases). Two were graded as D.
Dorr’s criteria were employed firstly to assess whether there was an adequate cement thickness of 3mm in Gruen zones 3 and 7 and of one centimetre distal to the tip of the prosthesis. Thirty-four prosthesis scored 3/3, nine scored two, four scored one and two scored none.
Dorr’s criteria also assess position of the prosthesis using the AP radiograph. Ten prostheses were placed in a neutral position related to the femoral shaft. Seven were placed in 1-2 degrees of varus, twenty-seven were placed in 1-2 degrees of valgus and five were placed in 3-6 degrees of valgus.
There were equal leg length measurements in nineteen patients post-operatively with two patients left 5-10mm short on the operated side. Twenty-eight patients were left long with a mean lengthening of 12mm (5-30) and of these five were left between 20 and 30mm long one of which was irreducible and needed to be revised on the table.
3. Post-operative Scoring
The Oxford Hip Score contains 6 questions relating to pain and six relating to function and mobility which are scored 1 point for the best outcome and five for the poorest (Score 12-60). The average pain score was 12.0 and the average functional score was 15.2 giving an overall score of 27.2. The type 1 patients fared better with an average score of 25.3, the average score for type 2 patients was 44.3
4. Complications
The one immediate complication was the need for an on-table revision due to an irreducible prosthesis.
There was one superficial wound infection requiring antibiotic therapy and one early deep infection requiring open washout in theatre which resolved the infection in combination with antibiotic therapy.
There were three deaths (one CVA, one MI and one from pneumonia) all of which occurred between 30-90 days from the operative procedure.
DISCUSSION
The cohort of patients included in this study was similar to other studies with regards to male:female ratio, age and cognitive function4,5. The patients also experienced a delay to surgery and length of operation similar to previous studies4,7. The length of inpatient stay, however, was markedly better at 8.6 days compared to approximately fourteen to twenty-one days cited in the literature13,14.
The length of operation, post-operative mobility and transfusion requirements were also similar to studies evaluating hemiarthroplasty outcomes4,5.
Post-operative radiographic evaluation showed greater than 50% of cement mantles were Barrack grade B with the majority of the remainder grade C (24%) and A (16%). There was no statistical difference between our findings and those of an 8-12 year study of the Exeter stem in total hip replacement15. The two Barrack D grade cement mantles were in patients who became unwell intra-operatively and the decision was taken not to pressurise during cementation.
Figure 3: Original ETS broach with squared off handle, not allowing intra-operative trialling
The major difficulty evident from this study is the correct positioning of the ETS prosthesis with regards to restoration of accurate leg length which the authors believe was due to two reasons. Firstly, the original set for the Exeter Trauma Stem comes with one femoral broach (Fig 3) which does not allow trial reduction. Therefore positioning of the prosthesis required intra-operative estimation of the correct leg length which can be difficult with hip fractures as the leg length is abnormal at the commencement of surgery. Therefore the centre of rotation of the femoral head on the injured side was approximated by comparison with the contralateral side on the pelvic AP radiograph and referenced against the level of the greater trochanter during the procedure.
Secondly, because the large monoblock head of the ETS is matched to the patient’s own femoral head anatomy, the diameter of the ETS head is generally around 15-30mm wider than the 28mm heads commonly used with the Exeter stem in elective hip arthroplasty. Therefore care must be taken to sink the stem by a corresponding amount if a similar neck cut is used or the femoral neck osteotomy should be made at a more distal level. This often involves positioning the shoulder of the ETS stem below the level of the greater trochanter. This can mislead surgeons who are familiar with the Exeter stem as placing the ETS stem in a similar position to that employed with smaller head elective arthroplasty results in limb lengthening. Figure 4 shows a leg length discrepancy of 15mm despite a low neck cut as the stem has not been sunk sufficiently. This led to 56% of patients being left with true lengthening of the operated limb and one prosthesis irreducible. It is difficult to assess whether this is a common problem in the literature with other hemiarthroplasties used for femoral neck fractures as none of the comparable studies comment on clinical or radiographic assessment of leg length.
Figure 4: X-ray of ETS with limb lengthening. Although the neck cut has been made relatively low in relation to the lesser trochanter, the shoulder of the prosthesis slopes marginally above the greater trochanter, inadvertently lengthening the operated limb.
One major advantage to the tapered Exeter stem is the ease with which conversion to a total hip replacement can be performed using an in-cement technique16. Many of the patients included in this study were below the age of 70 and a proportion could be expected to outlive the prosthesis especially with regards to acetabular erosion4. Whilst none of this cohort has required revision for loosening, the irreducible Exeter implant was revised on-table using this technique without further complication.
Post operative Oxford Hip Scores were encouraging with no difference between our mean score of 27.2 and other studies evaluating both cemented hemiarthroplasty and total hip replacement following femoral neck fracture12,17,18.
The mortality rate was 6% six to twelve months post surgery with all three deaths more than one month post surgery and apparently unrelated to the surgery itself. Overall mortality rates following neck of femur fracture are approximately thirty percent at one year however studies specifically looking at outcomes following cemented hemiarthroplasty in the fit and active patient have found mortality rates similar to this study5,19.
Costing around £240, the ETS is a relatively cheap prosthesis in comparison to cemented bipolar prosthesis depite the additional expense of a cement restrictor, bone cement, cement gun and cement pressurisers.
In conclusion, the Exeter Trauma Stem (ETS) is an effective method of treating displaced intracapsular neck of femur fractures with encouraging post-operative functional, pain and radiographic scoring outcomes. The message highlighted by this study is that additional care is needed with regards to the correct positioning of the prosthesis to ensure the restoration of limb length. Subsequent to discussion with the Stryker representative regarding the results of this study, a second generation trialling system has been added to the set with a modular broach. The authors suggest that not only should these modular broaches be used, but also accurate pre-operative planning is needed to ensure equal leg lengths post-operatively.
The genus pseudomonas are Gram-negative, aerobic, rod-shaped bacterium with unipolar motility,[1]contains more than 140 species, most of which are saprophytic. More than 25 species of pseudomonas are associated with humans [2]. Most pseudomonads known to cause disease in humans are associated with opportunistic infections. These include Ps. aeruginosa,Ps. fluorescens, Ps. putida, Ps. cepacia, Ps. stutzeri, Ps. maltophilia, and Ps. putrefaciens. Only two species, Ps. mallei and Ps. pseudomallei, produce specific human diseases: glanders and melioidosis. Ps. aeruginosa and Ps. maltophilia account for approximately 80 percent of pseudomonads recovered from clinical specimens [1,4].
Because of the frequency with which it is involved in human disease, Pseudomonas. aeruginosa has received the most attention. It is a ubiquitous free-living bacterium and is found in most moist environments. Although it seldom causes disease in healthy individuals, it is a major threat to hospitalised and immunocompromised patients, particularly those with serious underlying diseases such as cancer and burns [5]. The high mortality associated with these infections is due to a combination of weakened host defenses, bacterial resistance to antibiotics, and the production of extracellular bacterial enzymes and toxins [6].
Pseudomonas aeruginosa is a leading gram negative pathogen that causes nosocomial infections, accounting for 20% of pneumonia and 16% of urinary tract infections according to recent data from national nosocomial infection surveillance system [7]. According to the CDC, the overall incidence of Pseudomonas aeruginosa infections in U.S. hospitals averages about 0.4 percent (4 per 1000 discharges), and the bacterium is the fourth most commonly isolated nosocomial pathogen accounting for 10.1 percent of all hospital-acquired infections[9].
Resistance of this notorious bacterium to commonly used antimicrobial agents is becoming an increasing clinical problem and a recognised public health threat because there are limited number of antimicrobial agents including the antipseudomonal penicillins, cephalosporins, carbapenems, aminoglycosides and fluoroquinolones with reliable activity against it [11]. It has intrinsic resistance to many antimicrobial agents and only a few antimicrobial agents show potent antibacterial activity against this bacterium. The emergence of multidrug resistance (MDR) Pseudomonas aeruginosa has became a serious problem [12]. There are several mechanisms which may contribute to the antimicrobial resistance among Pseudomonas aeruginosa including the production of chromosomally encoded Amy C B-lactamases [13]. Hypermutable strains of Pseudomonas aeruginosa with defects in themethyl directed mismatch repair (MMR) system are also being frequently isolated from the lungs of cystic fibrosis (CF) patients [13].
MATERIALS AND METHODS:
Samples collection: For this study, a total of 1008 clinical isolates of Pseudomonas aeruginosa, were isolated from 2800 different clinical specimens including; urine (n= 905), ear swabs (n= 496), eye swabs (n=26), fluids (n= 31), pus swabs (n= 342), HVS (n= 157), and sputum (n= 843) received at the microbiology section of Burgor Anklesaria Hospital’s pathological laboratory between January 2008 and September 2008.
Primary isolation of test strains: For the primary isolation of test culture specimens were inoculated on routine culture media including CLED agar (Merck, Germany), EMB agar (Merck, Germany), MacConkey’s agar (Oxoid, UK), and Chocolate agar (Merck, Germany). Pigment production was interpreted on the basis of growth on Nutrient agar (Merck, Germany).
Control stain: ATCC Control strain of Pseudomonas aeruginosa(27853).
Spot tests: Selected colonies were further confirmed by spot tests including; Gram’s stain (Merck, Germany), Oxidase test (Oxoid, UK), Citrate utilisation test (Merck, Germany), and Urease tests (Merck, Germany) [1,4].
Sugar fermentation & IMVIC: Selected colonies were also subjected to Oxidative fermentation and IMVIC i.e. Indole, Methyl reductase test, Vogus prosekure test for confirmation of specie [1,4].
Antibacterial susceptibility testing: Antibacterial susceptibility testing of selected Pseudomonas aeruginosa species was done on Mueller Hinton agar (MHA) (Merck, Germany). To make bacterial suspensions, four to five colonies of pure growth from overnight cultures of test strains were transferred into a tube containing four to five millilitres of nutrient broth (Merck, Germany), and incubated at 37 °C to match the turbidity with McFarland’s index of 0.5 (usually 2-6 hours). Lawns of each bacterial suspension were made on MHA using sterile cotton swabs. Commercially available standard antibiotic discs of standardised concentrations (Oxoid, UK) (Amikacin, Ceftriaxone, Cefotaxime, Sulzone (Cefapeozone+Sulbactum), Meropenam, Ciprofloxacin, and Fosfomycin) were positioned at appropriate distances on the bacterial lawns and incubated at 37 °C for 24 hours. The growth inhibition zones were carefully measured with calipers and recorded according to the standard Kirby-Bauer disc diffusion method[2] and CLSI/NCCLS guidelines 2003 & 2007[8,9,13].
RESULTS:
This study was conducted on 2800 multiple type of clinical specimens received at Burgor Anklesaria Hospital’s pathological laboratory during January 2008 to September 2008. Out of these a total of 1008 clinical isolates were identified as Pseudomonas aeruginosa on the basis of gram’s stain and spot test reactions. Morphologically all of these isolates were gram negative, non sporing, capsulated, and motile short rods, produced typical grapes like odor of amino acetophenone and blue water soluble non fluorescent pigment pyocyanin.They were also positive for oxidase and citratase with variable ability to utilize urea agar. Of these1008 Ps. aeruginosa, 532 isolates were from male patients (504 adults and 28 children), and 476 isolates were from female patients (442 adults and 34 children) (Table 1).
Antibacterial susceptibility of seven selected antibiotics was determined against 1008 test strains of
Pseudomonas aeruginosa, using Kirby and Bauer disc diffusion method[2], against commercially available standardised antibiotic filter discs (Oxoid, UK). These strains were isolated from seven different categories of specimens including ear swabs, wound pus, urine, sputum, eye swab, fluids and high vaginal swab (HVS) (Table 2 & 3).
Another interesting observation was that a maximum number of test strains were isolated from urine i.e. 403 (40%). While, only 6 (0.6%) were isolated from eye swabs (Table 2). When susceptibility results were compared according to the age and sex, not a significant difference was observed (Table 3).
Out of a total of 504 isolates from male adults, 45 (9%) were resistant to Amikacin, 140 (28%) were resistant Ciprofloxacin, 185 (37%) were resistant to Cefotaxime, 174 (34%) were resistant to Ceftriaxone, 34 (7%) were resistant to Sulzone, 140 (28%) were resistant to Fosfornycin and 25 (6%) were resistant to Meropenam. Among 28 male children, the maximum resistance was observed to Ciprofloxacin (Table 3) out of 442 isolates from female adults 39 (9%) were resistant to Amikacin 84 (19%) were resistant to Ciprofloxacin, 78 (18%) were resistant to Cefotaxime, 151 (34%) were resistant to Ceftriaxone, 28 (6%) were resistant S ulzone (Cefapeozone+Sulbactum), 145 (33%) were resistant to Fosformycin and 11 (2%) were resistant to Meropenam. On the whole, the maximum resistance was observed from the male adults isolates against Cefotaxime (n=185, 37%) and in the case of isolates from the female adults to Ceftriaxone (n=151, 34%) .
Collectively, we can say that maximum resistance was observed when target cells were subjected to antimicrobial susceptibility testing against third generation Cephalosporins i.e. Ceftriaxone and Cefotaxime. The most effective antibiotic in the isolates from the male patients was Sulzone (Cefapeozone+Sulbactum) i.e. 465 (92%), while in the case of isolates from female patients it was Meropenam i.e. 414 (94%) (Table 3).
Table 1: Age and Gender wise distribution of clinical isolates of Pseudomonas aeruginosa
Total No. of samples N
2800 n (%)
Positive for Ps. aeruginosa
1008 (36%)
Male adult(>12 years)
504 (50%)
Male children (0-12 years)
28 (3 %)
Female adult (>12 years)
442 (44%)
Female children (0-12 years)
34 (3%)
Table 2: Resistance of Pseudomonas aeruginosa from different clinical specimens toantibiotics determined by Kirby-Bauer disc diffusion method
%=Percentage,n= Individual type of sample,N=Total number of sample,AK= Amikacin (R =>22 mm),CRO= Ceftriaxone (R=>21 mm),CTX=Cefotaxime (R=>22 mm),SCF= Sulzone (R= > 20 mm) (Cefapeozone+Sulbactum), MEM=Meropenam (R= >18 mm), CIP=Ciprofloxacin (R= > 21mm),FOS=Fosfomycin (R= > 18mm ),µgms= micro grams, S= sensitive
Table 3: Age and Gender wise sensitivity of Pseudomonas aeruginosa from different clinical specimens to antibiotics determined by Kirby-Bauer disc diffusion method
% =Percentage,n= Individual type of sample,N=Total number of sample,AK= Amikacin (R =>22 mm),CRO= Ceftriaxone (R=>21 mm),CTX=Cefotaxime (R=>22 mm),SCF= Sulzone (R= > 20 mm) (Cefapeozone+Sulbactum), MEM=Meropenam (R= >18 mm), CIP=Ciprofloxacin (R= > 21mm),FOS=Fosfomycin (R= > 18mm ),µgms= micro grams, S= sensitive
DISCUSSION:
Pseudomonasaeruginosa is a leading Gram-negative pathogen thatcauses nosocomial infections, accounting for 20% of pneumoniaand 16% of urinary tract infections according to recent datafrom the National Nosocomial Infections Surveillance System [1].
Optimisation of therapy against Pseudomonas aeruginosa starts with the initial empirical antibiotic choice. Surveillance data and hospital or unit antibiograms may inform this decision, although individualisation of the initial regimen on the basis of prior antibiotic use and prior isolation of resistant pathogens may be more important. Combinations of antibiotics are often required empirically, and "combination antibiograms" may need to be developed for this purpose. Preliminary data suggest that extending the time over which a dose of antipseudomonal beta-lactam antibiotics is infused may improve clinical outcomes; however, this idea remains to be confirmed in randomised trials. For example Moody et al in 1972 showed that some of the Pseudomonas speciesother than Pseudomonas. aeruginosa were resistant to a number of antibiotics.Among these were antibiotics that are in general use for P.aeruginosa infections. Such differences in antibiotic susceptibilities emphasise the necessity for careful speciation of this groupof microorganisms to assure proper epidemiological documentationof colonisation and infection, as well as to ensure therapywith an antimicrobial agent to which the organism is susceptiblein vitro. The role of direct susceptibility testing in aiding more rapid initiation of appropriate antibiotic therapy is also being studied. When identification and susceptibility testing is complete, the antibiotic regimen for infections due to Gram-negative pathogens can be "fine tuned." On some occasions, this fine tuning necessitates the introduction of "salvage" antibiotics, such as Colistin or Tigecycline; on others, it necessitates de-escalation and early termination of therapy. The lack of new antibiotic options against gram-negative pathogens underscores the need for optimisation of current therapies and prevention of the spread of these organisms.
In 2008 Javiya etal reported the highest number of Pseudomonas infections was found in urine, followed by pus and sputum. Pseudomonas species demonstrated marked resistance against monotherapy of penicillins, cephalosporins, fluoroquinolones, tetracyclines and macrolides. Only combination drugs like Ticarcillin + Clavulanic acid, Piperacillin + Tazobactum, Cefoperazone + Sulbactum, Cefotaxime + Sulbactum, Ceftriaxome + Sulbactum and monotherapy of Amikacin showed higher sensitivity to Pseudomonas infections; however, the maximum sensitivity was shown by the Carbapenems.
Our study was therefore carried out, using Kirby-Bauer method [2], to determine the antibiotic susceptibility patterns of Pseudomonas aeruginosa isolates from in-patients and out-patients attending the microbiology section of Burgor Anklesaria Hospital’s pathological laboratory between January 2008 and September 2008. The isolation rate of Pseudomonas aeruginosa in clinical specimens was found to be 36%, with the highest occurrence of 403 (40%) in urine samples followed by 258 (26%) occurrence in ear swabs. The susceptibility pattern showed that 85% were sensitive to Meropenam and 84% to Sulzone (Cefapeozone+Sulbactum). The isolates from the male patients showed almost equal resistance to all the antibiotics tested, as in case of isolates from the female patients, most especially Ceftriaxone and Cefotaxime. However, no consistent antibiotic susceptibility pattern could be established for this pathogenic bacterium based on sources.
Treatment of Pseudomonas aeruginosa is a challenge because resistance limits dramatically therapeutic options. In this review, we discuss data of in vitro susceptibility for the management of infections caused by Pseudomonas aeruginosa. Currently, published data from Pakistan are limited, and there are no such randomised clinical trials involving the treatment of infections caused by multidrug resistant Gram-negative rods. At present newer antimicrobial agents active against multidrug resistant bacteria like Pseudomonas aeruginosa are not available or under investigation.
CONCLUSION:
Antibiotic resistant organisms appear to be biologicallyfit and are capable of causing serious, life-threatening infectionsthat are difficult to manage because treatment options are limited.This increase in the prevalence of drug resistant pathogensis occurring at a time when the discovery and development ofnew anti-infective agents is slowing down dramatically.
The Pseudomonas aeruginosa species isolated from patients in the Microbiology section of Burgor Anklesaria Hospital’s pathological laboratory, Karachi, Pakistan were tested in vitro for antibacterial susceptibility of currently available and commonly prescribed drugs. Meropenam and Sulzone were the two antibiotics found to be the most susceptible against this pathogen. The emergence of multidrug resistant (MDR) Pseudomonas aeruginosa is a challenging clinical problem. This study investigated the pattern of antibiotic resistance to test antibiotics and helps us in determining the role of combination therapy in its management. The results of this study suggest that use of triple antimicrobial therapy (Meropenam, Sulzone and Amikacin) can be a useful alternative treatment for multidrug resistant (MDR) Pseudomonas aeruginosa infection in certain circumstances.
Day-case surgery is of great value to patients and the health service. It has rapidly expanded as a cost-effective and resource-conserving surgical intervention. However, the ability to deliver a safe and cost-effective general anesthetic with minimal side effects and rapid recovery is demanded in a day-case surgery unit. Pain and emesis are the two major complaints after day case surgery. Opioids are the agents of choice for severe pain. However, this class of analgesics is associated with dose-dependent adverse effects such as PONV, sedation, respiratory depression, resulting in delayed discharge or prolonged hospital stay. Non-opioid analgesics, e.g. acetaminophen and non-steroidal anti-inflammatory drugs (NSAIDs), are often used alone or as adjuncts to opioids because of fewer adverse effects compared to opioids alone. However, NSAIDs also have side effects [1]. Lornoxicam is a new NSAID that belongs chemically to oxicams, a chemical class including piroxicam and tenoxicam. Lornoxicam is a potent inhibitor of cyclo-oxygenase and the only oxicam with a 15 times shorter half-life than piroxicam and tenoxicam [2]. In addition, lornoxicam can be given by I.V. route. Lornoxicam has a better safety profile than diclofinac and naproxen with regards to renal and hepatic function tests. In addition to better GIT tolerability compared to selective COX2 inhibitors; it is completely metabolized to inactive metabolites [2,3]. Lornoxicam has been successfully used in prevention and treatment of postoperative pain. However, evaluation of the perioperative analgesic efficacy of lornoxicam in day-case surgery has not yet been studied. This randomized, double blinded study was designed to compare the quality of perioperative analgesia as well as side effects of IV lornoxicam versus fentanyl in patients scheduled for minor to moderate day-case ENT surgical procedures. Materials and Methods: Male or female patients (aged 18-60 yr) were eligible for inclusion in the study. After obtaining the approval of the Hospital Research & Ethical Committee and patient’s informed consent, patients were randomized into three groups of ASA class I and II, scheduled to undergo minor to moderate day-case ENT surgical procedures e.g. tonsillectomy, excision of ENT lesion (e.g. vocal cord nodules and cysts), polypectomy and endoscopic sinus operations were enrolled in this randomized, double blinded study between May and December 2008. Exclusion criteria were patients with body mass index (BMI) > 30%, drug or alcohol abuse, and known allergy to NSAIDs, paracetamol or any contraindications for opioid use. The protocol was similar for all patients. Prior to surgery, patients were educated in the use of the 10 – point visual analog scale (VAS) for pain assessment (0 = no pain to 10 = maximum pain). No premedication was given. In the holding area, an IV cannula was inserted and an IV infusion of Lactated Ringer’s was started. HR, MAP and SpO2 were recorded before induction (baseline value). Since fentanyl is a clear fluid while lornoxicam is yellow, the pharmacist prepared, covered and coded the medications in two coded envelopes for each patient. One envelope containing lornoxicam 8mg (L8), 16 mg (L16) or placebo to be given half an hour before induction of anesthesia and another envelope with fentanyl 100 µg (F) or placebo to be given with induction i.e. each patient received either IV (F), (L8) or (L16).The medications were administered by a different anesthetist, who was not involved in the study. Anesthesia was induced with propofol 2 mg/kg IV followed by cisatracurium 0.15 mg/kg IV to facilitate orotracheal intubation. After tracheal intubation, the patients were ventilated to normocapnia with sevoflurane (2-3% end tidal) in 50% oxygen in air. All patients received IV 1 gm of paracetamol after induction and were monitored with ECG, MAP, SpO2 and EtCO2. Supplementary fentanyl 0.5 µg/kg was given IV as required in all groups (if > 20% increases in MAP or HR than preinduction values in presence of adequate muscle relaxation). At the end of surgery, muscle relaxation was reversed and extubated. In the post-anaesthesia care unit (PACU), the time from extubation to spontaneous eye opening was compared between the groups. The patients were monitored with ECG, SpO2, MAP, respiratory rate (RR), VAS and sedation score (0 =awake, 1=mild sedation, 2=sleepy but arousable, and 3 = very sleepy) at 0.5,1, 2, 3 and 4 hours by an anaesthetist, who was not aware of the study drug used. Intramuscular (IM) injection of meperidine 1 mg/kg was administered as a rescue analgesic at VAS > 4. The total amount of meperidine required during first 4 hrs postoperative was recorded. The time of the study drugs injection was recorded after decoding their codes. The first need for rescue analgesic was recorded as the time from the administration of the study-drug and the administration of meperidine. The incidence of PONV or any adverse event was recorded. The PACU staff was not aware of the study drug given. The results were analyzed using SPSS version 16. Sample size was 35 patients for each group in order to detect a 20% change in HR and MAP. The α-error was assumed to be 0.05 and the type II error was set at 0.20. Numerical data were expressed as mean ± SD. The groups were compared with analysis of variances (ANOVA). The VAS pain scores were analyzed by Mann-Whitney U test. Categorical data were compared using the Chi square test. P value of 0.05 was used as the level of significance. Results 105 patients aged between 18 and 52 yr were enrolled in the study. There were no significant demographic differences between groups (Table 1). HR and MAP were significantly higher at 10 and 20 minutes after induction of anaesthesia in group L8 compared to groups F and L16 (P < 0.05) (Fig. 1,2). The number of patients with inadequate intra-operative analgesia was significantly higher in group L8 compared to groups F and L16 (Fig 3). In PACU, 40 minutes postoperatively, HR, MAP and VAS were significantly higher in groups F and L8 (Fig 4,5,6). The first analgesic requirement time was significantly longer in group L16 compared to groups F and L8 (Table 2). The mean sedation scores in PACU were insignificantly higher in groups F and L8 compared to group L16 (Table1). While the incidence of PONV was significantly higher in groups F and L8 (p<0.05) (Table 1). Table 1: Demographic characteristics, eye opening time, incidence of postoperative nausea and postoperative sedation score:
F
L8
L16
P
Age (year) - mean (range)
31 (18-52)
32 (18-51)
31 (20-49)
0.129
Sex F/M
Oct-25
Oct-25
Sep-26
0.695
Weight (Kg)
72.7±11.7
74.1±11.3
75.3±9.9
0.402
Height (cm)
166.2±14.7
169.4±11.9
161±19.5
0.482
ASA physical status I/II
23-Dec
22/13
25-Oct
0.312
Duration of surgery (min)
58.8±21.8
59.6±21.4
56.9±23.3
0.675
Time to eye opening (min)
7.2±3.1
6.4±1.2
3.7±1.6*
0.019*
Postoperative nausea
9/35
7/35
3/35*
0.002*
Postoperative sedation score (0 – 3)
1.7±0.6
1.9±1.1
1.4±0.6
0.357
Data are expressed as mean ± SD or number of patients* Significant difference (P < 0.05). NS: Non significant.- Time to eye opening is the time from extubation to spontaneous eye opening.Table 2: Perioperative analgesic requirements and time to first postoperative analgesic requirement (mean ± SD)
F
L8
L16
P
Intra-operative fentanyl supplementation (µg)
45.5 ± 13.2
67.8 ± 16.4*
43.1 ± 10.2
0.012*
Time of 1st postoperative rescue analgesic (min)
94.3 ± 33.4
101.6 ± 51.5
223.9 ± 62.3*
0.0002*
Postoperative meperidine rescue (mg)
76.3 ± 12.5
80.5 ± 11.7
39.9 ± 7.6*
0.001*
-Data are expressed as mean ± SD.* Significant difference (P < 0.05). NS: Non significant.-Time of 1st postoperative rescue analgesic is the time elapsed between the administration of the study drug and the administration of an analgesic postoperatively. Fig 1: Intra-operative changes in heart rate in groupsFig 2: Intra-operative changes in MAP in groupsFig 3: Number of patients requested perioperative analgesic supplementationFig 4: Changes in heart rate in PACUFig 5: Changes in MAP in PACU:Fig 6: Changes in VAS in PACUDiscussion: The use of an opioid, even a short acting one can be associated with adverse effects, which may not be acceptable for patients scheduled for day case surgery. For this reason, it was suggested to substitute an opioid with a non-opioid analgesic for postoperative pain control. The use of a NSAID is associated with adverse effects [1]. Lornoxicam has been successfully used in the prevention and treatment of postoperative pain. It has been shown to be as effective as morphine [4], meperidine [5] and tramadol [6]. To the best of our knowledge, this is the first study to compare the perioperative analgesic efficacy of lornoxicam to fentanyl in patients undergoing day case ENT surgery. We gave Lornoxicam half an hour before induction of anesthesia as the time taken to reach peak plasma concentration (Tmax) was determined to be 0.5 h [7]. During the operative procedure, HR and MAP were significantly higher in group L8 compared to group F and L16. While in PACU, patients in groups F and L8 had higher HR, MAP and VAS score in the early postoperative period compared to patients in group L16. This may be due to inadequate analgesic effect of L8 and the shorter plasma half life of fentanyl compared to L16. The analgesic efficacy of L16 might be attributable to inhibition of cyclo-oxygenase (COX1) and (COX2) activity [2], release of endogenous dynorphin and β-endorphin [5], decrease in peripheral and central prostaglandin production [8] as well as exertion of some of its analgesic activity via the central nervous system [9]. Lornoxicam has a more potent anti-inflammatory and analgesic effect than other oxicams as well as a shorter half life, which decreases the incidence of side effects of drugs with long plasma half life [10]. Arslan and colleagues reported decreased opioid need, PONV and postoperative pain scores when 16 mg of lornoxicam was administered after thyroidectomy [11]. While Xuerong and colleaguessuggested that the increase of postoperative morphine requirements induced by intra-operative administration of fentanyl could be prevented by ketamine or lornoxicam [12]. Rawal reported that NSAIDs are effective as the sole analgesic in a high proportion of cases of mild to moderate pain and it is more convenient to give these drugs by the IV route rather than by IM or rectal administration [13]. The analysis of pain intensity differences was complicated by the fact that many patients postoperatively were asleep at the time their pain assessments were due which may be attributed to effect of opioid and anesthetic medications used. To minimize any missing data we used time to the first dose rescue analgesia (based on changes in hemodynamic data) to evaluate pain intensity differences from baseline. L16 was well tolerated in this study, and was associated with a significantly lower incidence of adverse events than F and L8 which could be due to the opioid side effects in both groups. Norholt and colleaguessupported our results as they reported that, in terms of common acute adverse events, lornoxicam appeared to possess a higher benefit/risk ratio compared with morphine [4]. Zuurmond et al reported that, there is good evidence that avoidance of opioid virtually abolishes the PONV that preclude oral intake of fluids after surgery [14]. In our study, nausea developed in 25.7% of patients in group F, 20% in group L8 but only 8.6% in group L16 who received the least rescue opioid analgesia. Regarding bleeding abnormalities, Hodsman et al reported extensive bleeding required reoperation on two diclofenac group patients submitted to abdominoperitoneal resection of the rectum [15]. In our study no abnormal bleeding was reported by ENT surgeons in any of the study patients. In agreement with our results, Ilias et al[16], Trampitsch et al[17] and Karaman et al [18] used lornoxicam and they did not detect problems with surgical bleeding, bleeding time, blood transfusion requirement or postoperative bleeding. Stroissnig et al reported that overall, in healthy adult volunteers, oral doses of lornoxicam up to 70 mg have been well tolerated, and there have been no effects on vital signs, urine analysis parameters or clinical serum biochemistry [19]. In our study, none of the patients receiving study drugs experienced severe gastric discomfort, needed rescue antiemetic medication or required admission because of poor pain control. Previous studies used lornoxicam for reduction of postoperative opioid consumption but none of them had studied the intra-operative use of lornoxicam. So, we selected certain type of surgical procedures which might be suitable to use lornoxicam as a sole intra-operative analgesia. The adjunctive use of acetaminophen may have additive analgesic efficacy to lornoxicam because of its intrinsic opioid-sparing activity. Measurement of serum catecholamine would have been useful. These could be considered as a limitation for the present study. Conclusion: Intravenous 16 mg lornoxicam with the present study design was comparable to 100 µg fentanyl as intra-operative analgesia but more effective than fentanyl in preventing early postoperative pain in mild to moderate ENT surgical procedures. Intravenous lornoxicam 8 mg was not satisfactory as a sole intra-operative analgesia. The overall incidence of adverse effects of lornoxicam was lower than that of fentanyl.
The Foundation Programme1,2,3 is a 2-year, ubiquitous, vocational curriculum undertaken by newly qualified doctors wishing to proceed onto speciality training in the United Kingdom (UK). Since 2006, Foundation Year Trainees in the UK have been required to complete one clinical audit during their two year programme. We review the practice of audit and doctors’ attitudes to the difficulty in performing audits at a National Health Service (NHS) hospital trust comprising three hospital sites in the South East of England. The Foundation Programme demands that Foundation Year Trainees are able to consider the relevance of clinical audit and describe the audit cycle with regard to developing patient care, clinical governance and risk management. They are expected to undertake a clinical audit and recognize how it relates to the improving clinical standards and addressing clinical governance1. Clinical audit can be defined as the processof reviewing the delivery of care to identify deficiencies sothat they may be remedied4. Whilst it was initially used in assessing medicalpractice against local standards, audit ‘has evolved conceptuallyas a mechanism through which evidence-based guidelines can beintroduced into routine clinical practice’5. Apart from fulfilling the requirements of the syllabus, reasons for audit include professional education and the opportunity to improve patient care6. Barriers to audit might include: disagreement amongst professionals as to what constitutes a good audit5;organisational impediments; and a lack of resouces6. This study therefore sets out to investigate the level of audit activity in a hospital trust in South East England amongst all Foundation Year Trainees. Importantly it will also assess doctors’ attitudes and views towards the audit process and perceived or actual barriers to their completion. METHOD Questionnaires were sent to all Foundation Year 1 (F1s = 63 in total) and Foundation Year 2 (F2s = 56 in total) Trainees in the trust (119 doctors). The study group involved trainees in the Foundation Programme from 31st July 2007 to 30th July 2008. Doctors who had been transferred out of the trust were not included in the study. There were no doctors who had transferred into the trust and were in the Foundation Programme. A study representative at each of the 3 hospital sites was tasked to distribute the questionnaires. Trainees were asked to complete the questionnaires in an informal setting and to return them directly to the site representative. The study environment was variable, and questionnaires were distributed and completed on the wards or at group teaching sessions. Participants were given the choice of completing and submitting their form immediately, or submitting it at a later date. Data collection was commenced 11 months after the trainees had commenced employment in the trust and concluded after 2 weeks. This was invoked as many trainees were clearing annual-leave requirements towards the end of their hospital posting, and the consensus that very few audits would be officially completed at that stage of training in the summer. Questions were drawn from previous studies to the barriers to audit in our Trust. In the first section of the questionnaire, participants were asked about: “the number of all audits attempted or applied for”; “the number of new audits attempted or applied for”; “the number of audits completed and presented so far”; and “the number of audits started but never completed”. The second part of the questionnaire assessed subjective opinions on barriers to completing audits. Participants were asked to rate the following 5 statements on a comparative scale of 1-5 (1 being “strongly disagree” and 5 being “strongly agree”): “The audit department is helpful in approving audits”; “senior staff are helpful in involving me in audits”; “I can complete audits within official working hours”; “most audit opportunities are in my area of interest”; “most audit opportunities are of clinical value”. Results were collated and tabulated and presented at local meetings where feedback was received. RESULTS Ninety-two out of a possible 119 (77.3%) Foundation Year Trainees completed the questionnaire (57/63 - F1s, 35/56 - F2s). There were 106 total attempts at audit for the F1 trainees and 65 total attempts for the F2s. Most trainees had attempted 1 or 2 audits in their respective year (42 F1s at 73.7% and 23 F2s at 65.7%). 5 F1s (8.8%) and 3 F2s (8.6%) had neither attempted nor applied for any audits. Ten F1s (17.5%) and 9 F2s (25.7%) had attempted more than 2 audits (Table 1). Table 1: Number of audits attempted by trainees
Number of all audits applied for or attempted
F1s
F2s
Number
Percentage (%)
Number
Percentage (%)
0
5
8.8
3
8.6
1
21
36.8
17
48.6
2
21
36.8
6
17.1
3
3
5.3
3
8.6
4
2
3.5
5
14.3
5
4
7.0
0
0
6
1
1.8
0
0
7
0
0
1
2.8
Total
57
100
35
100
The results for the total number of completed audits (i.e. an audit that included data collection, analysis and formal presentation to the respective department) are summarized in Table 2. For F1s, 32 out of a total 106 attempted audits were completed (30.2%), this percentage rising for F2s (38/65; 58.5%). Thirty-three (57.9%) F1s and 10 F2s (28.6%) failed to complete any audit, with a number able to complete one audit presentation in the year: 18 F1s (31.6%) and 16 F2s (45.7%). Table 2: Number of audits completed by trainees
Number of completed audits
F1s
F2s
Number
Percentage (%)
Number
Percentage (%)
0
33
57. 9
10
28.6
1
18
31.6
16
45.7
2
5
8.8
6
17.1
3
0
0
2
5.7
4
1
1.7
1
2.9
Total
57
100
35
100
With respect to new and original audits attempted by trainees, this was achieved by 66.7% of F1s and 74.3% of F2s (Table 3). There was no formal data on the number of audit loops being closed. Table 3: Number of new audits designed by trainees
Number of new audits attempted or applied for
F1s
F2
Number
Percentage (%)
Number
Percentage (%)
0
19
33.3
9
25.7
1
25
43.9
19
54.3
2
9
15.8
3
8.6
3
1
1.75
2
5.7
4
1
1.75
2
5.7
5
2
3.5
0
0
Total
57
100
35
100
With regard to barriers to completion of audits (Table 4), results were notably equivocal for “helpfulness of the audit department and senior staff” (both averaging 3.1 on the comparative scale of 1-5), and “the clinical value of the audits available” (mean score 3.2). The mean score for “completing audits within official hours” was 2.1 with a similar trend observed in “the audits available in an area of interest” (mean score 2.6). Table 4: Trainees’ experiences with audit
Statement
Score
Total responses
1
2
3
4
5
Audit department is helpful
Percentage %
9.1
12.5
44.3
22.7
11.4
100
Numbers
8
11
39
20
10
88
Mean score
0.1
0.3
1.3
0.9
0.6
3.1
Senior staff are helpful
Percentage %
15.4
20.9
23.1
22.0
18.7
100
Numbers
14
19
21
20
17
91
Mean score
0.2
0.4
0.7
0.9
0.9
3.1
Audit completed in working hours
Percentage %
46.2
22.0
16.5
8.8
6.6
100
Numbers
42
20
15
8
6
91
Mean score
0.5
0.4
0.5
0.4
0.3
2.1
Audits in the area of interest
Percentage %
18.7
30.8
25.3
17.6
7.7
100
Numbers
17
28
23
16
7
91
Mean score
0.2
0.6
0.8
0.7
0.4
2.7
Audits have clinical value
Percentage %
7.7
18.7
30.8
34.1
8.8
100
Numbers
7
17
28
31
8
91
Mean score
0.1
0.4
0.9
1.4
0.4
3.2
¶Key: 1= strongly disagree; 2=disagree; 3 = equivocal; 4 = agree; 5 = strongly agreeNB: Some forms were incomplete, and therefore responses may not add up to 92. CONCLUSIONS Although audit is well established to be beneficial in improving clinical practice7, this study suggests that trainees under-perform against the curriculum of the Foundation Programme. Historically, the level of audit activity amongst doctors has been low; for example, McCarthy (1997) demonstrated that whilst doctors see the conceptual value of audit, approximately one-third only had presented their data at a pertinent audit meeting8. These results have been replicated in numerous other studies9,10,11. We believe that this data-set is the first available for junior trainees who have undertaken the Foundation Programme curriculum, with a good response rate of 77.3%, and incorporates the contractual pressures invoked by a European Working Time Directive (EWTD)-compliant Rota12,13. While the results show that the majority of respondents (>90%) had attempted an audit, most significantly the majority of audits that were started were not completed. A large percentage of F1s (57.9%) and F2s (28.6%) failed to complete an audit at all. Similar numbers have been reported, even among senior pediatric trainees at registrar level, where one study demonstrated that whilst audit activity was above 90%, only 16% had completed the audit cycle14. One possible explanation is that many trainees appear to have a sub-optimal comprehension about audit and its process. Our consensus was that some trainees attempted audits that were too large or unmanageable, or even of insufficient quality, in striving to achieve a peer publication from their work. When realized that the publication value is poor, or that the audit design is flawed, many trainees lose interest and fail to complete. Another concept highlighted by this study is confusion over the definition of a “completed audit”. For consideration of completion of an audit, a trainee has to demonstrate both the ability to collect the data and present it to among his peers in a formal meeting. This generally amounts to completion of 5 out of the 6 stages of the audit loop15. Surgical morbidity and mortality presentations had been considered audit by some trainees, as they were termed by the trust as a “surgical audit”. However, the overall clinical consensus is that they are not audit but formative educational meetings because no systemic local or national standards were employed for comparison. This poor understanding of audit has been well described previously16. Potential barriers to the completion of audit include some of the issues raised in this study. In this sample, doctors were equivocal about whether the barrier was the audit department or lack of senior support. This reflected the variability of experience as well as the lack of teaching of the purpose and methods of audit in the undergraduate curriculum. They were also equivocal about the clinical value of audits they had completed. By comparison, a study in Leeds showed that less than half of the 232 respondents were aware of subsequent change in clinical practice and 27% felt it was “a waste of time”7. However this study did not focus on the junior doctor in the beginnings of their postgraduate training. Trainees felt that an additional barrier to audit completion included difficulty in completing audits within their working hours. All Foundation Year Trainees in the trust were working to a EWTD-compliant Rota during the year, where trainees did not exceed 48 hours a week of on-site hospital clinical duties. Trainees also found it difficult to undertake audits in their area of clinical interest. Although part of the reason is circumstantial - the Foundation Year Programme mandates that trainees rotate around various core specialties - this may also reflect a lack of understanding of what the audit cycle actually incorporates, and how it is not formal research in itself15. Approval of audit studies was also thought to be problematic because such meetings only took place monthly with a pre-determined agenda, and consequently, this meant that approval might take several months to obtain for trainees who would actually be based in the trust for no more than 12 months in 3 different specialty departments. There were a number of limitations of the study, one being the small sample size. Secondly, in asking trainees to rate each of the six statements from 1 to 5, trainees who did not complete audits tended to score 3 (neither agree or disagree), and as the results above show, they represented a considerable proportion. A larger sample size and a semantic differential scale (rating responses between 1 and 7) might have been more discerning. The fact that some trainees may have included “audits” which on reflection did not meet the criteria for inclusion was not only interesting but may also have distorted results. Finally, audits that involved joint effort among trainees, but were presented only by one of them in the absence of the others were still regarded by some trainees to be “completed and presented” by all of them. This study has highlighted a number of issues which need to be addressed for clinical audits to be successfully completed during the Foundation Programme. The authors believe that poor completion rates are most probably the result of poor understanding of audit. Potential solutions include teaching medical students concepts of audit; giving structured teaching early in the Foundation Programme; instituting regular audit meetings; incorporating audit as part of contracted working hours; defining audit more clearly among trainees and clinical staff and encouraging more cooperation and integrative liaison with the audit department to process audit proposals quickly and efficiently. Additionally, doctors’ contractual pay-bandings should reflect any out-of-hours work undertaken on audits that improve clinical governance for their Trusts. However, in spite of all these considerations, we speculate that because trainees are only in each post for no more than 4 months during their foundation years, and with the restriction of working hours, the expectation of foundation year trainees to have undertaken and properly understood an audit cycle, implemented change and closed the audit loop is unrealistic. It would be more helpful to the trusts and trainees for audits to be part of the specialty training programme onwards, where trainees stay in a department for a longer time even as they move from one team to another. Further studies might consider in detail the difficulties in each step of the audit cycle15 and explore: Foundation Trainees’ use of the audit department; guidance from senior members of staff; and perceived benefits in clinical practice. Ultimately, audits must implement change17 and all truly successful clinical audits should aid in some way to achieving our fundamental goal in medicine; that being the best clinical practice and best quality of care.
Implantation of prosthetic mesh in repair of different hernias has gained a global acceptance and popularity. It is thought to be a potent safeguard against recurrence of hernias 1, 2.The use of prosthetic mesh in different types of hernias has brought a phenomenal change in the out look of hernia patients all over the world 3. Today, an ever increasing number of hernias are repaired by implanting prosthetic meshes either by conventional open method or by laparoscopic approach 4. Beside its well known advantages and global acceptance in every day hernia surgery, a number of complications are thought to be associated with the use of mesh in different types of hernias 5-15. We present our experience of mesh related complications in different open hernia repairs and their management in this study.MARERIALS AND METHODSIt’s a descriptive observational study over 5 years during which a total number of 1008 patients with different types of hernias were repaired electively in a teaching hospital as well as in private hospitals by the same surgical team. Of these, 638 (63.29 %) hernias were repaired by implanting prolene mesh of different sizes depending on the size of the defect. A drain was left in place in selected cases .The patients were followed up to a period of three years after discharge from the hospital. The follow up visits were scheduled at 1 month, 6 months, and then yearly. Of the total patients , 432(67.71%) were followed up to three years while 159 (26%) patients were lost in the follow up from day of discharge from the hospital. Another 47 patients attended follow up up to 2 years only and then disappeared. Sixteen of these patients continued to complain about chronic pain and foreign body sensation up to two years and then they did not return while 4 of these patients developed recurrent hernia in one year time but they were lost in follow up. The data of every patient is recorded on a proforma and their follow up records are maintained. The variables studied included immediate, early and late post-operative complications in addition to the demographic details. The statistical analysis of the data is done on SPSS version 12.RESULTSThe mean age of the patients is 41 years with a range of 73 years and a STD of 19.089. There is a male dominance (N=531, 83%) over females (N=107, 17 %). The commonest type of hernia in this series is inguinal hernia (n=518, 81%) followed by Para-umbilical hernia (n=83, 13 %). Distribution of different varieties of hernias among male and female study population is shown inTable-I. Table-1. Frequency of hernias and distribution among males and females
Type of hernia
Total
Inguinal
Para- umbilical
Incisional
Epigastric
Male
518
4
3
6
531
Female
0
79
26
2
107
Total
518
83
29
8
638
Of the total number, 34 (5 %) hernias were recurrent hernias including 21 inguinal hernias, 11 Para-umbilical hernias and 2 Incisional hernias. The patients were operated after preliminary investigations and medical fitness. All the patients were operated by open conventional technique regardless of the type of hernia. Total duration of operation is shown in Figure -I with maximum patients (467, 73%) operated with in 60 minutes. Figure-I. Total duration of operation: Various early complications during the same admission occurred in 9 % (n=55) of the patients. Their distribution according to the type of hernia is displayed inTable- II. Table-II Type of hernia * Complications during same hospitalization Cross tabulation
Type of hernia
Complications during same hospitalization
Total
Wound infection
Reaction
Mechanical failure
Seroma
Pain
Mesh infection
Hematoma
Inguinal
14
3
4
7
1
1
3
518
paraumbilical
5
1
2
3
0
3
3
83
Incisional
0
0
0
1
0
2
1
29
Epigastric
0
0
0
0
0
1
0
8
Total
19
4
6
11
1
7
7
638
Wound infection has an alarmingly high incidence in our series (n=19, 3 %). Most of these infections are superficial and effectively controlled by intensive antibiotic therapy so that the failure of repair is saved and mesh rejection prevented effectively. Four of recurrences occurred during 2 years follow up but patient discontinued follow up afterwards. Remaining 07 recurrences occurred between 24 to 36 weeks. The complications observed during the follow up period of up to three years in different hernias are shown in Table-III.Table-III Type of hernia * Late Complications after discharge Cross tabulation
Complications after discharge
Total
Type of hernia
Pain
Recurrence of hernia
Thickening of spermatic cord
Testicular atrophy
Inguinal
10
4
7
2
518
paraumbilical
2
7
2
0
83
Incisional
2
0
0
0
29
Epigastric
1
0
0
0
8
Total
15
11
9
2
638
A remarkably low incidence of wound infection in para-umbilical and incisional hernia is attributable to the placement of suction drain which prevents hematoma formation and secondary infection. Seven (2%) recurrences occurred in para-umbilical hernias where suction drain did not work. Mesh infection with massive reaction , although, treated conservatively in 5 patients with vigorous antibiotic therapy led to the formation of a weaker scar which later on gave way and recurrence of hernia occurred. Follow up was not 100% and about 26% patients were lost in the follow up. Majority of the patients (n=457, 90 %) were discharged within 4 days while patients who were complicated had a longer stay up to 15 days (P <0.001). Late complications were mostly chronic pain and foreign body sensations with 2 cases of unilateral testicular atrophy. DISCUSSION A number of non-infectious and infectious complications are attributed to the use of mesh in the repair of most of the hernias5, 13, 16. The type of mesh as well as their composition seems to affect complications following their use and specific materials are related to specific complications. We present 638 patients of different types of hernias repaired by implanting polypropylene mesh of varying sizes depending upon the size of defect. Prolene meshes are monofilaments, non-absorbable, inert, sterile and porous synthetic materials commonly used for this purpose. The use of mesh in hernia repair has brought a phenomenal change in the overall outcome of hernia repair especially in terms of recurrence of hernia 17. We experienced wound infection as the commonest complication in our series (n=19, 3%) and this was more so in the inguinal hernias. Most of the wound infections are superficial and very easy to control on conservative measures. On the contrary deep seated mesh infections are always dreaded complications and if not treated vigorously can lead to total failure and rejection of prosthetic mesh. A number of similar studies have reported an increased infection rate in mesh hernia repair testifying our results 18-28. Grant AM 29, however claims no difference in the incidence of infection between mesh and non-mesh repair of groin hernias. A severe local reaction occurred in 4 (0.62%) patients which resolved in few days without any consequences. Seroma and hematoma occurred in 11(2 %) and 7(1.09%) patients respectively. Only 3 seromas and one hematoma needed evacuation. We report a recurrence of 11(2 %) hernias of which 4 are inguinal and 7 are para-umbilical hernias. All of the recurrent para-umbilical hernias had severe reaction and wound infection in the post-operative period which was effectively controlled by vigorous antibiotic therapy and local wound care. There is probably a weaker scar after resolution of the infective process which resulted in recurrence. A significantly low recurrence rate in inguinal hernias in our study (0.77%) is consistent with the results of other similar reports 30-32. Chronic pain and a foreign body sensation poses a real problem and though it occurred in only two cases but a similar study by Bay-Nielsen M 33 claims 22.9% study population having chronic pain and more so in the adult males. CONCLUSION Although mesh repair is an efficient method of hernia repair, a number of complications may be associated and can lead to failure. An aggressive antibiotic therapy and wound care may control even massive infections.
The acquired immunodeficiency syndrome (AIDS) was first recognized among homosexual men in the United States in 19811,2. While initially limited, infection with the human immunodeficiency virus (HIV) has immensely increased over the past two decades to become the biggest epidemic of the twentieth century. However, we have witnessed dramatic improvement in prevention of disease progression and long-term survival in the era of Highly Active Anti Retroviral Therapy (HAART).
Apart from biological factors associated with the virus and host which play a role in the transmission and progression of HIV infection, several demographic and social variables have been studied and described in different studies worldwide. Understanding the variety of non-biological factors and behavioral patterns which can affect care and prognosis of HIV patients gives us the opportunity to design non-pharmacological interventions and where possible, to facilitate better care for our HIV positive population.
BACKGROUND:
J.E. Wood clinic of Pennsylvania Hospital in Philadelphia is a teaching outpatient care facility where Internal Medicine residents of Pennsylvania Hospital acquire their ambulatory care experience under supervision of teaching attendings. We have once a week clinic sessions dedicated to the care and follow-up of HIV/AIDS patients under close supervision of Infectious Disease specialists. Our patients have diverse socio-economic, educational and stages of HIV infection.
OBJECTIVE:
We aimed at finding out basic understanding of HIV infection, degree of awareness regarding the ongoing treatment and reasons behind irregular follow-up visits of our HIV patients who attend J.E. Wood outpatient clinic of Pennsylvania Hospital, Philadelphia for treatment of HIV/AIDS.
PARTICIPANTS AND METHODS:
In order to collect relevant information from our patients, a two paged, anonymous, study questionnaire was given to all patients who attended the clinic during January 2007 to December 2007. The questionnaire looked into three different areas of patient related factors which can influence the disease outcome: demographic and social information (Age, Sex, level of education), patients’ knowledge about their HIV disease (source of the infection, duration of HAART, individual recent CD4 count, names of current medications, duration of therapy, medication side-effects) and their behavior (sexual precautions, reasons for medication and follow-up non-compliance). Out of the 75 patients who were given the questionnaire, 7 questionnaires were rejected from the study because of the information received was incomplete, illegible or not related to the questions. 68 completed questionnaires were evaluated and comparative data was tallied using Microsoft excel sheet. We also reviewed relevant literature in pubmed to understand our findings in the light of previous studies related to demographic, socio-economic and psychological aspects of HIV treatment.
RESULTS:
We analyzed the information which was obtained from 68 patients by means of the questionnaire. Our patients consisted of 35 male, 33 female (Table 1). We had a wide range of patients regarding distribution of their age as shown in Table 2 below. Significant numbers of our patients (36%) were diagnosed with HIV for >10 years ago and more than 60% had the diagnosis at least for 5 years (Table 3)
Table 1: Socio-demographic characteristics of patients (n=68)
Variables
Percentage
Gender
Male
51.5%
Female
48.5%
Education
<High school
34%
High school graduate
50%
>High school
16%
Table 2: Age distribution of patients (n=68)
Age group
Percentage
Upto 30 years
19%
31 to 40 years
22%
41 to 50 years
37%
51 to 60 years
18%
61 years and above
4%
Table 3: Duration of diagnosis (in years)
Duration of
diagnosis (years)
Percentage of
total patients (n=68)
Unknown
3%
< 5
36%
>5 to 10
25%
>10
36%
Half of our patients (n= 68) completed high school education or equivalent. About 34% quit education before attaining high school diploma. Roughly, 10% of our patients went to college for further education and 6% acquired some vocational training after high school.
We tried to establish the level of our patients’ participation in their treatment by gathering information through the questionnaire whether they could recall the names of their HIV medicines and the last CD4 count. We found that 74% of our patients, who are on HIV medicines, could recall the names of their medicines but only about 45% of our patients remembered their last CD4 count. Our patients who had completed high school education or equivalent were 2.5 times more likely to remember the names of their HIV medications(95 % confidence interval CI=1.42 to 4.98) and 1.75 times more likely to remember their last CD4 count(95 % confidence interval CI=1.12 to 4.38).
We asked our patients whether they knew that HIV medications need to be taken life long and we also enquired about their knowledge about their safe sexual practices. Only 48% patients of our study group knew that HIV medicines are for life. About 50% of all our patients mentioned that they ensure use of condom during sexual activity and another 40% claimed they practice sexual abstinence. Women patients in our practice were 2.0 times more likely to practice use protective measures during sexual activity (95 % confidence interval CI=1.22 to 4.67).
In our study, only 32 patients (47%) attempted to answer the question where we asked about reason behind not turning up for their follow up appointments as scheduled. Eight patients could not specify a cause, 7 mentioned transport related problems and 2 had insurance issues. Five patients thought their appointments were too often whereas 3 just forget to keep the appointment. Although we did not specifically ask questions on psychological state of our patients, 7 out of the 32 patients mentioned significant psychological problems in their daily life as the reason for non-adherence to medication or follow-up appointments. The responses included responses like “still dealing with the diagnosis mentally”, “feel lack of energy in life”, “life seems to have too many problems”, “been drinking heavy lately” etc.
DISCUSSION:
Interestingly, our small patient cohort roughly reflects the sex ratio of HIV patients globally in 2007 as published by World Health Organization (WHO). In our study the ratio was Male : Female = 51.5% : 48.5% and in the WHO worldwide survey it was 50% : 50%; At the end of 2007, estimated total global HIV positive adults = 33 million (30million – 36 million) 3.
Rates of progression of HIV disease appear to be similar by sex and race category if adjusted for the quality of care 4, 5. Multiple studies on chronic disease management showed that patients’ level of education and health literacy has direct influence on the treatment compliance. Moreover, limited health literacy is thought to be a strong contributing factor to racial disparities in health care. A study was published in 2007 which examined the mediating effect of limited health literacy on the relationship between race and HIV-medication adherence. For the study, a total of 204 patients infected with HIV were recruited and structured in-person interviews were conducted to obtain information. In an adjusted analysis that excluded literacy, African Americans were 2.40 times more likely to be non-adherent to their HIV-medication regimen than whites (95% confidence interval [CI]=1.14-5.08). When literacy was included in the final model, the effect estimates of race diminished from 25% to insignificant level. Therefore, health care providers need to consider the potential utility of responding to literacy and communication barriers in health care as part of interventions to reduce racial disparities 6. In our study, we found that patients who had completed high school education or equivalent were more conscientious regarding their HIV care as demonstrated by the fact that they were more likely to remember their last CD4 count and current HIV medications.
Multiple studies have demonstrated that increasing age at the time of HIV infection is associated with more rapid progression to AIDS in the absence of antiretroviral therapy. In one series, for example, the median time from seroconversion to AIDS without therapy was 15 years for patients aged 16 to 24 years at seroconversion, compared to 6 years for those 35 years or older at seroconversion 7. In our study, it is notable that 36% of patients were diagnosed with HIV >10 years ago and more than 60% had the diagnosis at least for 5 years. The reason behind the high survival rate is clearly attributable to HAART. Fifty-four patients out of the 68 are currently on HAART and 25 of them are on it for more than last 5 years.
Patients' knowledge of their HIV condition and its treatment has been recognized as a factor that influences adherence to antiretroviral therapy. Patients’ knowledge & perception of the disease and participation in the treatment can be improved through targeted educational programs and support groups. One study done in Nigeria found that individuals living with HIV/AIDS who belonged to a support group and had availed themselves of relevant literature were more knowledgeable and positive about their illness than those who did not belong to support groups. The study concluded that HIV/AIDS support group membership is an important component of psycho-social care in HIV/AIDS patients 8. Another study done in France showed that an educational intervention improves adherence to antiretroviral regimens and health status and suggests that it should be initiated early in therapy 9. Communicating with patients about adherence issues is important issue, although this may not have an immediate impact on patients' behaviors. Health care professionals should play a pro-active role in this regard. The use of multi-disciplinary adherence teams to ensure that each HIV-positive patient receives the optimal amount of information and support for adherence is a practical approach. Health literacy should be provided in the context of different ethnicity, culturally sensitivity and individual needs associated with HIV, like any other chronic diseases. Epidemiological researches have shown that injection drug abusers and younger patients tend to have worse compliance, as well as subjects with depression and lack of self-perceived social support 10. Therefore, special care should be taken by health care providers to ensure treatment compliance and health literacy in these patients. In our J.E. Wood clinic, we have dedicated psychologist and social worker to for care of our HIV patients.
Psychological impact associated with treatment of any chronic illness is often neglected in clinical practice but indeed carries a huge significance in terms of long-term treatment compliance and outcome. We identified 7 of our patients who clearly expressed psychological issues related to their HIV infection and it was evident enough that those psychological problems were adversely affecting their treatment compliance. Formal and regular counseling sessions should be arranged for HIV/AIDS patients to promptly identify and manage any psychological or psychiatric disturbance that HIV patients might suffer from. We know that presence of a preexisting psychiatric disorder can increase the risk of HIV acquisition and can also complicate HIV treatment. Moreover, HIV infection can produce a number of psychiatric conditions and exacerbate many others; there is an intense co-morbidity and linkage between HIV and various types of psychiatric conditions. Personality disorders are more prevalent among HIV-infected (19 to 36 percent) and HIV at-risk (15 to 20 percent) individuals 11, 12 than the general population (10 percent). Antisocial personality disorder (ASPD) is the most common personality disorder among HIV infected individuals, and has been shown to significantly increase risk of HIV infection 13. Successful treatment can be achieved with even the most difficult patients by applying a comprehensive diagnostic formulation that includes psychiatric disease syndromes such as major depression, personality vulnerabilities, behavioral disorders such as addiction, and problems of life experiences such as trauma. With regards to anti-retroviral treatment of HIV positive or AIDS patients, nearly perfect compliance seems to be indispensable to obtain the maximum benefit from HAART. There is a clear relation between high adherence levels and virologic success. We reviewed relevant published literatures to understand the adverse effects and possible interventions of psychological problems in HIV patients. A prospective, randomized, two-arm controlled study was published in 2000 which included 116 patients starting their first-or second-line HAART who were randomized to receive psychoeducative intervention to implement adherence (experimental group [EG]) or a usual medical follow-up (control group [CG]). The study showed that specific and maintained psychoeducative interventions based on excellence on clinical practice are useful to keep high levels of adherence and therefore, high levels of viral suppression 14.
CONCLUSION:
Human Immunodeficiency Virus infection is one of the most serious disease entities in our modern time. We have witnessed dramatic improvement of long-term survival rate of HIV positive patients due to use of HAART in clinical practice. By identifying the demographic, socio-economic, behavioral and psychological variables which significantly influence patients’ adherence to treatment and understanding of the disease process, we can further improve treatment compliance and the long term prognosis of our HIV patients. These factors may not have very significant role individually, but collectively can dictate the course of success of HAART treatment in patients. Increasing awareness of these factors by practitioners caring for HIV-infected persons, recognizing and potentially treating some of them, should indirectly improve the effectiveness of antiretroviral therapy.
COMPETING INTERESTS None Declared AUTHOR DETAILS SUBHASISH BOSE, M.B.B.S., M.R.C.P, PGY1 in Internal Medicine, Pennsylvania Hospital, Philadelphia, USA. AJAY VARANASI, M.B.B.S.; PGY3 in Internal Medicine, Pennsylvania Hospital, Philadelphia, USA. GYI MO, M.B.B.S., M.P.H.; Director of J.E. Wood clinic, Pennsylvania Hospital, Philadelphia, USA. CORRESPONDENCE: DR SUBHASISH BOSE, Apartment 601, 269 South Ninth Street, Philadelphia, PA-19107, USA. Email: kumub@yahoo.com
Kaposi's sarcoma and Pneumocystis pneumonia among homosexual men--New York City and California. MMWR Morb Mortal Wkly Rep 1981; 30:305.
Status of the global HIV epidemic. http://data.unaids.org/pub/GlobalReport/2008/jc1510_2008_global_report_pp29_62_en.pdf. Accessed January 31, 2009.
Collaborative Group on AIDS Incubation and HIV Survival including the CASCADE EU Concerted Action. Time from HIV-1 seroconversion to AIDS and death before widespread use of highly-active antiretroviral therapy: a collaborative re-analysis. Lancet. 2000 Apr 1; 355(9210):1131-7.
Altisent, C, Montoro, JB, Ruiz, I, Lorenzo, JI. Long-term survivors and progression of human immunodeficiency virus infection. N Engl J Med 1996; 334:1065.
Osborn CY, Paasche-Orlow MK, Davis TC, Wolf MS. Health literacy: an overlooked factor in understanding HIV health disparities. Am J Prev Med. 2007 Nov; 33(5):374-8.
Mariotto, AB, Mariotti, S, Pezzotti, P, et al. Estimation of the acquired immunodeficiency syndrome incubation period in intravenous drug users. Am J Epidemiol 1992; 135():428.
Olley BO. The role of support group and duration of infection in HIV/AIDS patients' knowledge and attitudes to their illness. Afr J Med Med Sci. 2007 Mar; 36(1):11-6.
Goujard C, Bernard N, Sohier N, Peyramond D, Lançon F, Chwalow J, Arnould B, Delfraissy JF. Impact of a patient education program on adherence to HIV medication: a randomized clinical trial. J Acquir Immune Defic Syndr. 2003 Oct 1; 34(2):191-4.
Gordillo V, del Amo J, Soriano V, González-Lahoz J. Sociodemographic and psychological variables influencing adherence to antiretroviral therapy. AIDS. 1999 Sep 10; 13(13):1763-9.
Sher, KJ, Trull, TJ. Substance use disorder and personality disorder. Curr Psychiatry Rep 2002; 4:25.
Jacobsberg, L, Frances, A, Perry, S. Axis II diagnoses among volunteers for HIV testing and counseling. Am J Psychiatry. 1995; 152:1222.
Perkins, DO, Davidson, EJ, Leserman, J, et al. Personality disorder in patients infected with HIV: a controlled study with implications for clinical care. Am J Psychiatry. 1993; 150:309.
Tuldrà A, Fumaz CR, Ferrer MJ, Bayés R, Arnó A, Balagué M, Bonjoch A, Jou A, Negredo E, Paredes R, Ruiz L, Romeu J, Sirera G, Tural C, Burger D, Clotet B. Prospective randomized two-Arm controlled study to determine the efficacy of a specific intervention to improve long-term adherence to highly active antiretroviral therapy. J Acquired Immune Deficiency Syndrome. 2000; 25(3):221-8.
The significance of disturbed subjective sleep quality in the general population is important because of high prevalence rates (of up to 30%)1 and the association with decreased quality of life.2 Poor sleep affects cognitive and physical functioning, and insomnia is associated with a greater risk of falls and accidents,3 higher rates of absenteeism4 and increased health care utilization.4
Insomnia is commonly encountered in primary and secondary care settings, and can be symptomatic of many medical, neurological, substance abuse or primary sleep disorders.
Epidemiological and clinic-based studies consistently demonstrate high rates of psychiatric comorbidity.5,6 Sleep disturbance is an important clinical construct in psychiatry. It represents formal diagnostic criterion in mental illnesses such as affective and anxiety disorders.7,8
Insomnia is broadly defined as the subjective experience of poor or unrefreshing sleep, with some objective evidence of reduced time asleep or delayed sleep-onset. The subjective nature of such complaints remains key, because sleeping is a private event, and there is often no informant history. Furthermore, it is the perceptual aspects of sleep that influence patients’ help-seeking behaviour, such as consultation requests, demands for night sedation, and medication and substance use. It is noteworthy that despite the wide-ranging implications and subjectively distressing nature of this phenomenon, it remains arguably one of the least satisfying symptoms to treat. Seeking a better understanding of the extent and nature of patients’ sleep perception can help optimise appropriate therapeutic strategies.
This is the first study assessing the subjective sleep quality of a sample of psychiatric disordered in-patients in a UK psychiatric hospital setting, using the Pittsburgh Sleep Quality Index (PSQI).9 This study is framed in the context of increasing the awareness of the significance of patients’ complaints of insomnia and addressing the wider psychosocial issues that this raises.
Method
Design: This was a cross-sectional survey of the self-reported quality of sleep in a population of psychiatric in-patients on the acute adult wards of a London psychiatric hospital.
Participants and Procedure:Participants consisted of psychiatric in-patients (ages 18-65) on all five of the acute adult open psychiatric wards of the Highgate Mental Health Centre, London, currently admitted for the assessment or treatment of mental illness. Financial compensation was not provided for any subject.
Subjects were approached on the ward by a member of nursing staff and asked if they were interested in participating in a study about sleep. The researcher was then introduced to explain further details with the aid of the participant information sheet. After a minimum of 24 hours, patients were approached again by the researcher and asked if they were willing to participate. Recruitment of subjects took place if the patient was agreeable to take part and did not meet any of the exclusion criteria (listed below). A scheduled time and date was made with participants in order to obtain written informed consent and to administer the questionnaire. Questionnaire data was collected from each subject by the researcher in a private interview room located on the patient’s psychiatric ward. Demographic and clinical data required from the patient’s medical notes was recorded on the day of sampling. Exclusion criteria were: the presence of severely disturbed behaviour, or having received rapid tranquilisation for such behaviour on the day of sampling; a significant impairment in physical condition (e.g. infection, trauma); a history of a sleep disorder (e.g. obstructive sleep apnoea); the presence of organic illness including dementia; and lack of capacity to give informed consent.
Quality of Sleep:Subjects' quality of sleep was assessed by the administration of the Pittsburgh Sleep Quality Index (PSQI).9 This is one of the most widely used questionnaires employing standardised measures to assess subjective sleep quality in clinical and research settings. It assesses sleep quality and disturbances over a 1-month time interval. 19 individual items are used to generate 7 component scores (with a range of possible subscale scores from 0 to 3): 1) overall subjective sleep quality; 2) sleep latency; 3) sleep duration; 4) habitual sleep efficiency; 5) sleep disturbances 6) use of hypnotic or sedative medication; 7) daytime dysfunction. Higher scores indicate greater sleep disturbances. The sum of the component scores yields a global score (ranging from 0 to 21), which was used as the primary outcome measure in this study. A global PSQI score cut off score of 5 discriminates between good and bad sleepers and the PSQI gives acceptable measures of internal homogeneity, consistency (test-retest reliability) and validity.9,10
Other Variables:Demographic and clinical data recorded concurrently from participant's medical notes included: sex (male/female); age (years); ethnicity (Asian/Black/Mixed//Other); body mass index (BMI) (calculated as the ratio between weight [kilograms] and squared height [metres]); primary psychiatric diagnosis (based on ICD-10 criteria); duration of psychiatric illness (years); past medical history; number of currently prescribed medications; length of admission to date (days); current admission status (informal/detained under Section 2 of the Mental Health Act (MHA) (1983) (this is for a maximum period of 28 days for further assessment)/detained under Section 3 MHA (1983) (this is for a maximum period of 6 months for psychiatric treatment). A further category (detained under another type of section) was dropped as this did not apply to any of the subjects.
Ethics Committee Approval:Ethical and research governance authorisations were granted from Camden and Islington Community Local Research Ethics Committee, and from the North Central London Research Consortium, respectively.
Statistical Analysis:The aim was to compare clinical, demographic and PSQI data between the poor sleepers and good sleepers. The prevalence (%) of poor sleep was determined by the proportion of subjects with global PSQI score of 5 or more. Statistical analyses were predominantly performed using the software package Stata, version 9.2.
Results
Sample Characteristics
77 patients were initially identified as potentially eligible subjects. Of these, 31 (40%) were excluded due to: the presence of disturbed behaviour (n=1); inability to give informed consent (n=9); unwillingness to participate (n=19); absence from ward (either on leave or absent without leave) (n=2).
This left a total of 46 patients who were enrolled in to the study. Subject characteristics are given in Table 1. Table 1: Demographic and clinical characteristics of study subjects
Sex, n (%)
Male
24 (52)
Female
22 (48)
Ethnicity, n (%)
Asian
1 (2)
Black
9 (20)
Mixed
1 (2)
Other
1 (2)
White
34 (74)
Current Admission Status, n (%)
Detained under Section 3 MHA
22 (48)
Detained under Section 2 MHA
5 (11)
Informal
19 (41)
Age, years: mean (s.d.)
38 (11.1)
Range
18-62
Body Mass Index, kg/m²: mean (s.d.)
25.99 (4.96)
Range
17.9-41.5
Duration of mental illness, years: mean (s.d.)
10.51 (7.93)
Range
0.17-30
Length of admission, days: mean (s.d.)
42.43 (63.21)
Range
2-366
Prescribed regular medications, mean (s.d.)
1.83 (1.05)
Range
0-5
Medical comorbidities, mean (s.d.)
0.59 (0.98)
Range
0-3
s.d.: standard deviation
As defined by ICD-10 criteria, the most common subdivisions of patients’ psychiatric diagnoses in descending order were: paranoid schizophrenia, F20.0, (n=16); emotionally unstable personality disorder, F60.3, (n=6); depressive disorder, F32, (n=6); bipolar affective disorder, F31 (n=5). Other subdivisions of subjects’ diagnoses included: organic mood disorder, F06.3 (n=1); organic personality disorder, F07, (n=1); residual and late onset psychotic disorder due to alcohol use, F10.7, (n=1); persistent delusional disorder, F22, (n=1); acute and transient psychotic disorder, F23, (n=1); unspecified non-organic psychosis, F29, (n=1); post traumatic stress disorder, F43.1, (n=1). One patient was undergoing psychiatric evaluation and therefore had no formal diagnosis.
Medications prescribed regularly were: antipsychotics (for 40% of the total sample of patients), mood stabilizers (16%), antidepressants (14%) and benzodiazepines (7%). In terms of regular night time sedation, two patients out of a total of 46 were prescribed zopiclone and diazepam respectively. Zopiclone was prescribed on an “as required” basis for 15 patients (33% of the total sample).
Overall sleep quality evaluated by the PSQI revealed a mean score of 9.74 (standard deviation= 5.11). Poor sleep quality (defined as a global PSQI score of 5 or more) was present in 36 out of the total of 46 subjects (78% of the sample).
Comparison between good and poor sleepers
Comparison of numerical measurements between the two sleep groups is presented in Table 2. For the normally distributed variables the figures reported for each group are the mean (standard deviation) and the p-value from the t-test. For the non-normally distributed variables the figures reported are the median (inter-quartile range) and the p-value from the Mann-Whitney test.
Table 2: Comparison of demographic and clinical data between good and poor sleepers.
(*) Median (Inter-quartile range) reported. Analysis performed using Mann-Whitney test
The results indicate that there was no strong evidence of a statistically significant difference between good and poor sleepers for any of the variables examined. However, there was a possible difference for duration of admission, although this result was only of borderline statistical significance (p=0.06). The results indicate a median duration of admission of 44 days for good sleepers and 15 days for poor sleepers.
The difference between sleep groups for the categorical variables was examined using Fisher’s exact test. Results, presented in Table 3, show the number (and percentage) of subjects falling into each category, with the p-value indicating the significance of the results.
Table 3: Comparison of categorical data between good and poor sleepers
Variable
Group
Good sleepers
(total PSQI <5)
N (%)
Poor sleepers
(total PSQI ≥5)
N (%)
P-value
Sex
Female
3 (30%)
19 (53%)
0.29
Male
7 (70%)
17 (47%)
Admission status
Section 3
9 (90%)
18 (50%)
0.01
Section 2
0 (0%)
5 (14%)
Informal
1 (10%)
13 (36%)
Physical
comorbidities
None
7 (70%)
24 (67%)
1.00
1+
3 (30%)
12 (33%)
There was a significant difference between sleep groups with regard to their admission status. Almost all (90%) of the good sleepers were detained under Section 3 MHA (1983), whilst this applied to only half of those in the poor sleepers group. Being detained under Section 2 MHA and informal admission were more commonly found amongst those categorised as poor sleepers.
There was no significant difference between groups in terms of sex or the presence of physical comorbidities.
The final set of analyses compared the differences between groups for the PSQI measures, and the results are summarised in Table 4. The figures reported are the mean (standard deviation) score for each group. For the individual components the Mann-Whitney test was used to compare between groups, and the p-values from this analysis are reported. For the PSQI total score, the unequal variance t-test was used to compare between groups.
Table 4: Comparison of PSQI measures between the good and poor sleepers
Good sleepers
(total PSQI <5)
Mean (SD)
Poor sleepers
(total PSQI ≥5)
Mean (SD)
P-value
PSQI C1 score (quality) (*)
0.2 (0.84)
1.6 (0.9)
<0.001
PSQI C2 score (latency) (*)
0.9 (1.0)
1.8 (1.0)
0.02
PSQI C3 score (duration) (*)
0.1 (0.3)
1.7 (1.3)
0.002
PSQI C4 score (efficiency) (*)
0.1 (0.3)
1.7 (1.3)
0.001
PSQI C5 score (disturbances) (*)
0.7 (0.5)
1.4 (0.6)
0.003
PSQI C6 score (sedatives) (*)
0.4 (1.0)
1.5 (1.4)
0.04
PSQI C7 score (daytime dysfunction) (*)
0.7 (0.9)
2.1 (0.8)
0.004
PSQI total
3.1 (1.3)
11.6 (4.1)
<0.001
(*) Analysis performed using Mann-Whitney test
There was a statistically significant difference between good and poor sleepers for all PSQI components and for the PSQI total. The PSQI component values and PSQI total scores for poor sleepers were significantly higher than for good sleepers.
A profile of the mean PSQI individual component scores between the two groups (good sleepers versus poor sleepers) is displayed in Figure 1.
Figure 1: Mean component PSQI scores of good and bad sleepers Profiles of the PSQI represent group differences of individual component scores. Mann-Whitney test, *p<0.05).
Subjective Patient Comments
The PSQI also comprises an open ended question, providing subjects with the opportunity to cite “other” (subjective) reasons for difficult sleep. The most common response was anxiety (n=8). Other examples included: medication alterations (n=3); environmental noise (n=2); “thinking excessively” (n=1); “a desire to be creative” (n=1); hard mattress (n=1); “food eaten” (n=1); “sedentary lifestyle” (n=1); alcohol (n=1); hunger (n=1); asthma (n=1); symptoms of the menopause (n=1); and “voices”(n=1).
Discussion
Main Results
This is the first study to examine the subjective quality of sleep among a population of psychiatric in-patients in the UK. The prevalence of poor sleep, as defined by a cut off PSQI score of 5 or more, was present in 78% of the patients sampled. Patients detained under Section 3 MHA (1983) were more likely to report sleeping well when compared to informal patients or those detained under section 2 MHA (1983). There was some evidence of good subjective sleep quality being related to a longer duration of admission, but this requires further investigation.
There were no significant differences between good and poor sleepers for any of the other demographic and clinical variables studied, including age, body mass index, duration of psychiatric illness, number of prescribed medications, sex, and physical comorbidities.
Individual PSQI component scores and global scores were significantly lower for good sleepers compared to poor sleepers. This would be expected given that higher scores indicate more severe sleep complaints, and this supports the consistency of the PSQI as a research instrument.
Factors Affecting Sleep
In-patients’ disturbed sleep may be caused by a variety of exogenous factors such as unfamiliar surroundings, environmental noise, bright lighting and staff interactions or monitoring. Physical and psychological factors, such as the side-effects of medication and substance use, may also have a detrimental effect on sleep quality. In the added presence of a psychiatric disorder, each of these factors may act synergistically on the relationship between mental illness and sleep. Despite substantial research supporting the robust associations between insomnia and comorbid conditions, specific mechanisms linking sleep, medical and psychiatric factors have not been well established.
Sleep complaints may represent early symptoms and risk factors for new episodes of mental illness rather than simply representing phenomena secondary to experience of mental illness. For example, longitudinal studies have found insomnia to be a substantial risk factor for the development of a depressive disorder5,11,12 and the risk for developing new anxiety disorders and alcohol abuse is also greater for insomniacs.6
Stepanski & Rybarczyk13 present research arguing against the more traditional conceptualisation of insomnia as simply a consequence of another disorder. They propose the need for a revised model to understand insomnia that is comorbid with medical and/or psychiatric illness. Abnormalities of the hypothalamic-pituitary-adrenal (HPA) axis may represent the underlying pathophysiological process in many chronic insomnia patients.14 This may signify a common risk factor for insomnia and depression, thus predisposing the individual to a vulnerability to both conditions.15
In this study, detained patients (under Section 3 MHA (1983)) were significantly more likely to be classified as good sleepers. A suggestion for this finding could be that these patients may be less resisting of remaining and sleeping on the ward due to the involuntary nature of their admission. Alternatively these patients may represent the group with the most severe mental illnesses and with the least insight, and therefore less able to accurately recall their (poor) sleeping habits over the previous month.
There was also a potential association between longer admission status and better sleep quality. Explanations for this observation might include: patients’ acceptance over time of their admission and the consequent conditioning to, and familiarisation with, the ward environment; achievement of stability in mental state over time; or the adaptation of the perception of sleep quality to the sleep disturbances that accompany mental illness.
Limitations
This study is based on cross-sectional data and the relationship between the course of mental illness and sleep perception cannot be determined. In order to verify the direction of causality, it is necessary to demonstrate longitudinally that improvement in symptom severity is accompanied by an increase in subjective sleep quality.
This study was not designed to look at the prevalence of poor sleep across the different classes of psychiatric illnesses and dual diagnoses were not considered. It did not measure psychopathology or self-reported psychological distress. Possible confounding factors were not taken in to account, such as concurrent use of caffeine, alcohol, nicotine, illicit substances, hypnotics or other medications known to affect sleep.
The PSQI measures sleep quality averaged over the previous month. In cases where patients had only very recently been admitted to hospital, measurements would have been unlikely to accurately reflect the perspective of an in-patient’s experience. The mean length of admission for this population however was longer than one month (42 days).
These results were drawn from a small sample, with a fairly high proportion of excluded patients (40%). This may explain why this study did not identify factors previously found to more frequently affect sleep adversely such as female gender, the elderly and those with chronic medical conditions.16 In addition the population sample has little ethnic diversity which limits the generalisability of the results.
Implications
This study found that the prevalence of poor sleep quality was more common than previously reported in the general population17 and more comparable to the higher rates reported in similar patient populations. Two previous studies investigating subjective sleep quality using the PSQI, found prevalence rates of poor sleepers to be 45.5%18, and 91.22%19 among a population of schizophrenia patients and psychiatric in-patients respectively.
Complaints of poor sleep are important for diagnostic purposes and also raise the need to address the adequacy of therapeutic strategies, given the consequent adverse impact on patients’ mental state, physical health, daytime function and quality of life.
Improving Sleep
Hypnotics such as benzodiazepines and benzodiazepine receptor agonists can be efficacious for the treatment of insomnia.20,21 However the clinical benefits must be weighed against well known adverse effects, such as daytime sedation, agitation, memory impairment, confusion and ataxia. This, together with the recommendation that hypnotics should only be used for short periods of time because of the risk of drug tolerance and dependence,22 highlights the need for suitable non-pharmacological alternatives.
Recent reviews support the notion of the effectiveness of Cognitive Behavioural Therapy for insomnia in the treatment of people with psychiatric or medical conditions.13,23 Modified, lower cost education initiatives to promote good sleep could be employed by utilising the skills of the mental health professionals caring for patients on the ward, supplemented by the provision of clear written material.
Environmental variables to consider include adherence to regular ward routines including bedtime and awakening times, attention to ward layout and design (including the provision individual bedrooms), lighting, ambient noise, temperature, and the provision of comfortable mattresses and appropriate bed linen. Medication scheduling times, regular medication reviews, and avoidance of non-prescribed substances such as caffeine, alcohol and illicit substances are also important. Physical health problems, pain and psychological distress should be optimally managed. Moderate intensity exercise programs have also been found to bring about significant improvements in self-rated sleep quality.24 Finally, increased staff awareness and sensitivity to the sleep problems on the ward, supplemented with objective recording of such disturbances, would be informative in gaining a further understanding of patients’ insomnia experiences.
Future Directions for Research
The PSQI is simple and inexpensive to perform. Results could be followed longitudinally in order to examine the course of sleep problems throughout an episode of acute mental illness, or to examine the effects of specific therapeutic interventions for sleep disorders. Sleep diaries have been shown to provide reliable estimates of subjective sleep parameters25 and could be used as an adjunct to the PSQI. Ideally, concomitant objective measures such as polysomnography or wrist actigraphy (which detects physical motion), as well as cognitive and behavioural measures could be used to provide additional data.
This study represents the first attempt to examine the degree of self-reported poor sleep quality in a UK-based population of psychiatric in-patients and results suggest unsatisfactory sleep is a common finding. Large prospective longitudinal studies of sleep quality with control for confounding factors are needed to confirm the high prevalence rates in psychiatric in-patients. Studies comparing psychiatric patients with healthy controls, and also with insomniacs without psychiatric comorbidity, would further clarify the role of psychopathology in sleep disturbance.
ACKNOWLEDGEMENTS With thanks to Mr Paul Bassett, Statistical Consultant COMPETING INTERESTS None Declared AUTHOR DETAILS LUCINDA DONALDSON, BSc, MB BS, MRCPsych, Specialty Registrar, Barnet, Enfield and Haringey Mental Health Trust, United Kingdom PRAVEEN KUMAR CHINTAPANTI, MB BS, DPM, MRCPsych, Consultant Psychiatrist, Camden and Islington NHS Foundation Trust, United Kingdom CORRESPONDENCE: LUCINDA DONALDSON, Specialty Registrar, South West Complex Mental Health Team, 7th Floor Premier House, 112 Station Road, Edgware, Middlesex HA8 7BJ, United Kingdom Email: lucindadonaldson@yahoo.co.uk
References
1. Ancoli-Israel S, Roth T. Characteristics of insomnia in the United States: results of the 1991 National Sleep Foundation Survey. I. Sleep 1999;22 Suppl 2:S347-53.
2. Leger D, Scheuermaier K, Philip P, et al. SF-36: Evaluation of quality of life in severe and mild insomniacs compared with good sleepers. Psychosom Med 2001;63:49-55.
3. Roth T. Prevalence, associated risks, and treatment patterns of insomnia. J Clin Psychiatry 2005;66 suppl 9:10-13.
4. Leger D, Guilleminault C, Bader G, et al. Medical and socio-professional impact of insomnia. Sleep 2002;25(6):625-629.
5. Ford DE, Kamerow DB. Epidemiologic study of sleep disturbances and psychiatric disorders. An opportunity for prevention? JAMA 1989;262:1479-84.
6. McCall WV. A psychiatric perspective on insomnia. J Clin Psychiatry 2001;62 Suppl 10:27-32.
7. World Health Organisation. The ICD-10 Classification of Mental and Behavioural Disorders: Diagnostic Criteria for Research. Geneva: World Health Organisation, 1993.
8. American Psychiatric Association. Diagnostic and Statistical Manual of Mental Disorders (4th edn) (DSM-IV). Washington, DC: American Psychiatric Association, 1994.
9. Buysse DJ, Reynolds CF 3rd, Monk TH, et al. The Pittsburgh Sleep Quality Index: a new instrument for psychiatric practice and research. Psychiatry Res 1989;28:193-213.
10. Doi Y, Minowa M, Uchiyama M, et al. Psychometric assessment of subjective sleep quality using the Japanese version of the Pittsburgh Sleep Quality Index (PSQI-J) in psychiatric disordered and control subjects. Psychiatry Res 2000;97:165-172.
11. Breslau N, Roth T, Rosenthal L, et al. Sleep disturbance and psychiatric disorders: a longitudinal epidemiological study of young adults. Biol Psychiatry 1996;39:411-418.
12. Chang PP, Ford DE, Mead LA, et al. Insomnia in young men and subsequent depression. The Johns Hopkins Precursors Study. Am J Epidemiol 1997;146:105-114.
13. Stepanski EJ, Rybarczyk B. Emerging research on the treatment and etiology of secondary of cormorbid insomnia. Sleep Med Rev 2006;10:7-18.
14. Richardson GS, Roth T. Future directions in the management of insomnia. J Clin Psychiatry 2001;62 suppl 10:39-45.
15. Roth T, Roehrs T. Insomnia: Epidemiology, Characteristics, and Consequences. Clin Cornerstone 2003;5(3):5-15.
16. Morin CM, Hauri PJ, Espie CA, et al. Nonpharmacologic treatment of chronic insomnia: an American Academy of Sleep Medicine review. Sleep 1999;22:1134-56.
17. Doi Y, Minowa M, Uchiyama M, et al. Subjective sleep quality and sleep problems in the general Japanese adult population. Psychiatry Clin Neurosci 2001; 55(3): 213-215.
18. Ritsner M, Kurs R, Ponizovosky A, et al. Perceived quality of life in schizophrenia: Relationships to sleep quality. Qual Life Res 2004;13:783-791.
19. Prieto-Rincón D, Echeto-Inciarte S, Faneite-Hernández P, et al. [Quality of sleep in hospitalized psychiatric patients]. Invest Clin 2006;47:5-16.
20. Nowell PM, Mazumdar S, Buysse DJ, et al. Benzopdidazepines and zolpidem for chronic insomnia: a meta-analysis of treatment efficacy. JAMA 1997;278:2170-7.
21. Holbrook AM, Crowther R, Lotter A, et al. Meta-analysis of benzopdiazepine use in the treatment of insomnia. CMAJ, 2000; 162: 225-233.
22. National Institute for Health and Clinical Excellence. Guidance on the use of zaleplon, zolpidem and zopiclone for the short-term management of insomnia. London: NICE, 2004. (Technology Appraisal 77.) Available from: URL: http://www.nice.org.uk/TA077guidance
23. Smith MT, Huang MI, Manber R. Cognitive behavior therapy for chronic insomnia occurring within the context of medical and psychiatric disorders. Clin Psychol Rev 2005;25:559-92.
24. King AC, Oman RF, Brassington GS, Bliwise DL, Haskell WL. Moderate-Intensity Exercise and Self-rated Quality of Sleep in Older Adults. A Randomized Controlled Trial. JAMA 1997;277:32-37.
25. Coates TJ, Killen JD, George J, et al. Estimating sleep parameters: A multitrait-multimethod analysis. J Consult Clin Psychol 1982;50:345-52.
Hepatitis B is one of the world’s major health problems 1. By recent estimates, worldwide more than 2 billion people have been infected with hepatitis B virus (HBV) globally and more than 350 million have chronic (long term) liver infections2. The infection is supposed to be causally related to 1 to 2 million deaths per year worldwide 3. Hepatitis B is a blood borne infection that is transmitted 1) by an infected mother to the newborn, 2) by contact with infected blood through unsafe injection, transfusion, open wounds, and sharing toothbrush or razors, and 3) by unprotected sex. Approximately 90% of newborns infected with HBV develop chronic infection, whereas 30-50% of children under age 5 years, 10% of adolescents aged 15 years, and 2-5% of older individuals develop chronic infection 4,5.
In Pakistan, it is Hepatitis (B & C) not Human immuno deficiency virus (HIV) that is the most common serious viral infection. Number of hepatitis B carriers in Pakistan is estimated at around seven million4 that is about 5% of the world wide 350 million carriers of hepatitis B 5. Unlike HIV, there was no large-scale national awareness campaign to educate the public and healthcare professionals in Pakistan about these infections before 2006, but now a comprehensive national strategy that will lead to the elimination and control of hepatitis B is becoming a top public health priority in Pakistan after inclusion of HBV immunization in government’s expanded Program for Immunization (EPI). The World Health Organization (WHO) Assembly endorsed the recommendation of its Global Advisory Group that all countries should implement a hepatitis B immunization program6. The threat of HBV to the health of the nation is frequently under-recognized by epidemiologists, policy makers and the public because unlike the influenza virus, it is often not the acute infection that makes people sick, but the consequences of chronic HBV infection that occurs after 20-30 years. Fortunately, hepatitis B is a vaccine preventable disease, global eradication is therefore possible if everyone worldwide receives the HBV vaccine before they become infected. Despite advances in antiviral therapy, only a minority of patients with chronic hepatitis B will have a sustained response. Thus, primary prevention by vaccination to increase herd immunity remains the main thrust in the control of HBV infection.
The development of hepatitis B vaccine is considered to be one of the major achievements of modern medicine. Three different classes of hepatitis B vaccine are available based upon how they are derived (from plasma, yeast, or mammalian cells).The first generation HBV vaccine was prepared by concentrating and purifying plasma from Hepatitis B surface antigen (HbsAg) carriers to produce 22 nm sub viral particles, which contain HBsAg alone. Derivation from plasma has left lingering concerns regarding the potential to transmit blood-borne infections, although this vaccine has excellent efficacy and safety7. Yeast-derived recombinant HBV vaccines were first introduced in the mid 1980s. They are produced by cloning of the HBV-S gene in yeast cells. These vaccines contain non-glycosylated HBV small S protein as the envelope antigen which must be released from the yeast during the manufacturing process 8. These vaccines do not contain antigens of the pre-S regions. The third class of HBV vaccine is the mammalian cell-derived recombinant vaccine. Three vaccines of this class have been developed. In addition to the S antigen, one of these contain antigen from the pre-S2 region while the other two contain antigens from both the pre-S1 and pre-S2 regions 9
The efficacy of universal immunization has been shown in different countries, with striking reductions of the prevalence of HBV carriage in children, most importantly; the HBV vaccine can be considered the first successful anti-cancer vaccine, as 20 years of mass vaccination has clearly reduced the incidence of hepatocellular carcinoma in children, at least in Taiwan 10. Currently available hepatitis B vaccine in Pakistan’s market are genetically engineered DNA recombinant vaccines and the recommended series of three intramuscular doses of hepatitis B vaccines induces a protective antibody response (anti-HBs > =10 milli-international units {mIU/ml}) in > 90% of healthy adults and in >95% of infants, children and adolescents 7, 11.
A vaccine consists of many parts, only one of which is the antigen by which it is known. Other components of the presentation may include, for instance, an adjuvant, a preservative or other ingredient. There may be components not stated on the information sheet that are classified as proprietary and therefore the manufacturers are not obliged to declare them. Thus, the effect the vaccine has, on an individual may be influenced in various ways by each and all of these components. Preservatives are just one of a number of additives to vaccines that are carefully regulated and which come under special scrutiny from time to time 12. Several case reports raised concerns that hepatitis B (HB) immunization might be linked to new cases or reactivation of multiple sclerosis, could shift the immune system toward an auto-immune direction, or may cause central nervous system (CNS) demyelinating diseases etc 13, 14, 15, 16. The present study sought to compare the safety of four hepatitis B vaccine regimens available in Pakistan’s market, in apparently healthy young females, and to determine the sero-response (i.e. reactogenicity and immunogenicity) to these vaccine in the same group of volunteers.
MATERIALS AND METHODS: Study Duration: Jan 2003 to Jan 2006 Study Design: Prevention, Open Label, Dose Comparison, Parallel Assignment, Safety/Efficacy Study. Subject: A total of 243 apparently young healthy female students of two Universities of the city were included in this study. Informed Consent: Prior to immunization, all volunteers were requested to give written informed consent to participate in this study. The volunteers were also advised that they are free to withdraw from the study at any time without any obligation to disclose her reason (s) for so doing. Criteria For Inclusion In The Study: All volunteers after submitting their signed consents were subjected to selection criteria on the basis of health checkups by a medical doctor to record the various factors including: a) Age: 18 – 30 years, b) History of Jaundice, blood transfusion, exposure to syringe, surgical and dental, c) Weight: > 45 Kg, d) Body Temperature: 96 – 98°F, e) Hemoglobin: > 10 g/ dl, f) Blood Pressure: Systolic 100 – 180 mm of Hg, Diastolic: 60 – 100 mm of Hg, g) Pulse rate: > 65/min.
After qualifying for inclusion in this study, volunteers were asked to give 10 cc of blood sample for different hematological (CP i.e. complete blood picture and Hb% i.e. hemoglobin percentage by Sysmex blood analyzer & ESR i.e. erythrocyte sedimentation rate by Westergreen method ), and Biochemical analysis (Direct Bilirubin, Indirect Bilirubin, ALT, AST and, Alkaline phosphatase by MicroLab- Merck chemistry analyzer), this data was used to keep the record of health status of participants and its comparison with adverse effects if appeared. Screening for HBs antigen, anti HBs antibodies and HBc IgM antibodies by Immunochromatography (ICT, Australia and Abbott, USA) and confirmation by enzyme linked immunosorbent assay (IMX ELISA - Abbott, USA) was also done before first dose of immunization. Test Vaccines: Fourrecombinant yeast derived HB vaccine were used as test regimens i.e. Euvax-B (LG Chemicals Ltd., Korea), Heptis-B (Boryang, Korea), Amvax-B (Amson, Pakistan) and Engerix-B (GS & K, Belgium). To avoid complications related to multi dose vials, it was strictly followed that the vaccination dose for each subject should be company packed, individually in a sealed container and, formulated for intra muscular injection. The dosage vial should contain same amount i.e. 20 μgm/ ml of HBs Ag absorbed on to approximately 0.5 μgm / ml adjuvant (aluminum hydroxide) and 100 μgm / ml preservative (Thiomersal/ Thimerosol) in a final volume of 1.1 ml (1 dose/ vial). Storage temperature should maintain as 2ºC to 8ºC to ensure integrity. Participants were injected with the vaccine of their own choice. Information broachers of the four vaccines were distributed among participants to help them make a choice. Out of total 729 doses administered to 243 individuals during this study, 195 were of Engerix-B, 420 were Heptis-B, 75 were Amvax-B, and 39 doses were of Euvax-B. Categories for Determining Severity of an Adverse Effect:
Local Symptoms: Soreness, indurations, swelling and redness.
General Symptoms: Fever, headache and dizziness.
Mild: Adverse events easily tolerated
Moderate: Adverse event of sufficient discomfort to interfere with daily activity or requiring simple treatment (e.g. Paracetamol, Generic name: Paracip).
Severe: Adverse event incapacitating and preventing usual activity or which may be life threatening, requiring hospitalization or completed treatment.
The course of an adverse event was described as:
Spontaneous recovery without discontinuation of vaccination
Recovery after discontinuation of vaccination
Continuation of recovery after symptomatic treatment
Eight samples of Peripheral blood (2-3 ml) were taken from all vaccinees before administration of each dose, and at different intervals after completion of immunization as per schedule given below; the sera were collected and stored at - 20°C.
Table 1: Visits Were Scheduled As Follows:
Vaccination number & sample collection
1.
First sample Before 1st dose of Vaccine (Jan, 2003)
2.
Second sample Before 2nd dose of Vaccine (Feb, 2003)
3.
Third sample Before3rd dose of Vaccine (June, 2003)
4.
Fourth sample After 6 months of 3rd dose (Dec, 2003)
5.
Fifth sample After 15 months of 3rd dose (Sep, 2004)
6.
Sixth sample After 19 months of 3rd dose (Jan, 2005)
7.
Seventh sample After 22 months of 3rd dose (May, 2005)
8.
Eighth sample After 30 months of 3rd dose (Jan, 2006)
Antibody Estimation and Statistics:
Anti-HBs were detected by ELISA using IMX- Abbott and quantitated using appropriate dilution of a positive sample with a known concentration of anti-HBs expressed as IU/L, provided by the manufacturer. The assay determined IgG type of anti- HBs antibody and the protective level of antibody was considered >10 IU/L. P values of less than 0.05 were considered significant. On the whole Hepatitis B antibodies titer was determined in participants using five standards i.e. <10 IU/ml, Between 10 – 100IU/ml, Between 100 – 1000 IU/ml, >1000 IU/ml, and no response or no antibody titer for the period of 36 months starting Jan’2003 till Jan’ 2006.
RESULTS:
Percentage of Geometric mean titer (GMT) of antibodiesbelow 10 IU/ml was in between 0.0% to 0.22% in case of Engerix-B, 0.0% to 0.20% in case of Euvax B, 0.0% to 0.30% in case of Amvax-B and 0.0% to 0.25% in case of Heptis-B. Percentage of GMT of antibodies between 10 – 100 IU/ml was in between 0.0% to 10% in case of Engerix-B, 0.0% to 9% in case of Euvax B, 0.0% to 8.9% in case of Amvax-B and 0.0% to 9.3% in case of Heptis-B. Percentage of GMT of antibodies between 100 – 1000 IU/ml was in between 0.0% to 35% in case of Engerix-B, 0.0% to 30.1% in case of Euvax B, 0.0% to 39.3% in case of Amvax-B and 0.0% to 40% in case of Heptis-B. While, Percentage of GMT of antibodies above 1000 IU/ml was in between 0.0% to 23% in case of Engerix-B, 0.0% to 25% in case of Euvax B, 0.0% to 26% in case of Amvax-B and 0.0% to 23.7% in case of Heptis-B. When Percentage of GMT of negative response was calculated we found that on the whole Engerix-B showed no response after 6 months of 3rd dose in 0.9% recipients leading towards no response in 31.78% of recipients after 30 months of 3rd dose. Euvax-B showed no response after 6 months of 3rd dose in 7.9% recipients leading towards no response in 35.68% of recipients after 30 months of 3rd dose. Amvax-B showed no response after 6 months of 3rd dose in 11.6% recipients leading towards no response in 25.5% of recipients after 30 months of 3rd dose. While, Heptis-B showed no response after 6 months of 3rd dose in 9.88% recipients leading towards no response in 26.75% of recipients after 30 months of 3rd dose. Period after 6 months of 3rd dose and before 15th month of 3rd dose was the period when highest Percentage of GMT of anti- HBs was observed .
Local and generalized adverse effects observed during and after the immunization of volunteers were recorded separately for each vaccine (Table 2, 3, 4 & 5).
Table 2 Incidence of Local and/or Generalized Symptoms on Vaccination With Engerix-B
Dose
Total
Local
Only
General
only
Local &
General
With
symptoms
n
n
%
N
%
n
%
n
%
1
65
19
29
5
8
10
15
38
58
2
65
11
17
3
5
7
11
29
45
3
65
8
12
0
0
0
0
18
28
Total
195
38
19
8
4
17
9
85
44
Table 3 Incidence of Local and/or Generalized Symptoms on Vaccination With Euvax-B
Dose
Total
Local
Only
General
only
Local &
General
With
symptoms
n
n
%
n
%
n
%
n
%
1
13
4
31
2
15
3
23
8
62
2
13
2
15
1
0
2
15
6
46
3
13
2
15
0
0
0
0
0
0
Total
39
8
21
3
8
5
13
14
36
Table 4 Incidence of Local and/or Generalized Symptoms on Vaccination With Heptis-B
Dose
Total
Local
Only
General
only
Local &
General
With
symptoms
n
n
%
n
%
n
%
n
%
1
140
53
38
10
7
34
24
95
68
2
140
25
18
25
18
27
19
70
50
3
140
22
16
7
5
32
23
84
60
Total
420
100
24
42
10
93
22
249
59
Table 5 Incidence of Local and/or Generalized Symptoms on Vaccination With Amvax-B
Dose
Total
Local
Only
General
only
Local &
General
With
symptoms
n
n
%
n
%
n
%
n
%
1
25
13
52
8
32
3
56
23
92
2
25
2
8
6
24
4
16
9
36
3
25
14
56
3
12
25
100
12
48
Total
75
29
39
17
27
32
43
44
59
As Shown in Table 6 that one month after the first dose, 180/243 subjects (74.45%) had seroprotection with respect to anti-HBs. One month after the second dose, 189/243 subjects (77.92%) showed seroprotection, four months after second dose, at month 6, 224/243 subjects (92.43%) were seroprotective. After 15 months of 3rd dose 231/243 subjects (95.27%) showed maximum seroprotection level in the immunized women. Later on seroprotection level was determined after 19, 22 and 30 months of 3rd dose. 170/243 subjects (70.08%) subjects were seroprotected even after 30 months of 3rd dose without having any booster dose.
Table 6: Over All Seroprotection Levels and Geometric Mean Titers (GMT) of Anti- HBs Antibodies
Timing
N
S+
% of S+
GMT
Range of Anti HBs Titer
PRE
Before Vaccination (Jan, 03)
243
0
0
0
0
M1
Before 2nd dose (Feb, 03)
243
180
74.45
16
0-50
M2
Before 3rd dose (June, 03)
243
189
77.92
143
1-700
M3
After 6 months of 3rd dose(Dec, 03)
243
224
92.43
18500
45-50000
M4
After 15 months of 3rd dose(Sep, 04)
243
231
95.27
23000
40-50000
M5
After 19 months of 3rd dose(Jan, 05)
243
222
91.57
12100
39-33000
M6
After 22 months of 3rd dose(May, 05)
243
195
80.53
1875
5-17000
M7
After 30 months of 3rd dose(Jan, 06)
243
170
70.08
690
1-1500
Comparative results of serum protection analysis of 04 candidate vaccines determined after 15 months of third dose without giving any booster dose, were found effective in healthy young female volunteers, demonstrating induction of very good immunogenicity. No significant differences were observed in seroprotection level of test vaccines (Table7). Overall serum protection rate achieved in case of Engerix-B was 95.9%, in case of Euvax-B, it was 95.2%, in case of Heptis-B was 95.0% , and in case of Amvax-B it was 95.1%. Calculated P values for all four test vaccines were lesser than 0.05 indicating significance of the used vaccines.
Table 7: Comparative Serum Protection analysis of 04 different Hepatitis-B Vaccines(n= 243; mean age= 21.5+3.7 Years)
As yet no such immunogenicity trials have been conducted in Pakistan or risk factors indigenous to the region assessed for any of the vaccine being utilized at the population level for such long period. Our study, is one of the longest study, conducted between Jan’2003 and Jan’ 2006, which includes total 243 healthy women subjects of child bearing age group. In this study we have demonstrated that there is no significant difference in reactogenicity and serum protection level among all four candidate vaccines we tested here, excellent immunogenicity of vaccines in volunteers recommends their usage for immunization purpose among different communities without having any doubts related to reactogenicity and side effects.
Recombinant hepatitis B vaccines have long been used for protection in the serum of and three doses have been shown to produce Anti HBs in the serum of approximately 95% of people who have not encountered the virus. The antibody response declines with increasing age. Patientsolder than 30 years have an increased risk of no response toHBV vaccine, as compared with younger persons 17. Thus, immunizationduring childhood or adolescence offers the greatest potentialfor protection 17 and provides lifelong immunity. Ninety percent of healthy adults and 95 percent of infants, children, and adolescents have protective serum anti-HBs antibody concentrations after the vaccine series has been completed 18.
Two kinds of recombinant vaccine are used for active immunization against hepatitis B; one of them contains the PreS1 and PreS2 antigenic domains while the other kind contains S and PreS polypeptide. No important differences between the effectiveness of these two types of vaccine have been detected 19. In a series of studies it has been demonstrated that 90-99% of healthy neonates, children, adolescents and adults develop protective levels of anti-HBs antibody following a standard vaccination course with hepatitis B vaccine 20, 21, 22, 23, 24, 25.
Efficacy of vaccines in the field have been measured long after the vaccine have been introduced at large scale population levels and only selected countries have record keeping such as the Centers for Disease Control in USA and the National Health Services in UK. Most developing countries do not have infra structure to support these activities and therefore the efficacy and risk indigenous to the population remains unknown.
Procurement and delivery of high-quality vaccine has national and international public health and ‘public good’ implications far beyond the scope of most products. People immunized with vaccines of inadequate quality can become ill and die from the disease that the vaccine should have prevented. Even more lives are placed at risk if vaccination coverage declines as a result of reduced public confidence in immunization programs. If we look at the outcome of immunization programs in different countries then we will have a good idea that how mass vaccination helped in reduction of disease burden?26
Importance of dose size, number of doses and dose response is another important issue related to immunization programs. Published studies regarding the dose-response relationship in terms of immunogenicity and sero-protection are highly varied. Chiaramonte et al 27reported that the sero-protection reached a level of 99.6% within one month after primary immunisation with the recombinant hepatitis B vaccine. The findings of Assateerawatt et al28 and Just et al 29 also were the same. Baldy JLS et al carried out a comparative study with three recombinant hepatitis B vaccines, one Brazilian (Butang, Instituto Butantan) and two Korean vaccines (Euvax-B, LG Life Sciences Ltd. and Hepavax-Gene, Green cross Vaccine Corp.), administered intramuscularly to students aged 17to19 years in three doses (corresponding to half the amount of antigen routinely used for adult vaccination) at intervals of one month between the first and second dose, and of four months between the second and third dose. The GMT of anti-HBs induced by the Euvax-Band Engerix-B vaccines were higher than those obtained with the Butangvaccine (p < 0.05); this difference was not significant when comparing the other vaccines two-by-two. No spontaneous adverse effects attributable to the application of any dose of the three vaccines were reported 30.
Vaccine efficacy is defined as the reduction in the incidence of a disease among people who have received a vaccine compared to the incidence in unvaccinated people. The efficacy of a vaccine is measured in clinical trials by giving one group of people a vaccine and comparing the incidence of disease in that group to another group of people who do not receive the vaccine. In our study overall efficacy of the vaccines used was satisfactory, without producing sever adverse effects, also there is no report of incidence of disease till now, in those who were vaccinated during this study(Table 2, 3, 4, 5).
Maximum protection level in terms of immunogenicity was observed in Euvax-B, which showed GMAT of 35.68% in test population. Engerix-B showed GMAT of 31.78%, Heptis-B showed GMAT of 26.75% and, Amvax-B showed GMAT of 25.5% after 30 months of 3rd dose of immunization While highest serum protection level was achieved in case of Engerix -B i.e. 95.9%. On the whole, r-hepatitis B vaccines showed high immunogenicity and good safety profile in the test population.
The inclusion of Hepatitis B in the list of compulsory and Extended Program for Immunization (EPI) in Pakistan since 2005 will result in mass vaccination of pediatric population. However, a big chunk of the adult population, especially healthcare workers, also needs to be immunized against Hepatitis B infection. We believe that all of the above mentioned HB vaccines, which are easily available in Pakistan’s market can be used for these mass vaccination programs without having any doubts related to Reactogenecity and Immunogenicity.
CONCLUSION:
In conclusion, this prospective study reinforces that the four different recombinant hepatitis B vaccines licensed in Pakistan have a good tolerability and are highly immunogenic among young women. It is also recommended that government should ensure the serosurvey of HBsAg and vaccine coverage at country level in order to reduce the disease burden on country’s economy.
ACKNOWLEDGEMENTS We are thankful to the administration of Jinnah University for Women, Karachi-Pakistan, administration of University of Karachi, Karachi-Pakistan, and team of Volunteer students from Microbiology Department, JUW for their cooperation during vaccination camps and manufacturers of test vaccines for giving consents to include their vaccines in this study. COMPETING INTERESTS None Declared AUTHOR DETAILS SHAZIA TABASSUM HAKIM, Ph.D., Virology and Tissue Culture Lab, Jinnah University for Women and I.I.D.R.Lab., University of Karachi, Pakistan SAYYADA GHUFRANA NADEEM, Virology and Tissue Culture Lab, Jinnah University for Women and I.I.D.R.Lab., University of Karachi, Pakistan SHAHANA UROOJ KAZMI, I.I.D.R.Lab., University of Karachi, Pakistan CORRESPONDENCE: SHAZIA TABASSUM HAKIM, Associate Professor & Chairperson, Department of Microbiology, Jinnah University for Women, Nazimabad, Karachi-74600, Pakistan Email: Shaz2971@yahoo.com
References
1.Kane MA, and Clements J. Hepatitis B. D. T. Jamison, W. H. Mosley, A. R. Meashan, and J. Bobadilla , editors. Disease control priorities in developing countries. New York: Oxford University Press N.Y; 1993:321–330.
2.World Health Organization, Revised fact sheet, August 2008.
3.Park K. Textbook of prevention and social medicine, 15th edition, Jabalpur, India: Banarsidas Bhanot Publishers;1997:159
4.Wasim J, Nadim J, Yakoob K , Muhammad I, Tirmizi SFA, et al. Hepatitis B and C: prevalence and risk factors associated with seropositivity among children in Karachi, Pakistan. BMC Infectious Disease. 2006;6:101
5.Zaman AS. 2003. Daily Dawn Internet Edition. 23 January.
6.WHO, 45th World Health Assembly, expanded programme on immunization and vaccine quality—progress report by the Director General, A45/8. World Health Organization, Geneva, Switzerland. 1992.
7.Szmuness W, Stevens CE et al. Hepatitis B vaccine: demonstration of efficacy in a controlled clinical trial in a high-risk population in the United States. N Engl J Med. 1980; 9;303(15):833-41.
8.Stephenne J. Development and production aspects of a recombinant yeast-derived hepatitis B vaccine. Vaccine. 1990;8 Suppl:S69-73; discussion S79-80.
9.Young MD, Schneider DL et al. Adult hepatitis B vaccination using a novel triple antigen recombinant vaccine. Hepatology. 2001;34(2):372-6.
10.Kao JH, Chen DS. Global control of Hepatitis B infection. Lancet Infect Dis. 2002;2(7):395-403.
11. Zajac BA, West DJ, McAleer WJ, Scolnick E M. Overview of clinical studies with hepatitis B vaccine made by recombinant DNA. J. Inf. 1986; Suppl A0:39–45.
12.Clements CJ. Vaccine preservatives: what is the big deal?. Indian J Med Res. 2006;124:5–8.
13.Duclos P. Safety of immunisation and adverse events following vaccination against hepatitis B. Expert Opin Drug Saf. 2003;2:225-31.
14.Hall A, Kane M, Roure C, Meheus A. Multiple sclerosis and hepatitis B vaccine? Vaccine. 1999;17:2473-2475.
15.DeStefano F, Verstraeten T, Jackson LA et al. Vaccinations and risk of central nervous system demyelinating diseases in adults. Arch Neurol. 2003;60:504-509.
16.Ascherio A, Zhang SM, Hernán MA et al. Hepatitis B vaccination and the risk of multiple sclerosis. N Engl J Med. 2001;344:327-332.
17.Fisman DN, Agrawal D, Leder K. The effect of age on immunologic response to recombinant hepatitis B vaccine: a meta-analysis. Clin Infect Dis. 2002;35:1368-1375.
18.Mast E, Mahoney F, Kane M, Margolis H. Hepatitis B vaccine. Plotkin SA, Orenstein WA, editors. Vaccines. Philadelphia: Saunders. 2004:299-337.
19.Bertino JS Jr, Tirrell P, Greenberg RN et al. A comparative trial of standard or high-dose S subunit recombinant hepatitis B vaccine versus a vaccine containing S subunit, pre-S1, and pre-S2 particles for revaccination of healthy adult nonresponders. J Infect Dis. 1997;175:678-681.
20.Zannolli R, Morgese G. Hepatitis B vaccine: current issues. Ann Pharmacother. 1997;31(9):1059-1067.
21.West DJ, Calandra GB. Vaccine induced immunologic memory for hepatitis B surface antigen: implications for policy on booster vaccination. Vaccine. 1996;14(11):1019-1027.
22.Jafarzadeh A, Shokri F. The antibody response to HBs antigen is regulated by coordinated Th1 and Th2 cytokine production in healthy neonates. Clin Exp Immunol. 2003;131(3):451-456.
23.Shokri F, Jafarzadeh A. High seroprotection rate induced by low doses of a recombinant hepatitis B vaccine in healthy Iranian neonates. Vaccine. 2001;19(31):4544-4548.
24.Jafarzadeh A, Kardar GA, Khoshnoodi J, Shokri F. Downregulation of IL-12 production in healthy nonresponder neonates to recombinant hepatitis B vaccine. Iran Biomed J. 2004;8:41-45.
25.Jafarzadeh A, Shokrgozar MA, Khoshnoodi J, Shokri F. Unresponsiveness to recombinant hepatitis B vaccine in healthy Iranian neonates: association with HLA antigens. Irn J Med Sci. 2002;27:51-55.
26.Proceedings of Who’s third expert working group meeting on hepatitis B. Tokyo, Japan 6-7 March 2007.
27.Chiaramonte M, Majori S, Ngatchu T et al. Two different dosages of yeast derived recombinant hepatitis B vaccines: A comparison of immunogenicity. Vaccine. 1996;14:135-7.
28.Assateerawatt A, Tanphaichitr VS, Suvatte V, Yodthong S. Immunogenicity and efficacy of a recombinant DNA hepatitis B vaccine, Gen Hevac B Pasteur in high risk neonates, school children and healthy adults. Asian Pac J Allergy Immunol. 1993;11:85-91.
29.Just M, Berger R, Just V. Reactogenicity and immunogenicity of a recombinant hepatitis B vaccine compared with a plasma derived vaccine in young adults. Postgrad Med J. 1987;63 (Suppl 2):121-3.
30.Baldy JLS, Lima GZ, Morimoto HK et al. Immunogenicity of three recombinant hepatitis B vaccines administered to students in three doses containing half the antigen amount routinely used for adult vaccination. Rev Inst Med Trop S Paulo. 2004;46(2):103-7.
Laparoscopic fundoplication (LF) has been emerging as the procedure of choice for selected patients with symptomatic and problematic reflux disease since the first described case by Dallemagne in 1991 (1). This was followed by a rapid expansion into routine clinical practice shortly afterwards. With increased acceptance and availability of laparoscopy as a safe surgical modality there has been a huge increase in the number of patients undergoing LF. This has probably been due to increased willingness of patients and referring doctors to consider the less invasive procedure, rather than the older ‘open’ surgical treatment, with its more rapid recovery, smaller incisions and earlier return to work and to normal daily activities.
Patient referral patterns have also changed over the last decade with the main indication for consideration of LF being patient choice, a general unwillingness to take long term medication as well as ineffective or intolerance of medications and relapse of symptoms (5-6). Several advantages of LF have been described by recent data including shorter hospital stay, less requirement for analgesia, and sooner return to work (7-9). These have to be offset against procedure specific complications including gastro-oesophageal perforation, pneumothorax, dysphagia, and bleeding (2-4). However, the other main downside to LF is the learning curve during which there are an increased number of complications. Previous reports have suggested the learning curve to be around 20 for an individual surgeon and 50 for an institution (10-12).
In a recent meeting of the Upper GI group at the Royal College of Surgeons there was discussion concerning the incidence and management of dysphagia following laparoscopic fundoplication (13 Bill Owen Day RCS (Eng) 2004). There is a paucity of data available in this regard with a general paucity of negative or unequivocal results in the literature equating to a selection bias towards only positive data and positive reporting of good results.
Therefore the aim of the present study was to look critically at the learning curve and, with respect to operative complications, with specific regard to the incidence and management of dysphagia in a personal series of patients who underwent a laparoscopic fundoplication in a District General Hospital in the United Kingdom.
Patients and Methods
From December 1997 to February 2004, 75 patients who underwent laparoscopic fundoplication under the care of a single consultant surgeon in a district general hospital were included in this study. It became routine practice for LF to be performed by one dedicated surgical team (JMT) who kept a complete prospective list of procedures. This series was complete and the hand written records of all the procedures were used to identify patients undergoing operations for LF with or without reduction and repair of Para-oesophageal hernia during the study period. These records were cross-checked with the theatre logbook, hospital computer system as well as with the surgeon’s own record. This ensured full inclusion in the analysis of patients.
The groups were not randomised and ‘all comers’ where included in the study. However, Group 1 consisted of the first 20 LF whereas Group 2 included LF (numbers 21-75). Informed consent was obtained in writing prior to surgery. At least a single dose of prophylactic antibiotics (of either a third generation cephalosporin or co-amoxiclav) was administered at induction; all patients received standard thromboprophylaxis (subcutaneous clexane, TEDS, intermittent pneumatic calf compression).
Patients underwent a laparoscopic fundoplication as briefly described below. The patient was placed in the lithotomy position with reversed Trendelberg tilt; a pneumoperitoneum was created and 4 ports inserted. The liver was elevated using a ‘Nathanson’ liver retractor placed through a 5 mm epigastric incision. Initially the right and left limbs of the right crus are dissected alongside the pancreaticogastric and phrenogastric ligaments. A window is created behind the distal oesophagus. A Penrose drain is passed through the gap. The short gastric vessels are divided using a harmonic scalpel (Ethicon, USA), if required. The crural limbs are approximated using 2, 2-0 ethibond sutures to leave a hiatus 1 cm wider than the oesophagus. A laparoscopic babcock is placed behind the oesophagus and the gastric fundus is brought left to right behind the oesophagus and bought round to meet with the remaining portion of the fundus anteriorly. Two (or rarely three) sutures of 2-0 ethibond were used for the fundoplication. The upper suture included a bite of the anterior hiatal margin to anchor the wrap. Of note, the important feature of the procedure is the creation of a ‘floppy’ tension free fundoplication. This is hugely aided by good mobilisation of the gastric fundus with its associated ligaments and if required, division of the short gastric vessels. Notably, one must carefully create a window behind the oesophagus and an overlap of no longer than 3 cms length and one must stay high up on the fundus in order to avoid the creation of a ‘2’ compartment stomach syndrome’.
Post-operatively all patients were treated in an identical manner. As soon as tolerated after the operations the patients were allowed the consumption of water; diet and analgesia were made available as soon after surgery as required by individual patients. Complications were noted as they occurred during the follow-up period. Both general and specific complications were documented for at least 6 months. Furthermore, patient demographics, details of operations, all complications and follow-up data were kept. Follow up for the purpose of this audit involved completion of a proforma at a minimum post operative period of one year and a maximum of eight years.
All patients where regularly reviewed daily on the ward whilst they were in-patients and in the outpatients at 4-6 week intervals or sooner should the need arise by the surgical team. Thereafter they were given a “see on request” appointment. Data on patient and procedure related morbidity and acceptability was also collected.
At the time of the study contact was made via the telephone and a questionnaire was completed. A telephone survey asking the patient four questions,
Where they happy with the operation
Would they reccomend the procedure to a friend
Had there symptoms resolved
If they had had post op dysphagia had it resolved
The data was reviewed and analysed in conjunction with our department of medical statistics. Analysis was performed using the Mann-U test. Multivariate analysis of the means was performed using the Kruskal-Wallis Test.
Results
Overall the 75 patients who underwent laparoscopic fundoplication consisted of 44 males (59%) and 31 females (41%). The mean age was 47.0 years (range 22-80 years). Group 1, which consisted of the first 20 LF cases included 11 male and 9 females. The mean age was 53.25 years (range 32-80). Group 2, which consisted of the LF cases numbering 21-75 included 33 male and 22 females. The mean age was 44.8 years (range 22-78). Both groups were well matched across the above parameters with no statistical differences (Table A). Only 4 patients were obese (5%), smoker (n=10, 14%), 7 patients suffering with Hypertension (10%) and one with diabetes mellitus (2%) and were equivalently represented in both groups (data not shown).
Presenting features are shown in Table B. Notably, the commonest presenting complaints included regurgitation of acid/ food in 79% (n=59), heartburn in 73% (n=55) and pain and discomfort 53% (n=35). Other complaints included dysphagia 21% (n=16), cough/wheeze 19% (n=14) and excess salivation 18% (n=13).
Table A: Patient Demographics
Group 1
Group 2
P value
Numbers
20
55
NS
Male: Female
9: 11
22: 33
NS
Age range (mean) yrs
32-80 (53)
22-78 (45)
NS
Operating time (median) mins
120-240 (190)
75-195 (144)
<0.05
Sliding/No sliding
11
44
NS
Type II/Type III hiatus hernia
9
11
NS
Table B: Presenting Features
No. of cases
Regurgitation (acid/food)
59 (79%)
Heartburn
55 (73%)
Dysphagia
16 (21%)
Cough/wheeze
14 (19%)
Excess Salivation
13 (17%)
Nausea
10 (14%)
Epigastric pain
6 (8%)
TOTAL
173 (100%)
Patients underwent pre-operative evaluation with Upper GI endoscopy 88% (n=66), pH manometry 47% (n=35) and barium swallow 32% (n=24). Previous to this procedure all patients (100%) were on or had been during some part of their illness on therapeutic doses of proton pump inhibitors.
There was a significant difference between the operating times in the two groups. Thus in Group 1 the average operating time was 190 minutes (range120-240 minutes) whereas in Group 2 the average operating time was 144 minutes (range 75-195 minutes, P <0.05).
Table C: Post Op Mild and Moderate Complications<
Cases (n=75)
Dysphagia
40
Regurgitation
7
Nausea
4
Diarrhoea
3
Heartburn
5
Excess Salivation
2
Portsite discomfort
6
Gas Bloat
4
Total
71
One of the major aims of the study was to record post-operative complications. Table C shows all mild and moderate complications which resolved completely with conservative management. Of note Table F shows that dysphagia occurred in up to 40 of our patients. Table F shows the distribution of dysphagia in both groups. In group A (n=20) the are 15 patients who complained with dysphagia (75%) of which 5 settled spontaneously and 10 required further investigation with OGD +/- dilation. in group B (n=55), 25 patients suffered with dysphagia all of which settled with conservative management. Our initial policy was to perform an OGD and dilate prophylactically; however, this was abandoned halfway through the study. It was found that the dysphagia settled in all patients with conservative management. Furthermore, other mild/moderate complications, of note included regurgitation of stomach contents (7/75) and port-site discomfort (6/75), all of which also resolved spontaneously
Table D: Major Complications Groups 1 & 2
Group 1
Group 2
P value
PE
1 (5%)
0
NS
Pneumonia
1 (5%)
1 (2%)
NS
Oesophageal Perforation
1 (5%)
1 (2%)
NS
Stomach perforation
0
1 (2%)
NS
Pneumothorax
0
1 (2%)
NS
Major desaturation
0
1 (2%)
NS
TOTAL
3 (15%)
5 (9%)
NS
Table E: Conversion to Open Surgery
Group 1(n=20)
Group 2(n=55)
P Value
Desaturation
0
1 (2%)
NS
Perforation viscus
1 (5%)
1 (2%)
NS
Pneumothorax
0
1 (2%)
NS
Technical (Obese/previous surgery)
2 (10%)
2 (4%)
NS
TOTAL
3 (15%)
5 (9%)
NS
Major complications are shown in Table D. Of note there are three conversions to ‘Open’ surgery in Group 1 and five in Group 2 (Table E). In detail, four cases (two in each group) were converted early because of poor or very difficult access. They included difficulty in reducing the stomach and omentum from the mediastinum into the abdomen, unable to reach the hiatus despite placing the ports as high as possible, dense adhesions between the liver and stomach and G-O junction thereby leaving no access to the hiatus and simply impossible access to the upper stomach. Further, oesophageal perforation which was caused by intra-operative insertion of a nasogastric bougie (Group 1), this was repaired laparoscopically with no sequelae. Other reasons for conversions included perforation of the greater curve of the stomach due to the fact that there was thickened fatty tissue around the greater curve of the stomach and spleen which produced a perforation while dissecting the stomach free. Also in Group 2 there was one pneumothorax and in another patient there was marked desaturation on creation of the pneumoperitoneum and in both cases it was deemed safer to open the patient.
Table F: Dysphagia Group
Group 1(n=20)
Group 2 (n=55)
P value
Dysphagia
15
25
NS
Resolved Spontaneously
5
25
<0.05
Investigated (swallow and OGD)
10
0
<0.05
Relaparotomy occurred in three patients; one developed severe pain and clinical shock at 24 hours and it was found on laparotomy to have a perforated oesophagus, the second patient we found disruption of the wrap (requiring re-operation and refashioning the wrap) and a final patient developed small bowel obstruction.
Finally a telephone survey at the conclusion of the study managed to contact 70/75 patients. It was found that overall 68/70 patients were satisfied with their procedure and would recommend the procedure to a relative or friend.
Discussion
Gastro-oesophageal reflux disease (GORD) is the commonest disorder of the Upper GI tract affecting approximately between 10-40% of most western populations and with rising incidence (11). In Australia it has shown to consume around 10% of the national expenditure on prescription drugs. Fortunately the majority of patients settle with simple measures including weight loss and reductions in smoking, caffeine and chocolate consumptions. Furthermore, better timing of meals as well as increasing the number of pillows and raising the head end of the bed can lead to improved symptoms. The advent of H2- receptor antagonist (H2RA) and later proton pump inhibitors (PPIs) has led to symptom control in the majority of patients. However, patients on maximum therapy who remain symptomatic or who develop complications (i.e. haemorrhage, oesophagitis, strictures) or those who refuse long term medication are deemed candidates for surgical intervention.
LF has emerged as the procedure of choice for GORD. The present study, which is a personal single surgeon series, shows that laparoscopic fundoplication is a safe and effective procedure with low rates of long-term complications. Importantly, post operatively these patients may develop dysphagia which settles with conservative measures in the vast majority of cases (13).
There is no doubt that for LF a ‘learning curve’ exists but there is debate about the actual numbers. Most studies suggest that it is around 20 for an individual and around 50 for a department (12), thus in the present study we compared our first 20 (classically thought to be within the learning curve) with the next 55 in order to assess major complications, conversions to open procedure. We found that in Group 1 there were 3 major complications (15%) whereas in the next 55 cases there were five (9%). Indeed only one major complication in Group 1 and two in Group 2 could be considered as technical, they were oesophageal and gastric perforations the rest being post operative pneumonia, PE and major desaturation. There were no deaths in either group. This was in keeping with previously published series (14-16).
Previously published data and our own observations revealed that there were significant post operative rates of dysphagia. In the present series dysphagia was the single commonest complication experienced by 53% of patients (n=40). Initially these were investigated with barium swallow and OGD and treated aggressively with early dilation (Group 1) however this strategy was abandoned after it was found that the vast majority of our patients resolved their dysphagia with conservative treatment. From thereon we adopted a very conservative approach reassuring the patient and keeping within close contact until the dysphagia resolved. We reserved dilatation for only highly resistant dysphagia or patients who where non-compliant with conservative treatment. We found that clear explanations pre-operatively, regular reassurance and assessment was generally all that was required. In Group 2 (21-75) none of the patients required dilation for dysphagia. It is almost universal that patients undergoing LF will have a degree of dysphagia. However what is now accepted and reflected from the experience from the present study is that dysphagia after LF should only cause concern if severe, presenting with severe pain, uncontrolled retching and vomiting requiring immediate surgical revision (17). Most commonly this is due to over-tightening of the hiatus or with poor mobilisation and a 360 degree wrap. This may be related to the learning curve, being more common in the earlier cases in a personal series. In our series 53% of patients (n=40) experienced dysphagia. This is comparable to previous reported data (2,16). Notably, Fontaumard et al reported a dysphagia rate of 78% (40/51). The reason for this post operative dysphagia has been thought to be related to the type of procedure. In our series all patients underwent a Nissen type of repair however evidence is now emerging that the incidence of dysphagia and gas related complications are reduced following anterior partial fundoplication (19,20). This is shown from the data of two recent randomised controlled studies. Baigrie et al (18) in a double-blind, randomized study compared laparoscopic Nissen total fundoplication and anterior partial fundoplication. There were no differences in mean heartburn scores between groups but dysphagia scores for both liquids and solids were lower after anterior fundoplication. Also Ludemann et al (19) compared total fundoplication for gastro-oesophageal reflux disease with an anterior 180 degrees partial fundoplication. Both achieved effective reflux control but the partial wrap was associated with fewer side-effects in the short term than total fundoplication. After 5 years, dysphagia, measured by a visual analogue score for solid food and a composite dysphagia score, was worse at 5 years after total fundoplication.
Our study confirms what has previously been shown with the learning curve for LF and its acceptability. It has also clearly highlighted that post operative dysphagia is common and affects a significant number of patients post operatively. However in our study we found that this was best managed conservatively and the almost all resolved spontaneously. There is no evidence to support early intervention unless the symptoms are very severe and occur very soon after surgery, when the patient should be taken back to theatre for another look. The specific causes of the dysphagia are not known but it is postulated that it is due to increased pressure as the upper part of the wrap augments the pressure of the lower oesophageal sphincter causing it to become over competent. Over time this mechanism relaxes leading to an improvement in dysphagia with simple conservative therapy. Furthermore, there was a hugely positive satisfaction score on a simple telephone survey suggesting symptom control from this procedure.
COMPETING INTERESTS None Declared AUTHOR DETAILS A A RIAZ, FRCS(I) FRCS(Eng) FRCS(Gen) PhD, Hunterian Professor RCS(Eng) and Senior Visiting Clinical Fellow, University of Hertfordshire, UK CORRESPONDENCE: A A RIAZ, Consultant Upper GI, Laparoscopic and General Surgeon, West Hertfordshire Hospitals NHS Trust, Waverley Road Hertfordshire, AL3 5PN, UK Email: mrariaz@hotmail.com
Watson DI, Johnson AG, Reed MWR, Stoddard CJ. Laparoscopic Fundoplication for gastroesophageal reflux. Ann R Coll Surg Engl 1994:76; 264-68.
Schauer PR, Meyers WC, Eubanks S et al. Mechanisms of avoidance of esophageal perforation during laparoscopic Nissens fundopliaction. Ann Surg 1996; 223:43-52.
Reid DB, Winning T, Bell G. Pneumothorax during laparoscopic dissection of the diaphragmatic hiatus. Br J Surg 1993;80:670
Perdikis G, Hinder RA. Lund J. Laparoscopic Nissens Fundoplication: where do we stand? Surg Laparosc Endosc 1997; 7; 17-21.
Laine S, Rantala A, Gullichsen R, Ovaska J. Laparoscopic vs. conventional Nissens Fundoplication. Surg Endosc 1997; 11:441-44.
Zacharoulis D, O'Boyle CJ, Sedman PC, Brough WA, Royston CM. Laparoscopic fundoplication: a 10-year learning curve. Surg Endosc. 2006; 20(11):1662-70.
Martin RC 2nd, Kehdy FJ, Allen JW. Formal training in advanced surgical technologies enhances the surgical residency. Am J Surg. 2005 Aug; 190(2):244-8.
Hwang H, Turner LJ, Blair NP. Examining the learning curve of laparoscopic fundoplications at an urban community hospital. Am J Surg. 2005 ;189(5):522-6;
7th Bill Owen Oesophago-Gastric Symposium 'Meet-the-Experts' The Royal College of Surgeons of England, London March 2005.
Watson DI, Baigrie RJ, and Jamieson GG. A learning curve for laparoscopic fundoplication. Definable, avoidable, or a waste of time? Ann Surg. 1996 August; 224(2): 198–203.
Champault GG, Barrat C, Rozon RC, Rizk N, Catheline JM. The effect of the learning curve on the outcome of laparoscopic treatment for gastroesophageal reflux. Surg Laparosc Endosc Percutan Tech. 1999 Dec; 9(6):375-81.
Cuschieri A, Hunter J, Wolfe B, Swanstrom LL, Hutson W. Multicenter prospective evaluation of laparoscopic antireflux surgery. Preliminary report. Surg Endosc. 1993; 7(6):505-10.
Jones NJ, Soper DB. Laparoscopic Nissens Fundoplication. Surg Rounds 1994:17;573-81
The primary objective of this survey was to check the availability and use of cameras in documentation of open fractures in emergency departments in England, Wales and Scotland. We also checked the use of mobile phone cameras in emergency departments without cameras. A telephone questionnaire posed questions to the first on-call orthopaedic doctor aboutthe availability of a functional camera in the emergency department. Altogether, 102 doctors replied in 115 hospitals that were surveyed. Only 63 emergency departments had a camera available for photography of open fractures, in which 53 orthopaedic doctors would always take photographs of an open fracture. In 7 emergency departments a mobile phone camera was used for documentation of open fractures, as a camera was not available.
Subsequently, recommendations for wound documentation using a mobile phone camera have been proposed as it is easily accessible and portable with good picture quality that can be transmitted to offsite senior colleagues for advice. This would prevent wound infection and also act as an adjunct to a narrative description of the wound.
Open fractures are quite common and account for a considerable number of admissions to the emergency department with a frequency of approximately 23 per 100000 patients per year1. Infections of open musculoskeletal injuries, especially open fractures, continue to pose a challenge to the Orthopaedic and Trauma surgeons. To reduce the risk of nosocomial infections these wounds need to be instantly photographed before the application of a sterile dressing which has to be left undisturbed until the surgical intervention in the theatre2.
The British Orthopaedic Association and British Association of Plastic surgeons recommend that a Polaroid photograph of every open fracture should be taken, this recommendation is not followed due to non availability of the equipment in some institutions1. This leads to unnecessary disturbance of the wound dressing, distress to the patient and nosocomial infection.
The objective of this study was to look at the availability and use of cameras in compound fractures in Hospitals across England, Wales and Scotland by using a telephone questionnaire.
Methods
We randomly selected 115 NHS hospitals with A&E departments from all the regions of the England, Wales and Scotland using the www.specialistinfo.com website and selected every third hospital on the list. The survey was conduction by the means of a telephone questionnaire (Table 1); the questions were answered by the first on call Orthopaedic doctor. 89% (102/115) first on-call doctors answered the questionnaire.
TABLE 1 Telephonic questionnaire
1. Do you have access to a camera in the A&E?
2. If yes, is the camera available 24/7?
3. Have you found a functional camera available every time you have wanted to use it?
4. Do you always take a picture of an open fracture?
5. Do you think that a picture is a useful tool in the assessment of a wound?
6. If a camera is not available in the A&E do you use your mobile phone camera?
Y/N
Y/N
Y/N
Y/N
Y/N
Y/N
The questionnaire was meant to investigate if the doctor had access to a functional camera that was available round the clock in the Emergency department. It also questioned whether the doctor on call would always take a picture of an open fracture. They were also asked whether they thought that the picture was helpful in assessment of the wounds. Finally the respondents were asked whether they used a mobile phone camera in case of non availability of a camera in the emergency department.
Results
Of the 102 first on call Orthopaedic doctors questioned, 38% (39/102) stated that they were unable to photograph an open fracture due to non availability of a camera in the emergency department. A functional camera was not available in both trauma centers and small hospitals. Of the 61% (63/102) who had a camera available 22% (14/63) did not have 24 hour access to the camera. 33% (21/63) who have a Polaroid camera available have found occasions when they needed a camera but it was not functional. (Figure 2)
Figure 1
Figure 2 Availability of cameras in A&E.
84% (53/63) who had a camera available said that they always photographed an open fracture. (Figure 3) 28% (11/39) doctors who did not have a camera in the emergency department would use a mobile phone camera to photograph an open fracture (Fig 1). 4 doctors used it even though they had a Polaroid camera in the Accident and Emergency department (A&E) as they found a mobile phone camera easy to use and readily accessible.
All the doctors who responded to the questionnaire thought that a camera was a valuable tool in the documentation of an open fracture.
Discussion
The objective of this study was to look at the availability and use of cameras in compound fractures in hospitals across England, Wales and Scotland.
Figure 3 Percentage of doctors photographing open fractures in A&E.
We found that 38% of hospitals did not have access to a camera at all, in a further 15% there wasnt 24 hour access and another 21% had a camera that was not functional when needed at some time in the Emergency department. Thus 74% of hospitals did not have a functional camera available in the emergency department at all times. Therefore the photographic documentation of an open fracture as recommended by the British Orthopaedic association and the British association of Plastic Surgeons working party could not be implemented2. 13% (8/63) respondents who had a camera in the Emergency department did not routinely photograph an open fracture. A similar study done in London and south-east UK hospitals found that 10% hospitals did not have a camera to photograph an open fracture and another 19% did not have it available 24 hours1.
The potential reasons for failure of photographic wound documentation could be difficulty to obtain funding for purchase of a camera, lack of secure storage space and unfamiliarity of the junior doctors with the guidelines of photographic wound documentation
Open wounds of the musculoskeletal system are usually contaminated at presentation with pathogenic organisms3. In the A&E the wound should be assessed and dressed until the formal debridement in the theatre. The ideal practice is to photograph the wound before application of the sterile dressing. These photographs are a vital tool as they act as an adjunct to a narrative description allowing the wound to be accurately described to colleagues. This avoids unnecessary disturbance of the sterile dressing over the wound which has a risk of nosocomial infection2.
The problem of non availability of Polaroid cameras in the emergency department can be overcome by using mobile phone cameras. We faced the same problem of non availability of a camera in our A & E department and we started using our camera phones for photographing open fractures. The authors found that images on mobile phone cameras allowed a useful presentation in the morning trauma meetings. The incidence of re- examining of the wound by the senior surgeons also dropped significantly. Mobile phones can be used in A & E as the maximum distance at which any phone causes interference is only two meters4.
We found the mobile phone camera a valuable alternative as it is easy to use and has excellent portability with an image quality that is sufficient for interpretation. In our study it is already being used by many doctors in different hospitals. With the advancement in technology the mobile phones have become more user friendly with the power to process medical images5. The advantage over a Polaroid picture is that these images can be transferred to another mobile phone or sent as an e-mail attachment for assessment by the offsite registrars and consultants for immediate advice. This is even more useful in hospitals with hospital at night where second on call doctors are usually nonresident. It has been shown that it takes only 3-4 minutes from image taking to remote reception6. The Integrated Service Digital Network (IDSN) used for image transfer in some hospitals is expensive and mobile camera phones are a suitable inexpensive substitute.
We recommend supplying a mobile phone camera to the on call doctor. Unlike Polaroid cameras they dont need a constant supply of batteries and expensive film and the risk of theft is negligible as they are smaller, lighter with excellent portability. The picture can be magnified and is easier to store than traditional cameras. Images must be stored in a manner that prevents tampering and preserves confidentiality. This could be done by deleting the images after they have been assessed, hard copies produced and kept in the case notes as done with pictures taken with a Polaroid camera or storing them by using specific software packages that do not allow image manipulation7 .
There have been two studies assessing the accuracy of the use of mobile phone cameras in diagnosing intracranial pathologies and interpretation of emergency Ear Nose and Throat (ENT) radiological investigations. 5, 8 They have also been used to take pictures of injured digits and then transmitted to camera phones of plastic surgeons for assessment 6. Tsai et al. in their study on teleconsultation by using the mobile camera phone showed that the camera phone is valuable for remote management of the extremity wound9 .Lam TK et al. showed that low cost and the ease of use make the mobile camera phones easily incorporated into clinical practice10.
Conclusion
A functional camera was not available at all the times for photographic documentation of open fractures in the majority of the hospitals. We also feel that mobile phone cameras may be used as a powerful graphic adjunct to a verbal clinical presentation to other health professionals located on or off site.
COMPETING INTERESTS
None Declared
AUTHOR DETAILS
MR R AHMAD, MBBS, MRCS, MR S K M ANNAMALAI, MBBS, MRCS, Registrars in T & O, Weston General Hospital, UK
MR SMY AHMED, Registrar T & O, Great Western Hospital, Swindon, UK
MR SA JOSEPH MBBS MRCS, Registrar T & , Wolverhampton General Hospital, UK
MR M BOULD FRCS, Consultant Orthopaedic Surgeon, Weston General Hospital, UK
CORRESPONDENCE: MR. SKM ANNAMALAI, Registrar, T & O, House 18, Staff Residence, Weston General Hospital, Weston Super Mare, BS23 4TQ
Email: suresh.annamalai@nhs.net
References
1. Solan MC, Calder JD, Gibbons CE, Ricketts DM. Photographic wound documentation after open fracture. Injury 2001; 32: 33-35.
2. The management of Open Tibial Fractures. British Orthopaedic Association and British association of Plastic Working Party, London, 1997.
3. Akinyoola AL, Ako-Nai AK, Dosumu O, Aboderin AO, Kassim OO. Microbial isolates in early swabs of open musculoskeletal injuries. Niger Postgrad Med J 2006; 13: 176-81.
4. Tri JL, Hayes DL, Smith TT, Severson RP. Cellular phone interference with external cardiopulmonary monitoring devices. Mayo Clin Proc 2001; 76: 11-5.
5. Eze N, Lo S, Bray D, Toma AG. The use of camera mobile phone to assess emergency ENT radiological investigations. Clin Otolaryngol 2005; 30: 230-3.
6. Hsieh CH, Tsai HH, Yin JW, Chen CY, Yang JC, Jeng SF. Teleconsultation with the mobile camera-phone in digital soft-tissue injury: a feasibility study. Plast Reconstr Surg 2004; 114:1776-82.
7. Bhangoo P, Maconochie IK, Batrick N, Henry E. Clinicians taking pictures a survey of current practice in emergency departments and proposed recommendations of best practice. Emerg Med J 2005; 22: 761-5.
8. Yamada M, Watarai H, Andou T, Sakai N. Emergency image transfer system through a mobile telephone in Japan: technical note. Neurosurgery 2003; 52: 986-8.
9. Tsai HH, Pong YP, Liang CC, Lin PY, Hsieh CH. Teleconsultation by using the mobile camera phone for remote management of the extremity wound: a pilot study. Ann Plast Surg 2004; 53:584-7.
10. Lam TK, Preketes A, Gates R.Mobile phone photo messaging assisted communication in the assessment of hand trauma. Lam TK, Preketes A, Gates R. ANZ J Surg 2004; 74:598-60
Propofol is an IV anesthetic that is often used as an adjuvant during monitored anesthesia care, the addition of ketamine to propofol may counteract the cardiorespiratory depression seen with propofol used alone. Ketofol (ketamine/propofol combination) was used for procedural sedation and analgesia. However, evaluation of the effectiveness of different concentrations of Ketofol in procedural operation regarding changes in haemodynamics, emergence phenomena, recovery time, the doses, and adverse effects was not yet studied, so this randomized, double blinded study was designed to compare the quality of analgesia and side effects of intravenous different concentrations of ketofol in hundred children of both sex undergoing procedural operation, e.g. esophgoscopy, rectoscopy, bone marrow aspiration and liver biopsy participated in this randomized, double-blinded study. Patients received an infusion of a solution containing either combination of propofol: ketamine (1:1) (Group I) or propofol: ketamine (4:1) (Group II). Subsequent infusion rates to a predetermined sedation level using Ramsay Sedation Scale. Heart rate, noninvasive arterial blood pressure (NIBP), oxygen saturation (SpO2), end tidal carbon dioxide (Etco2) and incidence of any side effects were recorded. There were no significant hemodynamic changes in both groups after induction. However, there was an increase in postoperative nausea , psychomimetic side effects, and delay in discharge times with the largest ketamine dosage (Group I). We concluded that the adjunctive use of smaller dose of ketamine in ketofol combination minimizes the psychomimetic side effects and shorten the time to discharge.
Procedural operations, are procedures outside the operating room, which developed from a facilitation of diagnostic and therapeutic procedures into an independent subspecialty. Procedural sedation and analgesia is a minimally depressed level of consciousness that retains the patient's ability to maintain a patent airway independently and continuously(1).
Propofol is a short-acting intravenous sedative agent used for the induction and maintenance of general anesthesia for adults and children, sedation for intubated, mechanically ventilated adults in Intensive Care Units (ICU), and in procedures such as colonoscopy. It provides no analgesia(2). Ketamine is classified as an NMDA receptor antagonist and has also been found to bind to opioid receptors and sigma receptors. It induces a state referred to as "dissociative anesthesia"(3).
Ketofol (ketamine/propofol combination) was used for procedural sedation and analgesia. Ketamine and propofol are physically compatible for 1 hr at 23oC with no increase in particle content at Y site injection (4). Ketamine and propofol administered in combination have offered effective sedation for spinal anesthesia and for gynecologic, ophthalmologic, and cardiovascular procedures in all age groups. The opposing hemodynamic and respiratory effects of each drug may enhance the utility of this drug combination, increasing both safety and efficacy and allowing reduction in the dose of propofol required to achieve sedation.
However, evaluation of the effectiveness of different concentrations of Ketofol in procedural operation regarding changes in hemodynamic, emergence phenomena, recovery time, the doses, and adverse effects was not yet studied, so this randomized, double blinded study was designed to compare the quality of analgesia and side effects of intravenous different concentrations of ketofol in children scheduled for procedural operations.
Methods:
A hundred patients, American Society of Anesthesia (ASA) class I or II scheduled for procedural operation, ages 3 to 12 years were enrolled in this study. After obtaining approval from the local research ethics committee, all patients and their parents were informed about the procedure and the anesthetic technique and an informed written consent was obtained from each. Patients with clinically significant cardiovascular, respiratory, hepatic diseases or epileptic patients, longer procedures more than one hour and sensitivity to the drugs were excluded from the study.
Patients were randomized into two equal groups each of 50 patients going for procedural operation, e.g. esophgoscopy, rectoscopy, bone marrow aspiration and liver biopsy. Pre procedural visit was done to evaluate if that patient fulfils the criteria of study and for fasting instruction. In the preoperative waiting area, an IV catheter was placed after applying emla cream. Baseline measurements included Non Invasive Blood Pressure (NIBP), heart rate, respiratory rate, and pain faces scale which is recommended for children aged 3 years and older (Fig1)(5). The level of sedation was determined by Ramsay Sedation Scale(6). A separate observer who was blind to the drug combination being used assessed the depth of sedation of such patients.
*Ramsay Sedation Scale(6)
Patient is anxious and agitated or restless, or both
Patient is co-operative, oriented, and tranquil
Patient responds to commands only
Patient exhibits brisk response to light glabellar tap or loud auditory stimulus
Patient exhibits a sluggish response to light glabellar tap or loud auditory stimulus
Patient exhibits no response
Fig 1: Pain Faces Scale.
A propofol/ketamine admixture was prepared by an assistant who was not involved in the clinical management of the study patients. According to a prestudy randomization schedule of study group assignment, a ketofol (1:1): propofol 14.285 mg, ketamine 14.285 mg/ml by mixing 10 ml propofol 2% (20 mg/ml) with 4 ml ketamine (50 mg/ml) in group I, while in group II ketofol (4:1): propofol 18.1818 mg , ketamine 4.5454 mg/ml by mixing 10 ml propofol 2% (20 mg/ml) with 1 ml ketamine (50 mg/ml).
Both bolus and maintenance doses were given using syringe pump (B/Braun). Set up for delivery of Ketofol in both groups as an initial bolus of 600 g/kg IV (calculated as dose of propofol in these infusions for simplicity), followed by an initial maintenance infusion at 100 g/kg/min by anesthetist who was blinded to the identity of study infusion.The level of sedation was assessed at 1- 3 minutes intervals, and the initial infusion rate was adjusted (in 25 g/kg/min increments) to achieve Ramsay Sedation Scale of 5 before starting the procedure.
During the procedure, patients were kept on oxygen nasal prongs with a CO2 sampling port. All patients were monitored with NIBP, electrocardiography (ECG), Pulse oximetry(SpO2), heart rate (HR), and end tidal carbondioxide( EtCO2). The measurement started before commencement of the intravenous (IV) line and continued five minutes after induction. The patients were also assessed for apnoea, which was defined as the loss of respiratory efforts for more than 20 seconds or fall of SpO2 below 95%. Complaints of pain/discomfort were treated by an incremental increase in the study drug infusion rate.
The study drug infusion was discontinued at the end of the surgical procedure, and the total drug requirements were noted. After the completion of the procedure, patients were transferred to recovery room when an Aldrete score(7) 9-10 was confirmed, and kept there till ready for discharge. The recovery room nurses were blinded to the study medication received by the patients. The incidence of any episode of postoperative nausea and vomiting (PONV) or any other side effects (e.g. hallucinations, agitation or pain) was noted. The patients vital signs were assessed at 5-min intervals. Patients were considered "ready for discharge" when they had stable vital signs, oriented, able to ambulate unassisted, had no intractable nausea or vomiting, and had minimal pain. Discharge times were determined from the time the study drug infusion was discontinued. Outpatients were given written discharge instructions regarding post-procedure precautions and a telephone number to use in case of emergency.
Descriptive variables were analyzed using Students t-test and X2 test as appropriate using SPSS software statistical computer package version 15. Differences between the groups in mean blood pressure (BP),heart rate( HR), end-tidalCO2, oxygen saturation and ketofol requirements were compared using analysis of variance with repeated measures. A P value < 0.05 was considered to be statistically significant. Values are expressed as meanSD.
Results:
There were no significant differences among patients in both groups regarding number of patients, age, sex, weight, ASA physical status, and duration of ketofol infusion (table 1). There was 2 patients excluded in group I; one had a history of epilepsy and the other was acute lymphocytic leukemia on corticosteroids, while in group II only one patient was excluded due to history of epilepsy (Table 1).
Sedation scores were similar in both groups. The average ketofol initial dose in group I was 600 g /kg followed by an average infusion rate of 116 24 g/kg/min, while in group II the average ketofol initial dose was 600 g/Kg followed by an average infusion rate of 132 36 g/kg/min with a significant difference between groups (P <0.05).
There was a minimal decrease in mean arterial blood pressure (MAP) from baseline in both groups following the initial dose of ketofol. Significant hypotension was noted in 2 patients in group I (4%) and in 3 patients in group II (6%) which was corrected by a bolus of Ringers solution 10 ml/kg IV. The diffrence between the groups was statistically insignificant . All the patients had increase in pulse rate compared to the baseline. The change was least in group II (p <0.05), but no patient had severe tachycardia requiring treatment in both groups.
There was increase in Etco2 in both groups after induction with statistically insignificant difference between groups. Patients in both groups had decrease in arterial oxygen saturation (SpO2) after induction. Five patients (10%) in group I and three patients (6%) in group II had apnea and hypoxia after induction (SpO2 <95%). Excessive salivation was noted in 15 patients (31%) in group I but only two patients (4%) in group II. Eight patients (16%) in group I and two patients (4%) in group II experienced airway obstruction or apnea which required airway support. These changes were statistically significant between both groups.
Table 1. Demographic Characteristics, Intraoperative Management, and Recovery Times of Patients in the Study Groups
Group 1
Group 2
Number
50
50
Age (yr)
6.6 3.6
7 3.1
Weight (kg)
21 8
23 7.5
ASA physical status
(III)
(III)
Duration of infusion (min)
25.312.4
23.8 14.8
Average propofol concentration (mg/ml)
14.3
18.18
Average ketamine concentration (mg/ml)
14.3
4.54
ketofol bolus dose (g /kg)
600
600
Average Ketofol infusion rate (g/kg/min)
116 24
132 36*
Time to ambulation (min)
15.4 9.5
8.2 6.7*
Ready for discharge (min)
26.511.3
15.3 8.4*
Time to actual discharge (min)
38.813.5
28.2 8.9*
-Data are mean SD, median (range).
-Group I propofol/ketamine (1:1), Group II = propofol/ketamine (4:1)
-ASA = American Society of Anesthesiologists.
-Average bolus dose were calculated as dose of propofol in infusion. Average infusion rates were calculated as total drug (propofol) divided by weight and case duration.
* Significant difference (P < 0.05) versus group I.
Two patients in group II (4%) and one patient in group I (2%) had pain and discomfort during the procedure which was overcome by incremental boluses of infusions. In group I, one patient (2%) complained of postoperative nausea, four patients (8%) experienced bad dreams and hallucinations and five patients (10%) complained of agitations with no psychomimetic changes in group II
The time to ambulation in group I and II patients was 15.4 9.5 and 8.2 6.7 minutes respectively, while readiness to discharge was 26.5 11.3 in group I and 15.3 8.4 minutes in group II. The time to actual discharge was 38.8 13.5 minutes in group I and 28.2 8.9 minutes in group II. These changes in recovery timings were statistically significant.
Discussion:
The goals of procedural sedation are to provide an adequate level of sedation while minimizing pain and anxiety, maximizing amnesia, minimizing the potential for adverse drug-related events, controlling behavior, and maintaining a stable cardiovascular and respiratory status. A number of studies have demonstrated that the combination of ketamine and Propofol (ketofol) for sedation is safe and effective. The combination of the two agents appears to reduce side effects of each medication used alone, and allows for a rapid recovery time(1).
We compared the safety and efficacy of different concentrations of ketofol in procedural operations in children. The rate of ketofol infusion in group II was higher than in group I due to due to incremental doses of ketofol given to get the desired depth of sedation and abort pain sensation which was due to less ketamine content in such infusion compared to group I. Propofol in the recommended dose of 2-2.5 mg/kg almost always causes fall in blood pressure and the extent of fall depends upon the dose and adjuvant drugs used. Because we used an initial infusion dose of only 600 g/kg, the fall in MAP was mild (6%) and similar in both groups. The induction doses of propofol are reduced considerably by combination with small doses of ketamine. Ketamine had the additional advantage of better hemodynamic stability. Our results are consistent with Furuya et al and Hui et al who suggested that the minimal change observed in arterial pressure may be dose related and also because sympathomimetic actions of ketamine were effective in counter-acting the hemodynamic depression of propofol. There was a trend for pulse rate to increase after the induction in all the groups, but there was no occurrence of profound tachycardia in any group(8,9).
Akin et al published a trial of 60 patients between one month and 13 years of age undergoing cardiac catheterization who received sedation with propofol or propofol plus ketamine (3:1). They found a significant (decrease in MAP in 11 patients in the propofol monotherapy group and three patients in the ketofol group. They concluded that the addition of low-dose ketamine to propofol preserved MAP without prolonging recovery or increasing the incidence of adverse events(10). While, Goh et al published a 90 patients having a laryngeal mask airway (LMA) placed received propofol with either ketamine (5:1), fentanyl (1 g /kg), or placebo normal saline. They found the ketofol group had a significantly higher systolic blood pressure than the other two groups. They concluded that ketofol provided equivalent LMA insertion conditions while maximizing hemodynamics and minimizing apnea(11).
End-tidal CO2 increased slightly after induction in both groups. In agreement with our results, Mildh et al and Persson et al who reported that ketamine-induced sympathoadrenal activation may account for improved ventilation, also arousal secondary to the subjective side effects of ketamine (e.g., perceptual changes and anxiety) may also contribute (12,13). Also our results have confirmed the previous reports of Frey et al and Badrinath et al (14,15), suggesting that the combination of a small-dose ketamine with propofol improves ventilation during sedation.
We expect that the apnea and desaturation recorded in group I (10%) was due to the excessive salivation complicated the higher dose of ketamine in this group which led to impaired breathing and required airway support in 16% of such patients. While apnea and desaturation which happened in group II could be due to the higher infusion rate of propofol in ketofol combination.
Willman and Andolfatto published a study of 114 patients requiring procedural sedation and analgesia mainly for orthopedic procedures were given a 1:1 mixture of propofol and ketamine. Transient hypoxia occurred in 2.6% of patients, out of them one patient required bag valve mask ventilation. Three patients had an emergence reaction, one of whom received midazolam. No patient had vomiting or aspiration. Procedural success rate in this study without the use of adjunctive medications was 96.5%. Median time until recovery was 15 minutes (range 5 to 45 minutes) (16). Furthermore, Akin et al compared propofol to propofol plus ketamine (3:1) in 60 patients between one and 13 years of age undergoing auditory brainstem response testing. There were no cases of desaturation in the ketofol group, but in the propofol group 4/30 experienced desaturation and 6/30 had apnea. The authors concluded that the addition of low dose ketamine to propofol reduced the risk of respiratory depression and the need for repeat medication administration(17).
The incidence of clinically significant psychotomimetic effects was noted in the large-dose ketamine group (group I). This could be a dose-dependent interaction of the excitatory anesthetic ketamine with a pure central nervous system depressant, such as propofol (18,19). There were no post procedural psychotomimetic symptoms recorded in group II. In addition, the patients mood was significantly better in the recovery room and cognitive function recovered more rapidly in such group than those given higher dose of ketamine. Nagata et al and Mortero et al are coinciding with our results as they suggested that ketamine in sedative doses is associated with electroencephalographic activation. Furthermore, small-dose ketamine increases thalamic sensory output and arousal. Sedative effects of propofol may be partially antagonized by the arousal effects of ketamine(20,21). While Akin et al in a trial of 40 adult patients undergoing endometrial biopsy, reported that the combination of propofol (1 mg/kg) plus fentanyl (1 g/kg) was compared to the combination of propofol plus ketamine (2:1). Time to recovery was similar; however time to discharge was longer in the ketofol group secondary to the increased presence of adverse events including nausea, vertigo, and visual disturbances. These authors concluded that although both regimens seem safe, ketofol (2:1) had more adverse events leading to a longer time until discharge and had a lower overall patient satisfaction(22).
Badrinath et al, published One hundred female outpatients undergoing breast biopsy procedures under local anesthesia received an infusion of a solution containing propofol in combination with different doses of ketamine . The sedative infusion rate was varied to maintain a deep level of sedation and normal respiratory and hemodynamic functions. They reported that combination of propofol and ketamine (5:1) provides effective sedation/analgesia during monitored anesthesia care(15). Our results suggest that our combination propofol and ketamine (4:1) was more suitable in procedural operations as Badrinath et al used their preferred combination (5:1) only in monitored anesthesia care and they supplement their sedation with local anesthesia infiltration.
In conclusion, propofol combined with ketamine (4:1) infusion for procedural operations contributed adequate sedation and analgesia without hemodynamic and respiratory depression or psychotomimetic side effects and appears to be a safe and useful technique for procedural operations in the ambulatory setting.
COMPETING INTERESTS
None Declared
AUTHOR DETAILS
MOHAMED DAABISS, MEDHAT ELSHERBINY, RASHED ALOTIBI, Department of Anesthesia, Riyadh Armed forces Hospital, Kingdom of Saudi Arabia.
CORRESPONDENCE: DR MOHAMED DAABIS, P.O.Box 7897 - D186, Riyadh 11159, Saudi Arabia
Email: madaabiss@yahoo.com
References
Aouad MT, Moussa AR, Dagher CM. Addition of ketamine to propofol for initiation of procedural anesthesia in children reduces propofol consumption and preserves hemodynamic stability. Acta Anaesthesiol Scand; 2008, 52 (4) : 561-5.
Miner JR, Burton JH. Clinical practice advisory. Emergency department procedural sedation with propofol. Ann Emerg Med. 2007;50(2):182-7
Harrison N, Simmonds M. "Quantitative studies on some antagonists of N-methyl D-aspartate in slices of rat cerebral cortex". Br J Pharmacol 1985; 84 (2): 38191.
Trissl LA, Gilbert DL, and Martinez JF: compatibility of propofol injectable emulsion with selected drugs during simulated Y-site administration, Am J Health-Syst Pharm 1997;54:1287-92
Wong DL, Hockenberry-Eaton M, Wilson D, Windelstein ML, Schwartz P. Wong's Essentials of Pediatric Nursing, 6th Edition.St. Louis: 2001; page 1301.
Griffiths RD, Jones C. Recovery from intensive care. British Medical Journal 1999; 319: 427 9.
Furuya A, Matsukawa T, Czaki M, Nishiyama T, Kume M, Kumazawa T. Intravenous ketamine attenuates arterial pressurechanges during induction of anesthesia with propofol. Eur JAnesthesiol 2001; 18: 88-92.
Hui TW, Short TG, Hong W, Suen T, Gin T, Plummer J. Additive interactions between propofol and ketaminewhen used for anesthesia induction in female patients.Anesthesiology 1995; 82: 641-48.
Akin A, Esmaoglu A, Guler G, et al. Propofol and propofol-ketamine in
Goh PK, Chiu CL, Wang CY, et al. Randomized double-blind comparison of ketamine-propofol, fentanyl-propofol and propofol saline on haemodynamics and laryngeal mask airway insertion conditions. Anaesth Intensive Care. 2005; 33:223-8.
Mildh L, Taittonen M, Leino K, KirvelO. The effect of low-dose ketamine on fentanyl-induced respiratory depression. Anaesthesia 1998; 53: 96570.
Persson J, Scheinin H, Hellstrm G, et al. Ketamine antagonizes alfentanil-induced hypo-ventilation in healthy male volunteers. Acta Anaesthesiol Scand 1999; 43: 74452
Frey K, Sukhani R, Pawlowski J, et al. Propofol versus propofol-ketamine sedation for retrobulbar nerve block: comparison of sedation quality, intraocular pressure changes, and recovery profiles. Anesth Analg 1999;89:31721.
Badrinath S, Avramov MN, Shadrick M, et al. The use of a ketamine-propofol combination during monitored anesthesia care. Anesth Analg 2000; 90: 85862
Willman EV, Andolfatto G. A prospective evaluation of ketofol (ketamine/propofol combination for procedural sedation and analgesia in the emergency department. Ann Emerg Med. 2007; 49:23-30.
Akin A, Esmaoglu A, Tosun Z, et al. Comparison of propofol with propofol-ketamine combination in pediatric patients undergoing auditory brainstem response testing. Int J Pediatr Otorhinolaryngol. 2005; 69:1541-1545.
Mori K, Kawamata M, Mitani H, et al. A neurophysiologic study of ketamine anesthesia in the cat. Anesthesiology 1971;35:37383.
Tomoda K, Shingu K, Osawa M, et al. Comparison of CNS effects of propofol and thiopentone in cats. Br J Anaesth 1993;71:3837.
Nagata A, Nakao S, Miyamoto E, et al. Propofol inhibits ketamine-induced expression in the rat posterior cingulate cortex. Anesth Analg1998;87:141620.
Mortero RF, Clark LD, Tolan MM, et al. The Effects of Small-Dose Ketamine on Propofol Sedation: Respiration, Postoperative Mood, Perception, Cognition, and Pain. Anesth Analg 2001;92:1465-9
Akin A, Guler G, Esmaoglu A, et al. A comparison of fentanyl-propofol with a ketamine-propofol combination for sedation during endometrial biopsy. J Clin Anesth. 2005; 17:187-90.
Post-operative urinary retention affects up to 38% of the 200,000 patients undergoing elective TKRs or THRs in the UK every year, according to literature.
Objectives:
This study aims to identify both patient and anaesthetic factors that predispose to urinary retention, and in doing so develop a protocol of pre-operative urinary catheterisations that will minimize its incidence and subsequent complications, as well as hasten patient recovery and discharge.
Methods:
Analysis of prospectively collected data of 54 patients over a three-month period at a British district general hospital.
Results:
10% of patients in the study developed urinary retention, and 60% of these developed renal failure complicating recovery and lengthening stay. All were male, and a history of renal disease and a current elevated serum creatinine were identified as common factors in these patients.
Conclusions:
A protocol of pre-operatively catheterizing males with either a history of renal disease or a current elevated creatinine is suggested – this would potentially reduce incidence rates of urinary retention by 80% whilst only increasing the rate of unnecessary catheterizations by 2%.
Introduction:
Every year, approximately 200,000 people undergo elective total hip and knee replacement surgery in the UK 1. There is limited available literature on the incidence of post-operative urinary retention and even less regarding the onset of subsequent renal failure which, besides posing immediate medical problems, necessitates treatment and can significantly prolong recovery – all of which have personal and financial implications for both patient and healthcare trust.
Summary of Current Literature:
Surprisingly little research is available which offers data on the association on the incidence of, risk factors for, and associations with urinary retention for patients undergoing elective total hip or knee replacement surgery. The following table summarises seven studies conducted between 1980 and 2007:
Study
Year
n
Males
Females
Retention
Sepsis
TKR
THR
Overall
Wroblewski & Del Sel 2
1980
195
195
6.20%
Waterhouse et al. 3
1987
103
103
0
10.70%
O' Riordan et al. 4
2000
116
47
69
18.10%
Kumar et al. 5
2004
19%
22%
0.93%
Cronin et al. 6
2005
118
118
0
38.10%
Kumar et al. 7
2006
142
19.70%
2.10%
Lingaraj et al. 8
2007
119
10
109
10%
Analysing the available literature, the following conclusions can be made.
Males are more likely than females to develop urinary retention.
Risk factors include a history of urinary retention, the use of epidural analgesia and patient-controlled analgesia (PCA).
Retention rates varied between 10% and 38.1% (mean 19.6%).
Deep sepsis rates varied between 0.93% and 2.1% in the total post-operative group, rising to 6.2% in those developing urinary retention.
Objectives:
This study aims to develop a policy of pre-operative catheterisation, anaesthetic technique and post-operative analgesia in patients undergoing elective total hip and knee replacement surgery that will:
Minimize the incidence of urinary retention.
Minimize the incidence of subsequent complications.
Hasten patient recovery and discharge.
Methods:
A prospective study was conducted between February and April 2008 in the operating theatres and on the Orthopaedic wards at Bedford Hospital, a district general hospital in Bedfordshire, UK. Data was collected that would enable the following questions to be addressed:
Are these patients catheterised pre-operatively?
Of those who are not, how many develop urinary retention?
Is any particular anaesthetic technique associated with an increased incidence of retention?
Is antibiotic prophylaxis administered for catheterisation?
How frequently does renal failure arise in those patients who develop urinary retention?
Can a protocol be created which might reduce the incidence of retention?
How effective and efficient would this be?
54 patients undergoing elective total hip and knee replacements were recruited into the study. Of these, 4 were catheterised pre-operatively and hence were excluded (n = 50).
Data Collection:
The primary source of data collection was from patients’ notes and anaesthetic charts, assessed pre- and post-operatively. Data was gathered in the following areas:
Demographics – Name, Age, Sex
ASA Classification – 1 to 4
History of Renal disease
History of Urological disease
Pre-operative Creatinine
Nature & Date of Operation
Type of Anaesthetic Technique employed
Onset of post-operative Urinary Retention necessitating catheterization
Duration of Epidural Analgesia (if applicable)
Administration of Antibiotic Prophylaxis for catheterization
Progress from urinary retention to Renal Failure
Results:
As mentioned, 4 of the original 54 patients were excluded from the study as they had already been catheterised pre-operatively. All were female, 75% of whom were over the age of 80; it appears that the main indication for pre-operatively catheterisation was existing urinary incontinence.
There was a female preponderance amongst the sample population, with females outnumbering males by a ratio of 3 to 2. In terms of the sample population’s co-morbidities and anaesthetic risk, the majority of patients were classified as ASA 2 (60%) by the assessing anaesthetist, with ASA 3 patients (26%) outnumbering ASA 1 patients (14%) by a ratio of approximately 2 to 1 in the remainder. Over the period covered, knee replacements (70%) outnumbered hip replacements (30%) by a ratio of 7 to 3.
A range of anaesthetic techniques were employed, including:
Combined Spinal Epidural (CSE)
Spinal Anaesthetic (Spinal)
General Anaesthetic + Epidural (GA + Epidural)
General + Spinal Anaesthetic (GA + Spinal)
General Anaesthetic + Lumbar Plexus Block (GA + LPB)
General Anaesthetic + Femoral Nerve Block (GA + FNB)
General Anaesthetic +/- Patient Controlled Analgesia (GA + PCA)
Spinal anaesthetics appeared to be most commonly employed, either alone or in conjunction with a general anaesthetic. GAs in combination with a nerve block was also often used, followed by CSEs.
In total, there were a total of 5 cases of post-operative urinary retention, all of which necessitated catheterisation. This results in an incidence rate of 10% across elective total hip and knee replacements. Of these anaesthetic techniques, spinal anaesthesia was associated with the highest risk of post-operative urinary retention (22.2%), followed by GAs (20%), CSEs (14.3%) and GA + FNBs (14.3%). No cases were reported for patients who underwent GA + Spinals (n = 13), GA + LPBs (n = 8) or GA + Epidurals (n = 1).
Of those patients who had undergone epidural anaesthesia, whether in combination either with a GA or a spinal, no documentation was found regarding the duration for which they had been active in 25% of cases. In the remainder, the epidural had been functional for less than 24 hours in 50% of cases.
All five patients who developed post-operative urinary retention were male; three of whom were below the age of 80. Only three of these patients received the recommended antibiotic prophylaxis on catheterisation (60%), and on following up their subsequent inpatient progress and serum creatinine, it appeared the same number progressed to renal failure (60%).
Analysis:
Two factors were identified in this study which may have predisposed these five patients into developing post-operative urinary retention. The first is a history of renal disease – 4% of the total sample had such a history (n = 2) and both went on to develop retention. The second is a currently elevated serum creatinine – 6% of the total sample had this at the time of surgery (n = 3), and of these, two went on the develop retention. The remaining patient who developed retention had neither of these risk factors.
The table below compares the results found in this study with those described in existing literature, namely the aforementioned publications. As can be seen, the post-operative urinary retention rate was on the lower extreme of that noted in the literature; only the studies by Waterhouse et al.3 and Lingaraj et al.7 demonstrated similar rates.
Factor
Study
Literature
Pre-op Cath Rate
7.4%
Unknown
Post-op Retention Rate
10%
10 - 38.1%
Hx of Renal Disease
Increased
Unknown
Elevated Creatinine
Increased
Unknown
Male Incidence
Increased
Increased
Epidural Incidence
Average
Increased
This study concurred with the existing opinion that males have a higher incidence of retention, but the study population was insufficient to draw any specific conclusions regarding the influence of epidural anaesthesia on post-operative urinary retention. It was noted however, that in half of the cases for which data was available, the epidural was functional for less than 24 hours – one might argue that the risk/benefit ratio of epidural anaesthesia would cause it to be a relative contraindication if only employed for relatively short durations, particularly if the patient is admitted to a ward on which nursing staff are unfamiliar with its care.
Conclusions:
Existing literature fails to comment upon the impact of the aforementioned risk factors for retention highlighted in this study, namely a history of renal disease and a current elevated serum creatinine. However, these two factors in conjunction with the increased incidence in males allows for the creation of a system by which patients who are at high risk of developing post-operative urinary retention may be successfully identified and catheterised pre-operatively, hence preventing the problem from arising.
If a protocol had been established in which males with either of these two factors were catheterised pre-operatively, 5 patients from the sample population of 50 would have qualified; this includes 4 of the 5 patients who developed urinary retention post-operatively. In addition, only 1 patient who did not develop urinary retention post-operatively would have met these criteria and been unnecessarily catheterised pre-operatively. These figures are demonstrated in the graph below.
On the basis of these findings, one can deduce that a protocol indicating pre-operative catheterisation in males with either a history of renal disease and a current elevated serum creatinine undergoing total hip and knee replacement surgery would have a profound impact on the incidence of post-operative urinary retention, essentially reducing it by 80%. Unnecessary catheterisations as a result of this protocol would be minimal, affecting only 2% of patients.
Although this study has obvious limitations in terms of its size and its single-centred nature, findings were comparable to existing literature and are likely to be representative of incidence rates on a national, if not international basis. Further research, ideally with a larger population spread across multiple centres would allow for more accurate data to be collected, which in turn would allow for a more effective and efficient protocol to be developed.
COMPETING INTERESTS
None Declared
AUTHOR DETAILS
SUMIT DUTTA, MBBS, Speciality Trainee Registrar in Emergency Medicine, Bedford Hospital, United Kingdom
CORRESPONDENCE: Sumit Dutta, Specialty Trainee Registrar in Emergency Medicine, Bedford Hospital, Kempston Road, Bedford, MK429DJ, United Kingdom.
Waterhouse N, Beaumont AR, Murray K, Staniforth P, Stone MH. Urinary Retention after Total Hip Replacement. A Prospective Study. Journal of Bone and Joint Surgery, British Volume. 1987 Jan; 69 (1): 64-6
O’Riordan JA, Hopkins PM, Ravenscroft A, Stevens JD. Patient controlled analgesia and urinary retention following lower limb joint replacement: prospective audit and logistic regression analysis. European Journal of Anaesthesiology. 2000 Jul; 17 (7): 431-5
Kumar P, Mannan K, Chowdhury AM, Kong KC, Pati J. Urinary retention following arthroplasty. Urology, 2005 Sep; 66(3); Supp I: 22
Cronin JJ, Shannon FJ, Bale E, Quinlan W. Prediction of post-operative urinary retention following hip and knee arthroplasty in a male population. European Journal of Orthopaedic Surgery and Traumatology. 2007 Jan; (17): 47-50
Kumar P, Mannan K, Chowdhury AM, Kong KC, Pati J. Urinary retention and the role of indwelling catheterization following total knee arthroplasty. International Brazilian Journal of Urology 2006 Jan-Feb; (32): 1
Lingaraj K, Ruben M, Chan YH, De Das S. Identification of risk factors for urinary retention following total knee arthroplasty: a Singapore hospital experience. Singapore Medical Journal. 2007 Mar; 48 (3): 213-6
Introduction: Since Longo first described it in 1998, Stapled Haemorrhoidectomy (SH) has been emerging as the procedure of choice for symptomatic haemorrhoids (1). Several studies have shown it to be a safe, effective and relative complication free procedure (2). The aim of this study was to determine the suitability of SH as a day case procedure at a District General Hospital.
Methods From June 2001 to May 2005, 66 patients who underwent stapled haemorrhoidectomy were included in this study. Parameters recorded included post-operative complications, analgesic requirements, cost effectiveness, duration of hospital stay and patient satisfaction. Follow-up was performed at 4 weeks with a further telephone follow-up up to 4 years after.
Results Of the 66 patients that underwent a stapled haemorrhoidectomy 43 (65%) were male and 23 (35%) were female. The mean age was 49.8 years (range 16-78 years). 11% (n=7) of patients were discharged the same day and 88% (n=58) had overnight stay. Nearly 50% had complete resolution of symptoms and returned to work within a week. The satisfaction data showed that 90% of patients were completely satisfied with the procedure at initial follow-up, which increased to 98% after 6 months-4 years follow-up.
Conclusion Our present study shows that stapled haemorrhoidectomy is a safe and very well tolerated procedure with low post-operative analgesic requirements, high patient satisfaction and early return to work. The majority of patients could avoid an overnight stay which would make this procedure suitable for day surgery.
Introduction
Since Longo first described it in 1998 (1), Stapled Haemorrhoidectomy (SH) has been emerging as the procedure of choice for symptomatic haemorrhoids. Several studies have shown it to be a safe, effective and relative complication free procedure with fewer days off work, reduced requirement for analgesia and rapid discharge (2-4). Historically symptomatic haemorrhoids have been dealt with by simple dietary modification, injection sclerotherapy, cryotherapy, band ligation and surgery (5-7).
Unfortunately there is no single optimum therapeutic option. Surgery for symptomatic haemorrhoids was popularised by the open Milligan–Morgan technique in the late 1930’s or one of its variations. Unfortunately, this has been associated with postoperative pain, the risk of severe haemorrhage, and more concerning the risk of anal stenosis (especially if skin bridges are not maintained) and sphincter injury.
Controversy exists as regards to the overall safety and acceptability of SH. On the one hand recent reports of SH have been positive especially in regards reduced postoperative pain and recovery and adverse functional sequelae. A study by Pavlitidsi et al (8) included 80 patients with second to fourth degree hemorrhoidal disease in which patients were randomly allocated to undergo either the stapled Longo procedure (group 1) or Milligan-Morgan hemorrhoidectomy (group 2) under epidural anesthesia. SH had better postoperative pain scores with lower mean epidural morphine requirement and mean hospital stay. Conversely, a recent review from New Zealand (9) suggested that SH was more expensive, and the results should be looked upon with caution.
Several studies have suggested that SH may be safely performed as a Day case procedure. Patients following SH had reduced, post operative pain, hospital stay, analgesic requirements and earlier return to work (21-23). Day Surgery procedures have been at the forefront of recent changes within the NHS in the fight to reduce waiting times and better patient care. It is not only popular with patients who are able to recover and convalesce at home in a familiar environment but also reduce the chances of a hospital acquired infection and large cost saving implications for the NHS. However, not every surgical procedure is amenable for Day surgery, and thus procedures which require only moderate amounts of analgesia, reduced post operative stay and few complications and further in 2001 the Audit Commission included Haemorrhoidectomy as one of its 25 procedures suitable for Day Surgery (24).
Therefore the present study was to look critically at the learning curve, operative complications, duration of hospital stay, analgesic requirements, cost effectiveness and patient satisfaction in at the personal series of the first 66 patients who underwent SH at Watford General Hospital, a District General Hospital in Hertfordshire, United Kingdom. The aim of the present work was to determine the suitability of SH as a routine day surgery procedure which is not routine in the UK.
Patients and Methods
From June 2001 to May 2005, 66 patients who underwent stapled haemorrhoidectomy were included in this study. It was routine practice that stapled haemorrhoidectomy was performed by one dedicated surgical team (JIL).
Informed consent was obtained in writing prior to surgery. During induction at least a single dose of prophylactic antibiotics (of either a third generation cephalosporin or co-amoxiclav) was administered.
In brief, under general anaesthesia, the patient is put in lithotomy position and a rigid sigmoidoscopy done to exclude any rectal lesions. Stay-sutures with 2-0 silk are applied at the 3, 6, 9 & 12 o’clock. The anus is dilated using with a proctoscope.
An anal ring is applied and fixed to the anal verge by the previously taken stay-sutures. The inner end of the ring must be reaching beyond the dentate line.
Purse-strung sutures are taken all around the anal mucosa on top of the haemorrhoids (beyond the dentate line) followed by a per-rectal examination to make sure that the muscle layer is not taken within the sutures so as to avoid postoperative anal stenosis. Similarly, in female patients, per-vaginal examination is done to insure that vaginal wall is not taken within the sutures. A specialized circular stapler is introduced into the anal canal and the two ends of the purse-strung sutures are passed through special holes in the stapler and tied. Stapler is tightened (the indicator reads between 3 & 4 cm depth) and fired. The stapler is kept closed in place compressing them for 30 seconds in order to encourage haemostasis. The staples line then is checked for bleeding points, for which 2/0 vicryl under-running sutures may be use for further haemostasis. Finally, the anus is packed with ‘spongistan’ as well as flagyl and voltarol suppositories.
Post-operatively both groups were discharged when comfortable. Complications where noted as they occurred during the follow-up period at 4 weeks. Furthermore, a further telephone follow-up during July 2005 was done results from the survey are shown in table II.
The data was reviewed and analysed in conjunction with our department of medical statistics. Analysis was performed using the Mann-U test. Multivariate analysis of the means was performed using the Krushal-Wallis Test.
Results
Of the 66 patients that underwent a stapled haemorrhoidectomy 43 (65%) were male and 23 (35%) were female. The mean age was 49.8 years (range 16-78 years). Only 7 patients suffered with hypertension and one with diabetes mellitus.
There presenting complaints included rectal bleeding (bright red) in 86% (n=57) and pain and discomfort 53% (n=35). Other complaints included a sensation of something coming down (n=3), change in bowel habit (n=2), constipation (n=1), and incontinence (n=1).
All patients underwent evaluation with proctoscopy and rigid sigmoidoscopy. Further evaluation with colonoscopy (14%, n=9), flexible sigmoidoscopy (9%, n=6), barium enema (9%, n=6) and anorectal MRI (1%, n=1) to rule out other associated pathologies accounting for their symptoms.
Previous to SH, 57 patients (87%) had undergone previous therapeutic manoeuvres in the form of injection sclerotherapy (76%) and banding of haemorrhoidal tissue (11%).
The operating time ranged between 15-40 minutes with an average of 24 minutes. There were no major complications although the majority of patients warranted oversewing of bleeding points around the staple line after the stapling procedure.
Post-operative hospital stay revealed that 88%, (n=58) went home after overnight stay (within 24 hours) and only 1 patient had a 48 hours stay with only moderate strength analgesics (Voltarol) (Table 1).
At routine follow-up at 1 month, we found that nine patients (14%) had had minor degrees of faecal urgency, frequency and soiling rectal bleeding, all of which subsequently resolved. Only one patient had developed a peri-anal heamatoma, which was evacuated under local anaesthesia in the Outpatient Department. Further, only two patients had significant problems. One patient complained of pain and discomfort at four-week follow-up, which we think resulted from too low application of the stapler which resolved completely over a six month period with simple analgesics and a single case of rectal stenosis resulting from too high a stapling, which was referred to a specialised centre for further management (Table 2).
Indeed, only 3 patients had recurrence of symptoms, which were treated with further sclerotherapy injection in the Out-patients department and one requiring re-stapled haemorrhoidectomy.
Follow-up was in the form of Out-patient review 4-6 weeks after the procedure and a telephone questionnaire up to 4 years after the operation the results of which are shown in Table 3-5. We can see that a third of the patients did not require or use analgesia after discharge and further 44% (n=29) needed just Voltarol. As regards to symptoms we can see that approximately two thirds of patients where off analgesics, and half had complete resolution and returned to work within a week. The satisfaction data shows that the immediately 90% of patients were completely satisfied with the procedure which increased to 98% on our follow up (6 months-4 years).
Discussion
The present study shows that stapled haemorrhoidectomy is a safe and very well tolerated procedure which is amenable for Day Case Surgery. We have shown that this approach is significantly quicker than the classical conventional haemorrhoidectomy and better tolerated with reduced post-operative pain and analgesic requirements, good patient satisfaction and early return to work. Further the vast majority of patients (65/66) were discharged after overnight stay with mild and moderate oral analgesics. We have now adopted this as our technique of choice for haemorrhoidal disease.
The optimal mode for haemorrhoidal disease has been an ongoing debate for over 20 years and can be achieved by either open conventional Milligan Morgan and associated procedures and more recently stapled haemorrhoidectomy. Open haemorrhoidectomy has been associated with pain, discomfort, anal stenosis and a poor satisfaction scores (13-14). Several randomised clinical trials have compared Open haemorrhoidectomy with SH and have suggested an advantage with SH (2,3,15,16) however due to the fact that this is a new procedure there is a paucity of long term data.
In our study we looked at the complications and patient related factors associated with SH these are shown on Tables 3-5. Minor complications included rectal bleeding, fecal urgency and perianal hematoma all of which resolved conservatively. One must note that although every effort is made to ensure that at the end of the procedure the operating site is haemostatically secure some passage of blood per rectum is considered inevitable, our data is from patient self assessments who may interpret this differently. We were unable to consistently quantify this and relied upon patient testimonies. Also Van De Stadt (12) noted a 55% rate of persistent or recurrent symptoms as well as a 20% requiring recurrent or redo surgery and Thaha et al (11) showed post-defecation syndrome rate of 4%.
Major complications associated with SH have been reported mainly in the form of case reports. In our series of 66 patients we had only two major complications. One patient had quite a lot of pain and discomfort post-operatively and upon assessment in the Out-patient department it was found that the staple line was too low (i.e. less than 3 cms) and this may be encroaching on the dentate line. Fortunately the patient was very tolerant and resolved over six months with moderate analgesics. Furthermore, our other major complication the patient developed rectal stenosis and was referred to a specialised unit where he underwent a resection. We feel that this patients staple line was too high (i.e. above 4 cms). Thus the message is that although SH is a simple procedure the critical step is the application of the purse-string so that the staple line is between 3-3.5 cms as complications can arise if you are too high or too low which was recently confirmed in a study of acute haemorrhoidal crisis (17).
Several papers have expressed concern with post-operative pain, faecal urgency after SH (18-19). This has been postulated to be due to incorporation of the muscle layers in the purse-string. However a recent paper by Kam et al (20) in a series of 33 patients found no association between amount of resected muscle and incontinence. Indeed, it is important to keep the purse-string suture superficial and not encroaching on the other bowel wall layers.
Our study shows good patient satisfaction scores and symptom control (Tables 3-5). We have shown that almost all 98% (65/66) of patients were discharged after a maximum overnight stay. This has huge cost saving consequences and although the equipment costs are high for SH this is compounded by a short duration of the operation, shorter hospital stay, reduced analgesic requirement and quicker return to work with the Health Service coming up on top overall. Of note, we can see that over 50% (n=34) of patients were back to work within a week of the operation and this is further supported by the fact that the majority of patients required simple analgesics for short durations.
This study highlights the excellent results after SH, with all the advantages such as reduced pain and hospital stay, and an earlier return to work. Importantly there does not seem to be a learning curve and once a surgeon has attended a training day or supervised there seems to be no increase in complications. The complication rates are low and as we have shown earlier only a single complication requiring intervention.
In conclusion, our study demonstrates that the SH is a safe, effective and well tolerated procedure which seems to have all the requirements for Day case surgery. We have also shown that it is quick procedure and post operatively less painful and requiring only simple analgesia for a short period. Thus we have adopted this technique as our procedure of choice and will consider it as a Day Case prodedure for symptomatic haemorrhoidal disease.
Table 1 : Duration Of Stay
Same Day
7
Overnight
58
2 Days
1
Total
66
Table 2 : Complications
Minor
Rectal Bleeding
9
Faecal Urgency
10
Perinanal Hematoma
1
Periananl Lump
1
Total
21
Major
Pain And Discomfort
1
Rectal Stenosis
1
Total
2
Table 3 : Analgesia
Nil
22
Pracetamol
8
Voltarol
29
Coproxamol
4
Paracetamol & Voltarol
3
Total
66
Table 4 : Analgesia
Duration Of Analgesics
Complete Resolution
Return To Work
Nil
22
0
20
<1 Week
20
30
14
1-2 Weeks
16
22
24
>2 Weeks
6
14
8
Table 5 : Patient Satisfaction
Immediate
4-6 Weeks
>6 Months
Satisfied
90%
95%
98%
Not Satisfied
10%
5%
2%
COMPETING INTERESTS
None Declared
AUTHOR DETAILS
PROFESSOR AA RIAZ BSc FRCS(I) FRCS (Eng) FRCS(Gen) PhD, Watford General Hospital, United kingdom
CORRESPONDENCE: Professor AA Riaz, Department of Surgery, Watford General Hospital, Vicarage Road
Watford Hertfordshire, WG1, UK.
Tel: 01923-244366 ext 7692
Fax: 01923-217962
Email: mrariaz@hotmail.com
References
1. Longo A. Treatment of haemorrhoidal disease by reduction of mucosa and haemorrhoidal prolapse with a circular stapling device: a new procedure. 6th World Congress of Endoscopic Surgery. Mundozzi Editore: Naples, 1998;777-84.
2. Boccasanta P, Capretti PG, Venturi M, Cioffi U, De Simone M, Salamina G, Contessini-Avesani E, Peracchia A. Randomised controlled trial between stapled circumferential mucosectomy and conventional circular hemorrhoidectomy in advanced hemorrhoids with external mucosal prolapse. Am J Surg. 2001;182(1):64-8.
3. Shalaby R, Desoky A. Randomized clinical trial of stapled versus Milligan-Morgan haemorrhoidectomy. Br J Surg. 2001 Aug;88(8):1049-53.
4. Ascanelli S, Gregorio C, Tonini G, Baccarini M, Azzena G. Long stapled haemorrhoidectomy versus Milligan-Morgan procedure: short- and long-term results of a randomised, controlled, prospective trial. Chir Ital. 2005 Jul-Aug;57(4):439-47.
5. Alonso-Coello P, Guyatt G, Heels-Ansdell D, Johanson J, Lopez-Yarto M, Mills E, Zhou Q, Alonso-Coello P. Laxatives for the treatment of hemorrhoids. Cochrane Database Syst Rev. 2005 Oct 19;(4):CD004649.
6. Ramzisham AR, Sagap I, Nadeson S, Ali IM, Hasni MJ. Prospective randomized clinical trial on suction elastic band ligator versus forceps ligator in the treatment of haemorrhoids. Asian J Surg. 2005 Oct;28(4):241-5.
7. Hardy A, Chan CL, Cohen CR. The surgical management of haemorrhoids--a review. Dig Surg. 2005;22(1-2):26-33.
8.Pavlidis T, Papaziogas B, Souparis A, Patsas A, Koutelidakis I, Papaziogas T. Modern stapled Longo procedure vs. conventional Milligan-Morgan hemorrhoidectomy: randomized controlled trial. Int J Colorectal Dis.2002;17(1):50-3.
9. Hill A. Stapled haemorrhoidectomy--no pain, no gain? N Z Med J. 2004 8;117(1203):U1104.
10. Peng BC, Jayne DG, Ho YH. Randomized trial of rubber band ligation vs. stapled hemorrhoidectomy for prolapsed piles. Dis Colon Rectum. 2003;46(3):291-7; discussion 296-7.
11. Shanmugam V, Thaha MA, Rabindranath KS, Campbell KL, Steele RJ, Loudon MA.Rubber band ligation versus excisional haemorrhoidectomy for haemorrhoids. Cochrane Database Syst Rev. 2005 Jul 20;(3):CD005034. Review.
12. Van de Stadt J, D'Hoore A, Duinslaeger M, Chasse E, Penninckx F; Belgian Section of Colorectal Surgery Royal Belgian Society for Surgery. Long-term results after excision haemorrhoidectomy versus stapled haemorrhoidopexy for prolapsing haemorrhoids; a Belgian prospective randomized trial. Acta Chir Belg. 2005 Feb;105(1):44-52.
14. Arroyo A, Perez F, Miranda E, Serrano P, Candela F, Lacueva J, Hernandez H, Calpena R.Milligan-Morgan haemorrhoidectomy with ultrasonic scalpel. G Chir. 2003;24(11-12):422-7.
15. Khalil KH, O'Bichere A, Sellu D. Randomized clinical trial of sutured versus stapled closed haemorrhoidectomy. Br J Surg. 2000;87(10):1352-5
16. Hetzer FH, Demartines N, Handschin AE, Clavien PA. Stapled vs excision hemorrhoidectomy: long-term results of a prospective randomized trial. Arch Surg. 2002 ;137(3):337-40.
17. Kang JC, Chung MH, Chao PC, Lee CC, Hsiao CW, Jao SW.Emergency stapled haemorrhoidectomy for haemorrhoidal crisis. Br J Surg. 2005;92(8):1014-6.
19. Rowsell M, Bello M, Hemingway DM. Pain after stapled haemorrhoidectomy. Lancet. 2000 Dec 23-30;356(9248):2188; author reply 2190
20. Ravo B, Amato A, Bianco V, Boccasanta P, Bottini C, Carriero A, Milito G, Dodi G, Mascagni D, Orsini S, Pietroletti R, Ripetti V, Tagariello GB. Complications after stapled hemorrhoidectomy: can they be prevented? Tech Coloproctol. 2002;6(2):83-8.
21. Law WL, Tung HM, Chu KW, Lee FC. Ambulatory stapled haemorrhoidectomy: a safe and feasible surgical technique. Hong Kong Med J. 2003 Apr;9(2):103-7,
22. Ong CH, Chee Boon Foo E, Keng V. Ambulatory circular stapled haemorrhoidectomy under local anaesthesia versus circular stapled haemorrhoidectomy under regional anaesthesia. ANZ J Surg. 2005 Apr;75(4):184-6.
23. Ascanelli S, Gregorio C, Tonini G, Baccarini M, Azzena G. Long stapled haemorrhoidectomy versus Milligan-Morgan procedure: short- and long-term results of a randomised, controlled, prospective trial. Chir Ital. 2005 Jul-Aug;57(4):439-47
24. Royal College of Surgeons of England (1992) Guidelines of day case surgery (revised edition), London: RCS.


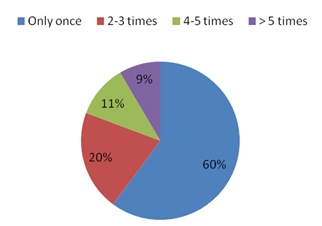

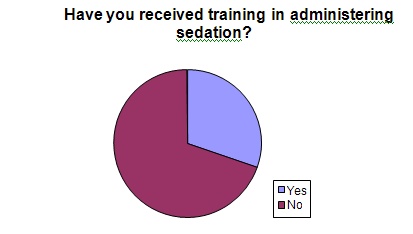
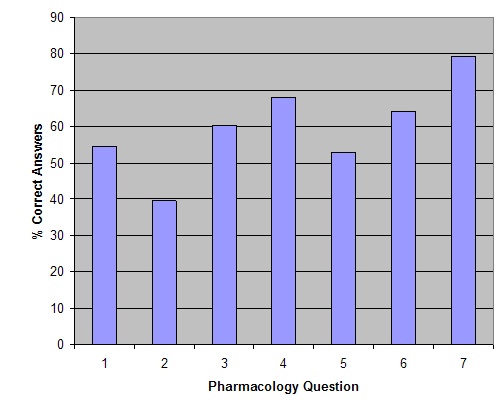
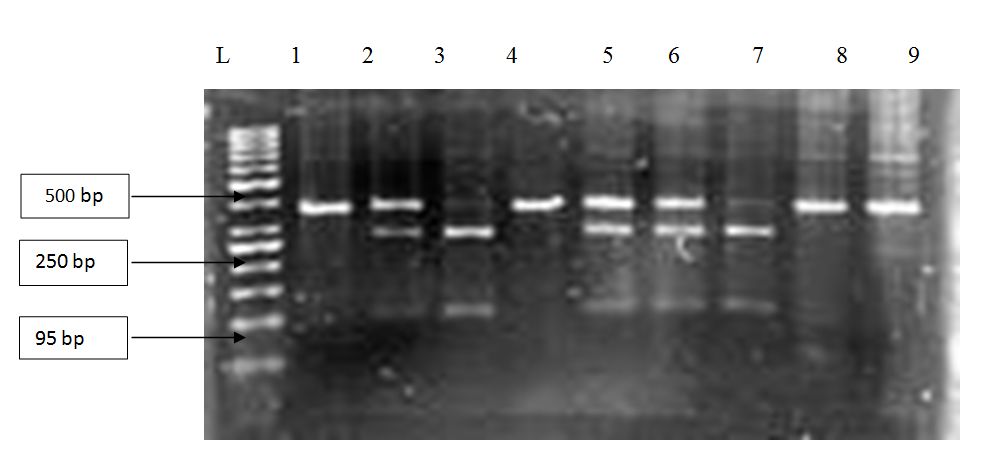
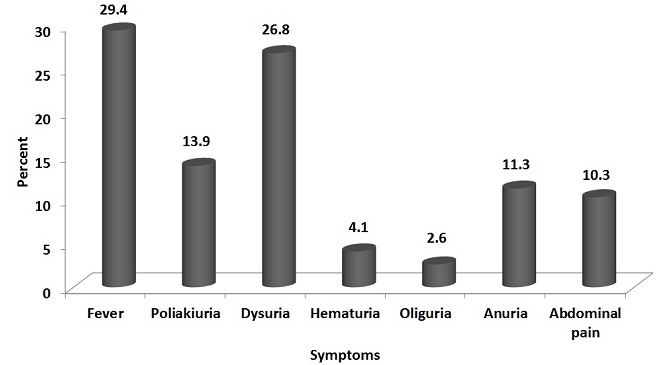
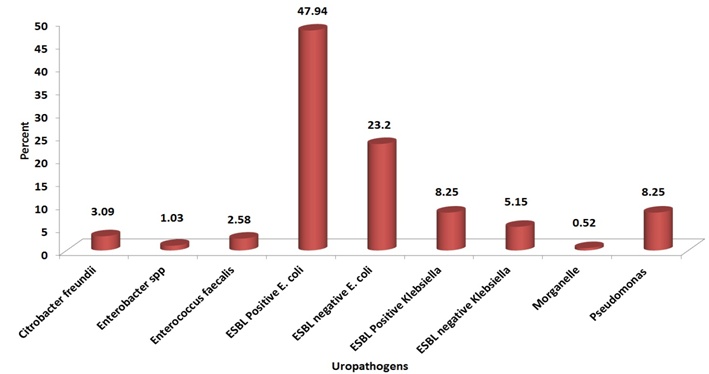
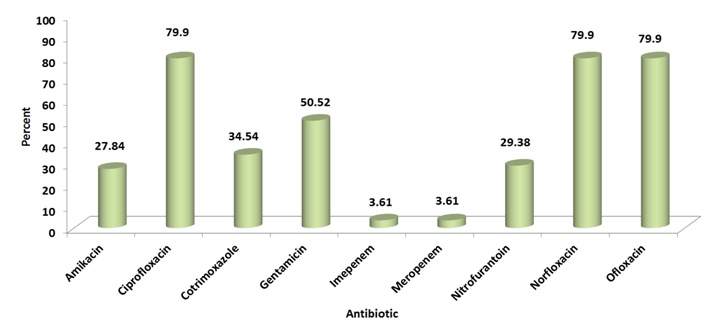
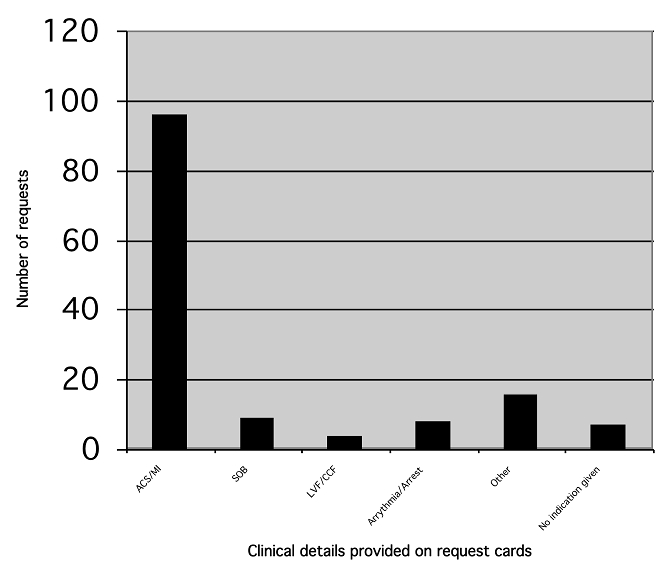

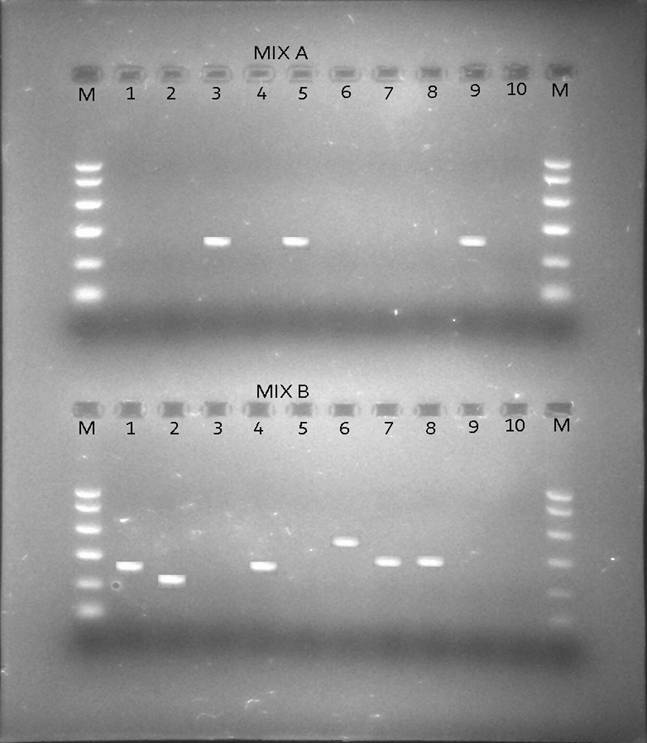
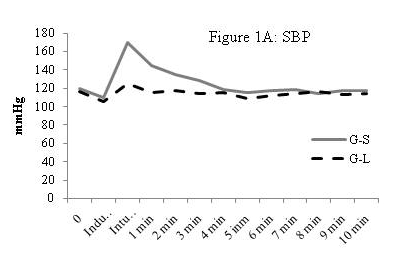
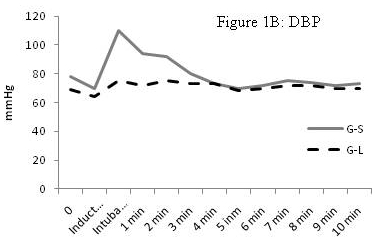
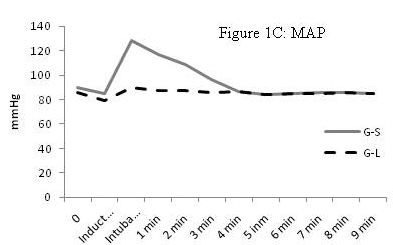
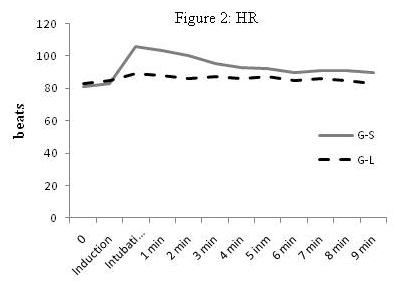
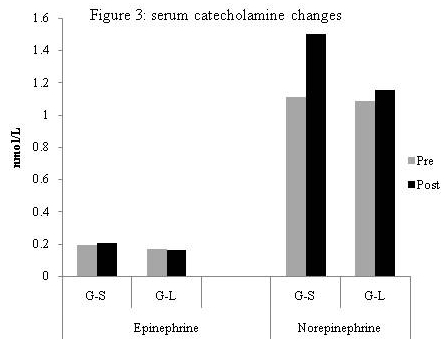
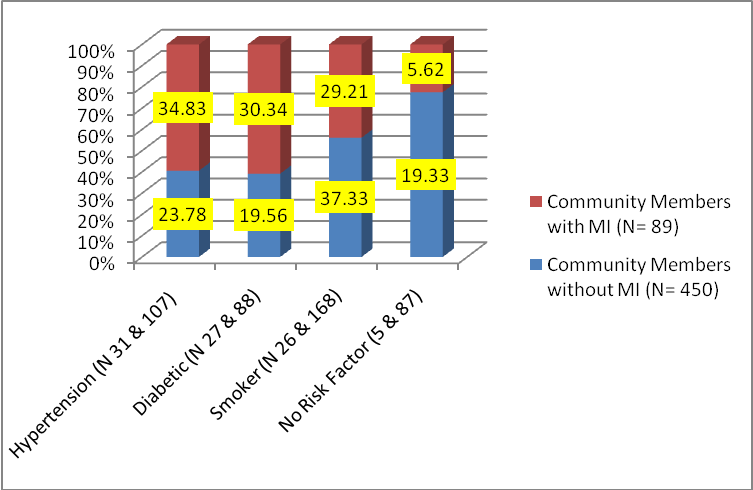
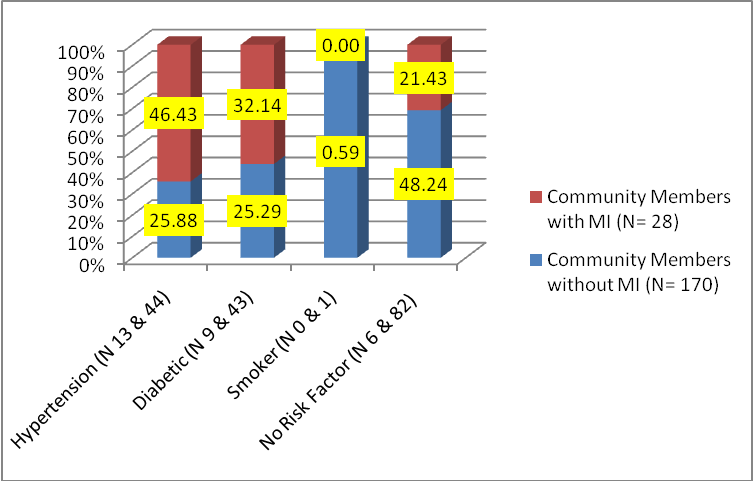 (Fig.2) Distribution of Risk Factors in Females with and without MI (The total number of responses are more than number of respondents because of more than one risk factor being present in many respondents) Combination of risk factors Out of 48 males with MI, 22 (45.83%) had both diabetes and hypertension and half of them (22.92%) were also smokers. The next group among males having multiple risk factors were that of smokers 14 (29.17%), out of which half (14.58%) also had hypertension. Out of 22 females with MI, 13 (59.09%) had hypertension and 27.27 % out of them were also diabetic. The next group was that of diabetics 3 (13.64%). Hence looking at the combination of risk factors in both males and females with MI the most common risk factor in terms of prevalence was found to be hypertension followed by smoking in men and diabetes in women. As Hypertension and BMI in age group of 35 to 54 years were found to be significant and commonly present risk factors, the data was further explored. Systolic BP 140 and above: The percentage of persons with MI having a systolic BP of 140 and above in the age group 35 to 54 years was more than double in comparison to the percentage expected by number of persons present in this age group that is 66.67% as stated in Fig.3, against 30% as stated above in Table1. Hence in this age group there appears to be considerable opportunity of detecting and treating cases of hypertension in the general community before they reach to the advanced stage of coronary artery disease and MI.
 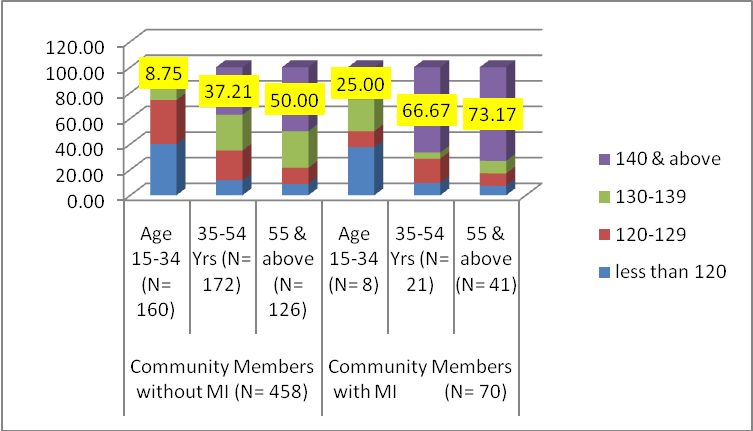 (Fig.3) Age wise distribution of blood pressure (both sexes) Body Mass Index: As presented below in Fig.4, the percentage of overweight and obese individuals were found to be 5 to 9 percent higher in those with MI than those without MI. The percentage of obese people increased by 2 times in both the groups that is with and without MI as age advanced to 35-54 years from 15-34 years. The percentage of overweight individuals was 1.48 times in those without MI and 1.77 times in those with MI in age group 35-54 years in comparison to the age group of 15-34 years.
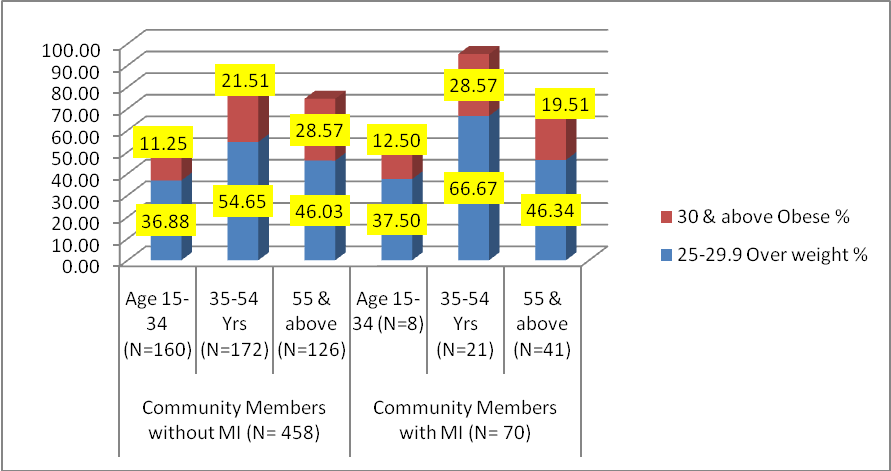

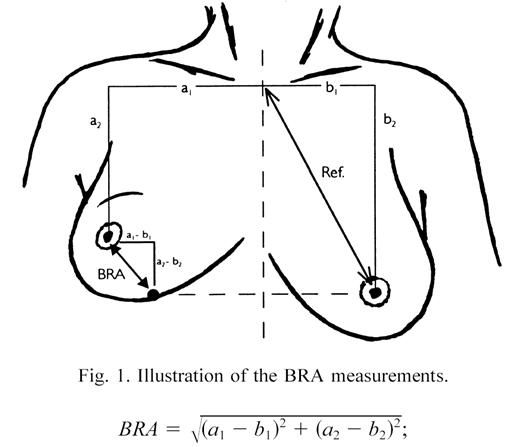
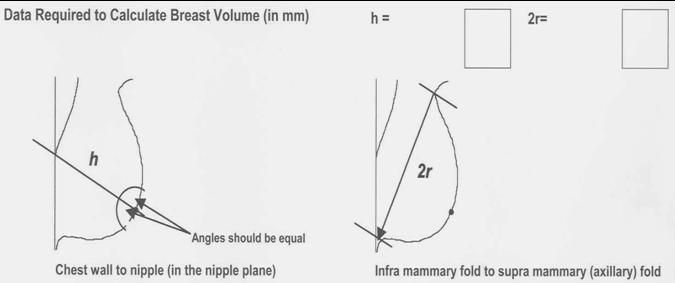

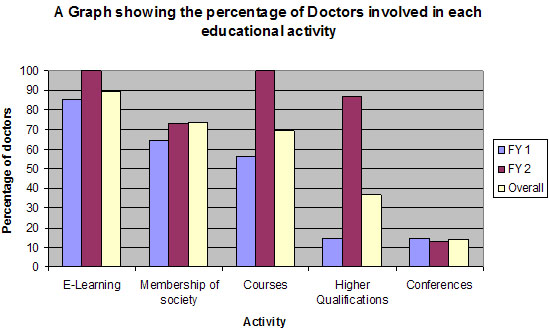
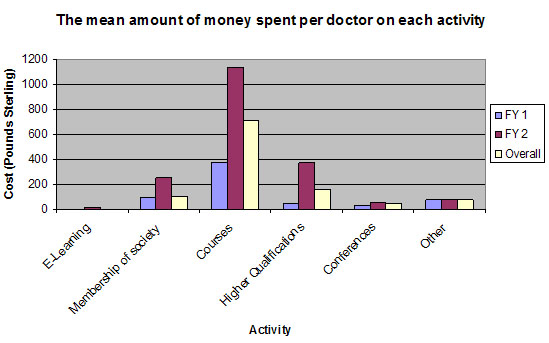
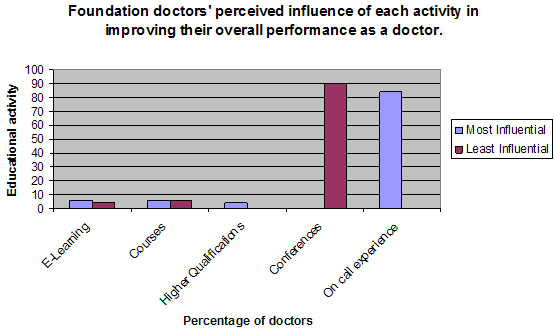
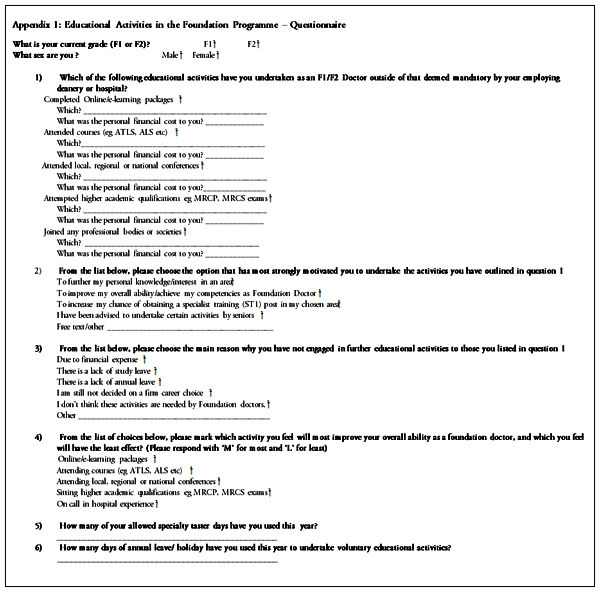
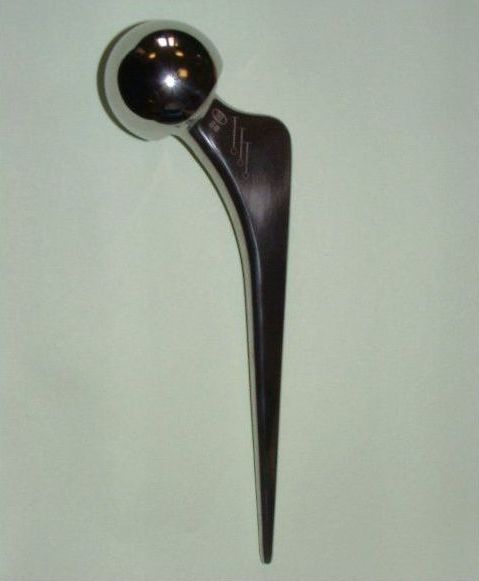
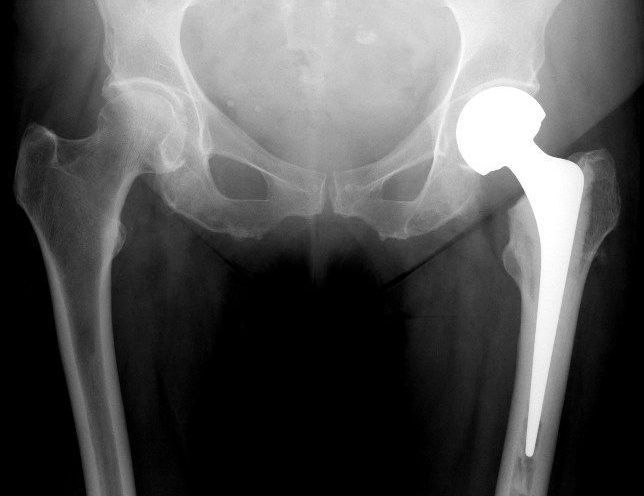
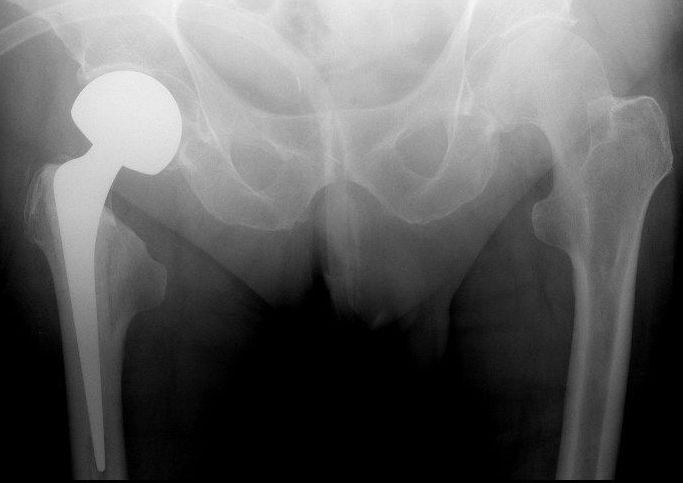
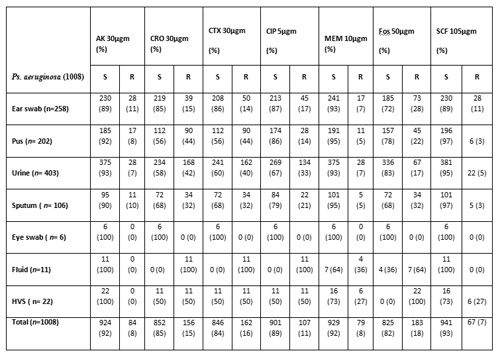
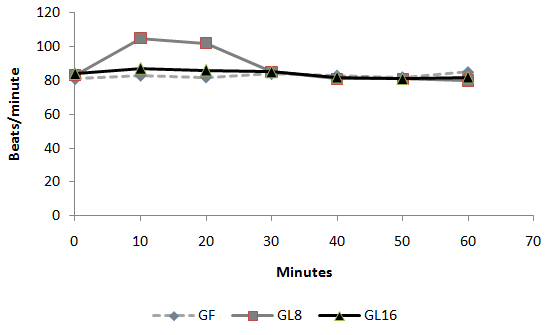 Fig 1: Intra-operative changes in heart rate in groups
 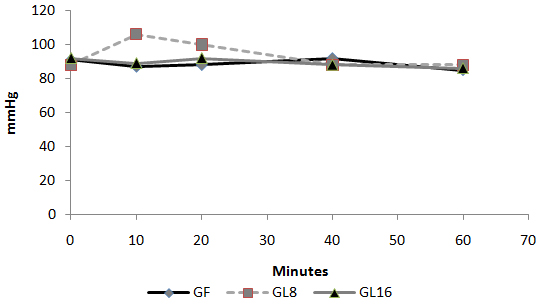 Fig 2: Intra-operative changes in MAP in groups
 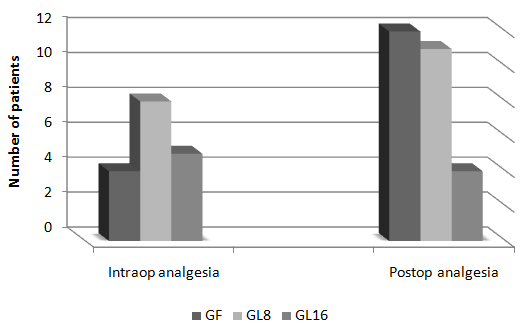 Fig 3: Number of patients requested perioperative analgesic supplementation
 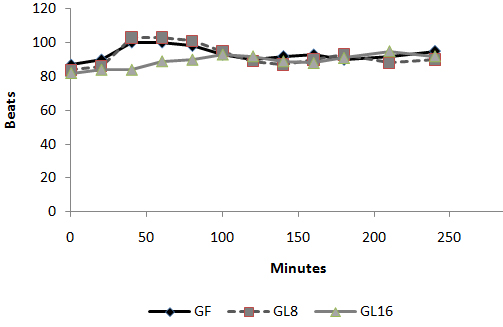 Fig 4: Changes in heart rate in PACU
 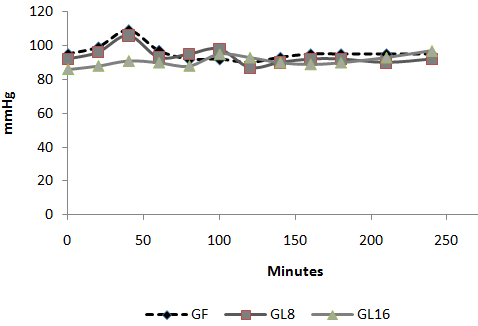 Fig 5: Changes in MAP in PACU:
 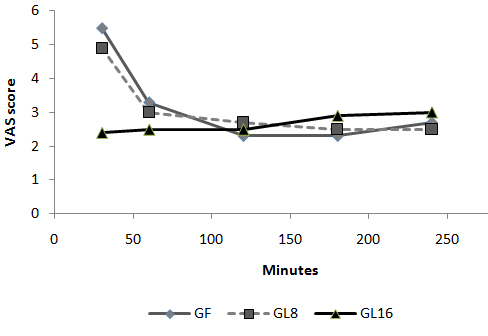 Fig 6: Changes in VAS in PACU Discussion: The use of an opioid, even a short acting one can be associated with adverse effects, which may not be acceptable for patients scheduled for day case surgery. For this reason, it was suggested to substitute an opioid with a non-opioid analgesic for postoperative pain control. The use of a NSAID is associated with adverse effects [1]. Lornoxicam has been successfully used in the prevention and treatment of postoperative pain. It has been shown to be as effective as morphine [4], meperidine [5] and tramadol [6]. To the best of our knowledge, this is the first study to compare the perioperative analgesic efficacy of lornoxicam to fentanyl in patients undergoing day case ENT surgery. We gave Lornoxicam half an hour before induction of anesthesia as the time taken to reach peak plasma concentration (Tmax) was determined to be 0.5 h [7]. During the operative procedure, HR and MAP were significantly higher in group L8 compared to group F and L16. While in PACU, patients in groups F and L8 had higher HR, MAP and VAS score in the early postoperative period compared to patients in group L16. This may be due to inadequate analgesic effect of L8 and the shorter plasma half life of fentanyl compared to L16. The analgesic efficacy of L16 might be attributable to inhibition of cyclo-oxygenase (COX1) and (COX2) activity [2], release of endogenous dynorphin and β-endorphin [5], decrease in peripheral and central prostaglandin production [8] as well as exertion of some of its analgesic activity via the central nervous system [9]. Lornoxicam has a more potent anti-inflammatory and analgesic effect than other oxicams as well as a shorter half life, which decreases the incidence of side effects of drugs with long plasma half life [10]. Arslan and colleagues reported decreased opioid need, PONV and postoperative pain scores when 16 mg of lornoxicam was administered after thyroidectomy [11]. While Xuerong and colleaguessuggested that the increase of postoperative morphine requirements induced by intra-operative administration of fentanyl could be prevented by ketamine or lornoxicam [12]. Rawal reported that NSAIDs are effective as the sole analgesic in a high proportion of cases of mild to moderate pain and it is more convenient to give these drugs by the IV route rather than by IM or rectal administration [13]. The analysis of pain intensity differences was complicated by the fact that many patients postoperatively were asleep at the time their pain assessments were due which may be attributed to effect of opioid and anesthetic medications used. To minimize any missing data we used time to the first dose rescue analgesia (based on changes in hemodynamic data) to evaluate pain intensity differences from baseline. L16 was well tolerated in this study, and was associated with a significantly lower incidence of adverse events than F and L8 which could be due to the opioid side effects in both groups. Norholt and colleaguessupported our results as they reported that, in terms of common acute adverse events, lornoxicam appeared to possess a higher benefit/risk ratio compared with morphine [4]. Zuurmond et al reported that, there is good evidence that avoidance of opioid virtually abolishes the PONV that preclude oral intake of fluids after surgery [14]. In our study, nausea developed in 25.7% of patients in group F, 20% in group L8 but only 8.6% in group L16 who received the least rescue opioid analgesia. Regarding bleeding abnormalities, Hodsman et al reported extensive bleeding required reoperation on two diclofenac group patients submitted to abdominoperitoneal resection of the rectum [15]. In our study no abnormal bleeding was reported by ENT surgeons in any of the study patients. In agreement with our results, Ilias et al[16], Trampitsch et al[17] and Karaman et al [18] used lornoxicam and they did not detect problems with surgical bleeding, bleeding time, blood transfusion requirement or postoperative bleeding. Stroissnig et al reported that overall, in healthy adult volunteers, oral doses of lornoxicam up to 70 mg have been well tolerated, and there have been no effects on vital signs, urine analysis parameters or clinical serum biochemistry [19]. In our study, none of the patients receiving study drugs experienced severe gastric discomfort, needed rescue antiemetic medication or required admission because of poor pain control. Previous studies used lornoxicam for reduction of postoperative opioid consumption but none of them had studied the intra-operative use of lornoxicam. So, we selected certain type of surgical procedures which might be suitable to use lornoxicam as a sole intra-operative analgesia. The adjunctive use of acetaminophen may have additive analgesic efficacy to lornoxicam because of its intrinsic opioid-sparing activity. Measurement of serum catecholamine would have been useful. These could be considered as a limitation for the present study. Conclusion: Intravenous 16 mg lornoxicam with the present study design was comparable to 100 µg fentanyl as intra-operative analgesia but more effective than fentanyl in preventing early postoperative pain in mild to moderate ENT surgical procedures. Intravenous lornoxicam 8 mg was not satisfactory as a sole intra-operative analgesia. The overall incidence of adverse effects of lornoxicam was lower than that of fentanyl.
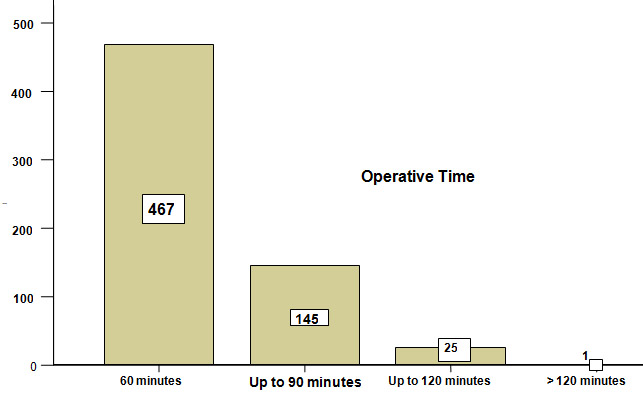 Figure-I. Total duration of operation: Various early complications during the same admission occurred in 9 % (n=55) of the patients. Their distribution according to the type of hernia is displayed inTable- II. Table-II Type of hernia * Complications during same hospitalization Cross tabulation