Acute upper gastrointestinal bleeding presenting as either hematemesis or melena or both is an important medical emergency. The etiological spectrum of upper gastrointestinal bleeding (UGIB) varies from region to region1. Various endoscopic therapy for patients with signs of recent haemorrhage in peptic ulcer have changed the outlook of UGIB management. An addition of proton pump therapy to non-variceal UGIB has further reduced hospital stay, recurrent bleeding and need for surgery2. Another milestone in the decline of UGIB has been eradication of H pylori. Globally, the prevalence of H. Pylori infection has decreased due to better hygiene, early diagnosis and eradication3. These factors have contributed to the changing trends in UGIB. The patients with UGIB have 50% incidence of H. pylori infection positivity and re-bleeding occurs in 7-16 % of the total cases1. Once frequent UGIB due to peptic ulcer have now declined all over the globe as demonstrated by various researchers 4,5,6. Unfortunately, despite advancement in endoscopic and pharmacological treatment, the mortality in UGI bleeding ranges between 3 and 14%7. Particularly, patients with UGI bleeding due to the duodenal ulcer are known to be more prone to death as demonstrated by Quan et al8. The advanced age and patients admitted in hospital with comorbidity are at an increased risk of re-bleeding and mortality. Re-bleeding and mortality rates are higher among patients with variceal bleeds and invariably 50-60% of patients with cirrhosis have variceal bleeding1. This warrants a careful approach in the management of UGI bleed. To predict the re-bleeding rates in a given case of UGI bleeding various clinical and endoscopic models have been developed from time to time. Of these – Rockall score, combining clinical (Age, shock, presence of co-morbid diseases) and endoscopic findings have proved quite valuable in the prediction of hospital admission duration and mortality rate9. The reason for the feasibility of Rockall score is that it depends mainly on simple clinical data and after an endoscopic procedure the score becomes more practical 9. The Rockall score divides patients into 4 subgroups according to their clinical data to estimate death and re-bleeding tendency. While comparing Rockall score, Blatchford scores at first assessment, and the Addenbrooke score it was concluded that Rockall score has an accuracy of 98% in predicting death, and was sensitive in 86.4% of cases in predicting re-bleeding10. Hence we calculated Rockall score in our study cohort and assessed various prognostic factors including changing trends over the past decades.
Methods
Study design
This retrospective study was conducted from January 2015 to December 2017 at King Abdul Aziz Specialist hospital Taif, a tertiary care centre in the western region of Saudi Arabia. The data was collected from case files and electronic medical records. The data about age, comorbid diseases, presence of shock, endoscopic intervention, hospital stay duration, the requirement for blood transfusion, surgery were collected to measure the outcome of UGI bleeding.
Depending upon hemodynamic status upper GI bleeding patients were managed either in the intensive care unit (ICU) or high dependency unit of the hospital. Blood transfusion had been given to maintain Hb levels above 8gm/dl. Platelets transfusions if the platelet counts were < 70,000 and fresh frozen plasma when INR was deranged in chronic liver disease patients.
The recurrent bleeding was defined by hematemesis, melena, or both, with either shock
(pulse rate>100 beats/min, systolic blood pressure< 100mmHg accompanied by cold sweats, pallor, oliguria) or a decrease in haemoglobin concentration of 2 g/dL over 24 hours.
Re-endoscopy, if needed, was used only to confirm recurrent bleeding.
The timing of UGI endoscopy after admission was recorded in each patient. The details of stigmata of recent haemorrhage (spurting vessels, active bleeding in an ulcer, a visible vessel, or a clot over the ulcer that could not be dislodged upon gentle washing with water delivered through the endoscope channel). Rockall score was calculated in all patients.
Patients with variceal bleeding were primarily managed with octreotide infusion ,antibiotics and endoscopic variceal ligation (EVL) or endoscopic sclerotherapy (EST) depending upon the situation. All patients were followed for rebleeding clinically and by haemoglobin levels during their hospital stay. Patients who remained hemodynamically stable for 72 hours were discharged.
After the fifth day, patients positive for H. pylori on CLO test during endoscopy received triple therapy (Capsule Amoxicillin 1gm twice daily and Tab. Clarithromycin 500 mg twice daily for 2 weeks. Tab. Es omeprazole 20mgdaily twice daily was continued for 4weeks. The patients who were H. pylori-negative received Tab. Esomeprazole 20 mg twice daily for 4 weeks.
Inclusion criteria:
Patients with confirmed upper GI bleeding (variceal and non-variceal) were enrolled in this study.
The variceal bleeding due to portal hypertension included both cirrhotic & non-cirrhotic patients.
Exclusion criteria:
Patients with terminal cancer.
Patients with upper GI bleeding where endoscopy had not been done due to any reason and Rockall score could not be calculated.
Patients with persistent shock necessitating emergency surgery, as a life-saving procedure.
Statistical methodology:
Data were statistically described in terms of frequencies (number of cases) and valid percentages for categorical variables. Mean and the standard deviation was used to describe parametric numerical variables while the median and inter-quartile range were used for non-parametric variables. Spearman's rho test was used for testing the correlation between the non-parametric numerical variable (Rockall score) and patients’ age. All statistical calculations were done using computer program IBM SPSS (Statistical Package for the Social Science; IBM Corp, Armonk, NY, USA) release 21 for Microsoft Windows.
Results
A total of 120 participants (76 males,63.3%) with a mean± SD age of 58. 4± 18. 7 years, were included in this study. The Rockall score showed a median (IQR) value of 3 which indicates a low to moderate risk of bleeding recurrence and death.
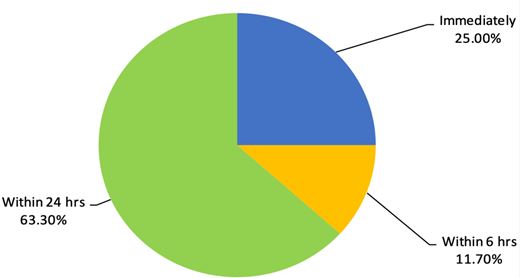
Majority of the study cohort [n=88(74%)] were Saudi nationals and [32(6.7%)] patients were from other nations. All patients had received an initial resuscitation as per the UGIB protocol of the hospital. Of 120 patients, 30 patients (25%) had undergone endoscopy immediately after admission in the intensive care of the hospital due to hemodynamic instability. Fourteen patients (11.7%) had undergone endoscopy within 6 hours of hospital admission and 63% patients had undergone endoscopy within 24 hours of hospital admission. The details are shown in figure 1.
The Rockall score was calculated for all patients based on their age, presence of shock, comorbidities, diagnosis and major stigmata of recent haemorrhage. The details are shown in table 1.
Table 1: Parameters of Rockall score in the non-variceal bleeds
Percentage
Frequency
Category
Parameter
52
43.3
<60=0
Age
16
13.3
>80=2
52
43.3
60- 79= 1
120
100.0
Total
80
66.7
No shock=0
Shock
40
33.3
Tachycardia: Pulse ≥100, Systolic BP ≥100= 1
120
100.0
Total
70
58.3
Any co-morbidities except renal failure, liver failure, and/ or disseminated malignancy=2
It was observed that 46(38.3%) patients had undergone endoscopic variceal ligation (EVL) , and 20(16.7%) patients endoscopic sclerotherapy (EST) .
Heater probe had been used in 5.0% and Gold probe in 5.0% of patients with signs of recent haemorrhage (SRH) . Nevertheless, 48(40.0%) patients had no features of SRH therefore they had not received any endotherapy. Instead they had been managed with IV proton pump inhibitors as per the protocol and supportive treatment.
The data on final EGD diagnosis are shown in table 2.
None of the study cohort patients had undergone surgery to control his or her UGI bleeding and there was no mortality due to UGIB recorded during this period.
In order to test the correlation between Rockall score and age, spearman rho correlation test was carried out and data showed a significant (p<0. 001) moderate positive relationship (correlation coefficient=0. 553) between age and Rockall score of included patients. This means a lower tendency for recurrent bleeding and a lower mortality rate among younger patients.
Discussion
The results of our study showed that hematemesis was the most frequent presenting symptom of UGI bleeding. These results are similar to the study by Minakari et al 11, however, majority of the patients in the above-mentioned study had a peptic ulcer as the commonest aetiology. Contrary to their results portal hypertension outnumbered the peptic ulcer disease as shown in Table 2 in this study. UGI endoscopy had been carried out immediately after admission in 25% of the patients due to ongoing bleeding and the majority of patients had UGI endoscopic examination within 24hrs as shown in Fig1.
Figure 1: Timing of Esophagogastroduodenoscopy (EGD) after hospital admission
While assessing the endoscopy timing especially among variceal bleeding Hsu YC et al 12 concluded that the delayed endoscopy for more than 15 hours , high MELD score, failure of the first endoscopy and hematemesis were independent risk factors for in-hospital mortality in cirrhotic patients with acute variceal haemorrhage. The cirrhotic patients in our study cohort were either Child-Turcotte-Pugh class A or B and none of the patients had hepatic encephalopathy on presentation. After endoscopic therapy, they were managed with standard treatment for variceal bleeding.
The prevalence of H. pylori positivity among UGI bleeding in this study was 60% and all positive patients had been given standard eradication therapy. Data from a different Saudi Arabian centre revealed H. pylori prevalence to the tune of 70% affecting predominantly females in patients with peptic ulcer disease13 but authors had not studied it’s prevalence in UGI bleeding.
This study demonstrated rebleeding in 16 (13. 33%) patients who were re-endoscoped and bleeding was controlled by various endotherapies. In this study re-bleeding was found to be more frequent among older patients with comorbidities. Rebleeding was also common among patients with history of NSAID intake and presence of oesophagal varices which is following literature14. While comparing present results with previous data we observed that previously the commonest cause of UGI bleeding was a duodenal ulcer it is the variceal bleeding due to cirrhosis (HCV) now. We also compared the results of the current study with previous studies across different parts of the globe14,15,16. Duodenal ulcer previously used to be the most frequent cause and invariably various surgical methods like vagotomy etc were used to control bleeding prior to PPI era. However, with the advent of PPI and H pylori eradication the frequency of UGI bleeding due to peptic ulcer have declined.
We recorded only 120 patients with UGI bleeding over three years at our centre nevertheless, this may not reflect the true incidence in the region as it was the data from a single centre only. But the overall incidence of UGI bleeding has decreased over the past decades all over the globe. The study by Loperfido et al17 compared the incidence of 587 patients with UGIB between 1983-1985 and 2002-2004 period. The authors observed that UGI bleeding decreased from 112.5 to 89.8 per 100,000/y. The peptic ulcer incidence also decreased to the half between the two studied periods. In the above-mentioned study it was also revealed that frequency of ulcer bleeding decreased by 41.6% in people younger than 70 years. There has been an obvious change in the trend of UGI bleeding in Saudi Arabia over the past 23 years like other regions of the globe. The number of patients with UGI bleeding has decreased and aetiology of UGI bleeding has also shifted from an ulcer to variceal one.
In a large study, published in 1995 ,the data on 1246 patients over 14 years Al Karawi et al18 observed that duodenal ulcer was the most common cause of UGI bleeding followed by varices. The bleeding rates per annum in their study was 89 cases per annum while this study recorded only 40 admissions of active UGI bleeding per annum. Further, the variceal bleeding outnumbered the duodenal ulcer bleeding contrary to their results connoting a changing trend in Saudi Arabia. The data from southern region of Saudi Arabia also showed variceal bleeding to be the commonest cause of UGI bleeding 19.
In yet another study from Riyadh central hospital, it was revealed that most of the patients with UGI bleeding were having oesophagal varices20. Non cirrhotic portal hypertension (NCPH) was documented in 8 patients in the current study and all were hailing from Egypt which is an endemic region for schistosomiasis and NCPH. The predominant cause of portal hypertension was Chronic liver disease due to chronic HCV in this study. While studying the pattern of liver disease in Saudi Arabia Fashir B et al20 have demonstrated HCV to be the commonest cause of CLD in this part of the globe. This reflects that meticulous screening and treatment of chronic HCV can go a long way in the reduction of UGIB in the region. Having said this it may not be out of place to mention that keeping in view the global epidemic of obesity variceal bleeding due to CLD following NASH may steep up in coming years and become the important cause of UGIB. This highlights a red alert to curb the menace of obesity all over the globe and halt the increasing trend of variceal bleeding in future.
Regarding the trend of gastric ulceration, UGI bleeding has now shifted from H. Pylori infection to the massive use of medications such as NSAIDs or steroids, all over the world16 especially among older people. We demonstrated drug-induced UGI bleeding in 20(16%) patients in this study as shown in table 2. Further the use of warfarin is estimated to increase as the population ages and atrial fibrillation , other cardiovascular ailments are increasing steadily. In a study by McGowan et al22 Tablet Warfarin was an independent predictor of major bleeding after the percutaneous coronary intervention (PCI) in patients receiving dual antiplatelet therapy.
Another most common diseases in the elderly population is Rheumatoid arthritis (RA) . Rheumatoid arthritis is considered as a comorbid disease in the Rockall score and increases the scale for mortality and hemorrhagic shock. The wide use of NSAIDs in RA patients steeps the incidence of peptic ulcers and its complications including UGIB23. This risk is significantly elevated when SSRI medications in combination with NSAIDs are prescribed to allay anxiety and depression in these chronic disorders. The physicians prescribing these medications together should exercise caution and discuss this risk of UGIB with patients24.
UGI bleeding due to malignancies were noted in 4 patients in our study cohort which is similar to the data shown in the southern region of Saudi Arabia19.
In this study, about 12-16% of the patients were diagnosed with either gastric ulcer or hemorrhagic gastritis. The data from Arar, the northern Saudi Arabian city , revealed prevalence of gastric ulcer to be twice as common as duodenal ulcer. The authors of this study observed that the use of NSAIDs, H. Pylori infection and stress were among the most relevant reasons for developing peptic ulcer disease , however authors in their study didn’t study bleeding complications of peptic ulcer disease25.
Conclusion
Based on discussed results, it can be concluded that the frequency of UGI bleeding has declined and peptic ulcer is no longer the most predominant cause of UGI bleeding in Saudi Arabia. Instead, variceal bleeding outnumbers other causes of UGIB. This changing trend now demands that to prevent variceal bleeding we need to focus on the management of chronic HBV, HCV and NASH. Further all medications especially NSAIDs must be cautiously used particularly in elderly people. A step further would be to control hypertension and subsequent atrial fibrillation so that drug-induced UGI bleeding are reduced in future.
Bipolar affective disorder (BPAD) is one of the commonest psychiatric disorders with a lifetime prevalence of about 3% in the general population and is the sixth leading cause of disability worldwide (1,2).This disorder is characterised by repeated episodes in which the patient’s mood and activity levels are significantly disturbed. This disturbance consists on some occasions of an elevation of mood and increased energy and activity (mania or hypomania), and on other occasions of a lowering of mood and decreased energy and activity (depression) (3). As the illness starts early in life, i.e., during teens or early adulthood, persons suffering from BPAD have symptoms of illness for the major part of their life (4, 5).
In India, since professional services, both in public and private sectors are not adequately developed due to shortage of trained human resources and infrastructure, the family support system plays a major role in caring for people with mental illnesses (6). The primary caregiver is identified as an adult relative (a spouse, parent or spouse equivalent) living with a patient, who is involved in the care of the patient on a day-to-day basis, takes the responsibility for bringing the patient to the treatment facility, stays with the patient during the inpatient stay, provides financial support and/or is contacted by the treatment staff in case of emergency (7). Intensive involvement in the care of the patient is often associated with significant caregiver burden.
Caregiver burden can be defined as the presence of problems, difficulties or adverse effects which affect the lives of caregivers of patients with various disorders or illnesses, e.g. members of the household or family (8). Family burden is broadly divided into objective and subjective burden. While the notion of the objective family burden relates to measurable problems (e.g. patients’ troublesome behaviours), the idea of subjective family burden is bound to caregivers’ emotions arising in response to the objective difficulties (9). Multiple studies across the world have shown that bipolar disorder is associated with significant caregiver burden (10-31). In view of the high caregiver burden, it is now suggested that the emphasis in psychiatric rehabilitation needs to shift from a patient-focused approach to a combined patient and caregiver-focused approach. Although there are studies from different parts of the country, there is a lack of data on caregiver burden from Kashmir, which is often faced with turmoil, which can influence caregiver burden. The present study is an effort in this direction to assess caregiver burden and its correlates among primary caregivers of patients with bipolar disorder.
Methodology
The present study was conducted on primary caregivers of patients with BPAD. Primary caregivers were defined as those caregivers who were closely involved in the care of the patient during the acute episodes and during the maintenance period in terms of bringing the patient to the hospital, supervising the medications and liaison with the treating team.
The study sample comprised of 100 caregivers of 100 patients diagnosed with BPAD as per the International Classification of Diseases classification of mental and behavioural disorders, 10th revision (ICD-10) (3), attending either the outpatient or inpatient services at the Department of Psychiatry, SKIMS, Bemina, Srinagar. The study was approved by the Ethics Committee of the institute and all the participants were recruited after obtaining written informed consent.
To be included in the study, the caregivers were required to be involved in the care of patients, aged 18 or above, living with the patient for at least 1 year and were a family member taking care of patients without any wages. Caregivers who were diagnosed with psychiatric illness and staying with the patient for less than 12 months were excluded.
The caregivers were assessed by following scales:
Family Burden Interview Schedule (FBIS) (32):This is a semi-structured interview schedule having 24 items, each of which is scored on a 3-point scale, i.e. 0 indicating no burden, 1 indicating a moderate level of burden and 2 suggesting severe burden. The items of the objective burden of the scale are divided into 6 domains, i.e. financial burden, disruption of routine family activities, disruption of family leisure, disruption of family interaction, physical health and mental health. Subjective burden is evaluated by a single item. This scale has been widely used in previous studies from India (26, 33-35).
DUKE-UNC Functional Social Support Questionnaire (FSSQ) (36):The Duke-UNC Functional Social Support Questionnaire (FSSQ) is an 8-item instrument to measure the strength of the person's social support network (36). Responses to each item were scored as 1 (‘much less than I would like’), 2 (‘less than I would like’), 3 (‘some, but would like more’), 4 (‘almost as much as I would like’) and 5 (‘as much as I would like’). The scores from all eight questions are summed (maximum 40) and then divided by 8 to get an average score. The higher score indicates better perceived social support. Cronbach’s alpha for this scale is 0.84.
Hindi General Health Questionnaire (GHQ-30) (37):The modified version of Goldberg's General Health Questionnaire (GHQ) (38) was used. This is a screening device for identifying minor psychiatric disorders in the general population and within the community or non-psychiatric clinical settings such as primary care or general medical outpatients. The self-administered questionnaire focuses on two major areas: the inability to carry out normal functions and the appearance of new and distressing phenomena. In each question of the 30-item GHQ, the caregivers were asked to choose among: Better than usual or same as usual = 0, less than usual or much less than usual = 1.The results were evaluated by the two-step assessment method (0-0-1-1-method). The minimum GHQ-30 total score was 0 and the maximum total score of GHQ-30 was 30. A cut-off of 6 was used to categorize those with and without psychiatric morbidity. Cronbach’s alpha value of the GHQ-30 was 0.93. The Kappa coefficient was 0.64 (p<0.001).
The recorded data was compiled and entered into a spreadsheet (Microsoft Excel) and then exported to data editor of SPSS Version 16.0 (SPSS Inc., Chicago, Illinois, USA). Continuous variables were summarised in the form of means and standard deviations and categorical variables were summarised as percentages. Student’s independent t-test and Chi-square tests were employed for comparing caregiver burden with different variables.
Results
Table 1: Description of socio-demographic variables of caregivers
Variables
Caregiver Frequency (n=100)(%)
Patients Frequency (n=100)(%)
Age (Years)
20-29
11(11%)
12(12%)
30-39
24(24%)
26(26%)
40-49
26(26%)
31(31%)
50-59
34(34%)
14(14%)
≥ 60
5(5%)
17(17%)
Mean± SD
43.4 ±11.25
34.3±12.86
Gender
Male
52(52%)
47(47%)
Female
48(48%)
53(53%)
Marital Status
Unmarried
7(7%)
37(37%)
Married
93(93%)
63(63%)
Educational Status
No formal education
48(48%)
36(36%)
Primary
5(5%)
6(6%)
Secondary
27(27%)
32(32%)
Graduate
20(20%)
26 (26%)
Occupation
Unemployed
3(3%)
10(10%)
Labourer
27(27%)
24(24%)
Student
3(3%)
16(16%)
House maker
44(44%)
34(34%)
Employed
23(23%)
16(16%)
Socio-economic Status
Low
60(60%)
60(60%)
Middle
40(40%)
40(40%)
High
0(0%)
0(0%)
Relationship of caregiver
Father
11(11%)
Mother
22(22%)
Spouse
55(55%)
Duration of care
1-5yrs
77(77%)
6-10yrs
16(16%)
>10yrs
7(7%)
Mean ± SD
4.8±4.16
Table 2: Clinical profile of patients.
Patient Variables
Frequency(n=100)(%)
Duration of illness
1-5 Yrs
77(77%)
6-10 Yrs
16(16%)
11-15 Yrs
5(5%)
16-20 Yrs
1(1%)
> 20 Yrs
1(1%)
Mean±SD
4.83±4.25
Number of hospitalisations
Never
47(47%)
Once
24(24%)
Twice
18(18%)
Thrice
6(6%)
Four Times
5(5%)
Mean±SD
0.98±1.16
Number of episodes of mania
1-2
55(55%)
3-4
39(39%)
5-6
6(6%)
Mean±SD
2.61±1.12
Number of episodes of depression
< 3
15(15%)
3-5
64(64%)
> 5
21(21%)
Mean±SD
4.05±1.87
Number of attempts of homicide
0
75(75%)
1
8(8%)
2
4(4%)
≥ 3
5(5%)
Mean±SD
0.37±0.93
Number of attempts of suicide
0
75(75%)
1
1(1%)
2
6(%)
≥ 3
2(2%)
Mean±SD
0.23±0.74
Compliance with medication
Yes
73(73%)
No
27(27%)
Table 3: Caregiver burden, social support and psychological morbidity among caregivers
Psychosocial parameters
Mean (SD)
Range
Caregiver burden (FBI scores)
Financial burden
7.01 (2.28)
3-12
Disruption of family routine activities
5.38(1.77)
3-9
Disruption of family leisure
4.12 (1.26)
2-8
Disruption of family interactions
4.04 (1.36)
3-9
Effect on physical health of others
2.28 (0.83)
1-4
Effect on mental health of others
1.51 (0.82)
0-4
Total family burden
24.31 (7.35)
13-44
Objective burden Score < 12 Score ≥12
3 97
Subjective Caregiver burden score
1.12(0.61)
0-2
DUKE UNC FSSQ
3.17 (0.84)
1.75-4.75
GHQ-30
13.14 (5.65)
2-25
GHQ score < 6 GHQ score ≥ 6
77 (77%) 23 (23%)
Table 4: Association of caregiver burden with socio-demographic variables of caregivers
Caregiver Variables
N
Mean
SD
P-value
Age (Years)
20-29 30-39 40-49 50-59 ≥ 60
11 24 26 34 5
20.63 22.67 25.08 26.93 29.25
4.860 7.409 6.211 5.839 6.675
<0.001*
Gender
Male Female
52 48
23.60 27.35
7.384 7.309
0.012*
Marital Status
Married Unmarried
93 7
26.97 21.29
7.409 6.211
0.041*
Educational Status
No formal education Primary Secondary Graduate
48 5 27 20
28.78 27.80 24.69 22.35
7.772 7.596 7.223 5.092
0.015*
Occupation
Unemployed Labourer Student House maker Employed
3 27 3 44 23
23.15 25.47 23.05 28.05 22.07
7.268 1.399 6.891 6.891 7.312
<0.001*
Socio-economic status
Low Middle High
60 40 0
26.88 23.38 0
7.958 5.687 0
0.018*
Type of family
Nuclear Joint
82 18
28.37 23.54
5.463 6.354
0.002*
Relationship to patient
Parent Spouse Offspring
33 55 12
24.47 28.04 21.57
7.972 7.038 6.024
0.008*
Duration of care
1-5 Years 6-10 Years > 10 Years
77 16 7
22.99 33.06 35.57
5.644 6.027 5.996
<0.001*
Table 5: Clinical Profile of patients with bipolar disorder
Disease Profile
No.
Mean
SD
P-value
Duration of illness
1-5 Yrs 6-10 Yrs ≥ 10Yrs
77 16 7
22.98 33.07 37.01
5.644 6.027 2.887
<0.001*
Number of Hospitalisations
Never Once Twice Thrice Four Times
47 24 18 6 5
22.21 25.83 26.54 28.50 31.00
7.896 7.438 6.527 4.506 6.042
0.045*
Number of episodes of mania
1-2 3-4 5-6
55 39 6
22.27 27.97 38.65
5.612 6.726 2.066
<0.001*
Number of episodes of depression
< 3 3-5 > 5
15 64 21
21.93 23.91 32.81
7.611 5.817 6.615
<0.001*
Compliance with medication (>75%)
Yes No
73 27
24.51 27.94
7.328 7.377
0.041*
Table 6: Clinical Profile of patients with bipolar disorder
The study included nearly equal number of male and female patients. About two-thirds of the patients were married (63%). About one-third of the patients had not received any formal education and another third had completed their secondary education and one-fourth had completed graduation (Table 1).
Description of socio-demographic variables of caregivers
The study included nearly equal numbers of male and female caregivers. The majority (55%) of the caregivers were spouses of the patient. The majority of the caregivers were married (93%). Nearly half of the caregivers had not received any formal education (48%), were homemakers (44%) and three-fifths of them were from low socioeconomic status (60%). The majority of caregivers (77%) had been caring for duration of one to five years (Table 1).
Clinical profile of patients.
In the present study, the majority of patients (77%) had duration of illness in the range of 1-5 years, nearly half of them were never hospitalised, the majority (55%) of patients had one to two manic episodes, most of them (64%) had three to five episodes of depression, and the majority (75%) of them never attempted suicide or homicide. The majority of patients (73%) were compliant with medication. (Table 2)
Caregiver burden, social support and psychological morbidity among caregivers
As is evident from Table 3, the highest burden was reported in the financial domain, followed by disruption in family routine activities, disruption of family leisure, disruption of family interactions, effect on physical health of others and least burden was reported in the form of effect on mental health of others. The mean DUKE UNC FSSQ score was 3.17 (SD=0.84) with range 1.75-4.75.
Mean GHQ-30 score was 13.14(SD=5.65) with a range of 2-25. Of the 100 caregivers, about one-fourth (N=23) had a GHQ-30 score of 6 or more, indicative of psychological morbidity.
Association of caregiver burden with demographic and clinical variables
As is evident from Table 4, higher caregiver burden was associated with higher age, female gender, lack of formal education, being a homemaker, lower socioeconomic status, a nuclear family set-up, being spouse of the patient and longer duration of being in the caregiver role.
Clinical Profile of patients with bipolar disorder
In terms of clinical variables, higher objective caregiver burden was associated with duration of illness more than 10 years, higher number of hospitalisations and higher number of manic and depressive episodes. Caregivers of patients consuming >75% of the prescribed medications reported lower caregiver burden (Table 5).
Advancing age of patient and caregiver, increasing duration of care, prolonged illness, greater number of hospitalisations and higher number of episodes of either polarity were significantly associated with higher caregiver burden. In terms of association of social support and caregiver burden, higher social support was associated with significantly lower caregiver burden, whereas higher caregiver burden was associated with higher psychological morbidity (Table 6).
Discussion
Families play an important role in care of patients with chronic mental illnesses. In the process of caring for such patients, relatives face a considerable burden.
Findings of the present study suggest that higher burden was seen among the caregivers who were relatively older, of female gender, uneducated or illiterate, homemakers and from nuclear families. Compared to parents and siblings, spouses reported significantly higher levels of caregiver burden. Furthermore, the caregivers involved in the care of the patient for longer durations reported significantly higher levels of caregiver burden.
In terms of clinical variables of patients, higher caregiver burden was associated with longer duration of illness, higher number of lifetime hospitalisations, higher number of manic and depressive episodes and poor medication compliance. Poor social support was associated with a higher level of caregiver burden. Higher caregiver burden was associated with higher psychological morbidity.
Many previous studies from India have evaluated caregiver burden among caregivers of patients with bipolar disorder (10-32). There is a lack of consensus with respect to caregiver variables and their association with caregiver burden (39). Some of the studies suggest that there is no significant difference in the caregiver burden as reported by caregivers of either gender (6), whereas others suggest that females report higher caregiver burden (13, 40). Our findings support the studies which have reported higher caregiver burden among female caregivers. This finding of ours could have been influenced by the relationship of caregivers with patients. In the present study, spouses of patients formed a large proportion of caregivers and they reported significantly higher burden, in contrast to parents and siblings. Cultural issues like restriction of females to household activities with lower opportunities to vent out their distress, inability to spend time on leisure activities, financial dependency and lack of independence could also be responsible for higher perceived burden. It was noticed that caregivers from nuclear families had higher caregiver burden as compared to those from joint families. The joint family system is considered to promote interdependence and possibly is associated with sharing of caregiver burden and this may explain why caregivers from joint families reported lower caregiver burden. Similar findings have been reported in earlier studies from India (41).
Findings of the association of higher caregiver burden with duration of illness are supported by existing literature (14). This finding suggests that possibly with passing time, frequent relapses of illness lead to caregiver burnout, which leads to higher caregiver burden. Previous studies have also noted an association of higher caregiver burden with higher numbers of hospitalisation (30). Findings of the present study too support this association. Higher caregiver burden with greater numbers of hospitalisations possibly indicate more severe episodes and hospitalisation associated with more expenditures and loss of earnings. This suggests that all efforts must be made to pick up relapses at the earliest and manage them effectively to minimise the chances of progression to severe episodes and resultant need for inpatient care. Previous studies have also reported association between higher caregiver burden and higher number of episodes, especially manic episodes (14) and more severe manic episodes (42). Manic episodes of the illness are very disruptive to daily life, work and family relationships. Due to this, these episodes place great demands on family members involved in caregiving. These demands can persist even during remission, where residual symptoms are often still present and lead to caregiver burden. Available data from India suggest that in contrast to patients from the West, patients from India have a higher number of manic episodes (43). Taken together, this finding has important implications as this suggests that efforts must be made to prevent frequent relapses in patients with bipolar disorder, especially in the Indian context to reduce the caregiver burden (44).
In the present study, higher burden was also associated with a higher number of depressive episodes and this finding is supported by existing literature (16).
Long-term management of bipolar disorder requires continuation of medications with good compliance. Poor medication compliance has been shown to be associated with many negative patient-related outcomes like higher risk of relapses, suicidality, poor quality of life, higher residual or sub-syndromal symptoms etc (45, 46). The present study adds to this body of literature and suggests that poor medication compliance in patients is also associated with higher caregiver burden and this finding is supported by the existing literature (11).
Among the demographic variables of caregivers, higher age of caregivers was associated with higher caregiver burden. This finding is also supported by existing literature (6). This association possibly suggests that with increasing age, the caregivers possibly experience more burnout, lose hope and also lose physical vigour to take care of the mentally ill relative.
Accordingly, it is important for the mental health professionals to support the ageing caregivers.
To conclude, the present study suggests that BPAD is associated with higher caregiver burden. Higher caregiver burden is associated with clinical variables of the patients and demographic variables of the caregivers. Among the patient-related variables, longer duration of illness, those with a higher number of lifetime episodes of either polarity and poor medication adherence are associated with higher caregiver burden. Hence, all measures must be taken to minimise relapse in patients with BPAD. Among the demographic variables of caregivers, higher caregiver burden is reported by caregivers who were relatively older, of female gender, uneducated or illiterate, homemakers and from nuclear families.
Our findings highlight the need for additional research on interventions to reduce burden among caregivers of patients with bipolar affective disorder. For better outcomes of disease, more attention needs to be given to the primary caregivers in terms of psycho-education and counselling.
Fractures in surgically fused scoliotic spines are very uncommon and only a few cases have been reported in the literature. It is not possible to predict the outcome of traumatic injuries in fused spines. There is no reported prevalence or prognostic data in the published literature and all we have are a few case reports from different parts of the world.
In this case report we describe an unusual case of a spinal fracture in a 60-year-old patient, who had surgical fusion of her scoliotic spine 50 years ago.
Case Report
A 60-year-old lady presented to A&E after a trivial fall on an icy path approximately 10 days before presentation. She had pain in her back since the fall, gradually getting worse despite escalating doses of opiate analgesics. Past medical history revealed that she had congenital lympho-haemangioma causing deformity in her back and left foot. At the age of 6 months she underwent an extensive surgical excision of the tumour along with amputation of her left foot. Subsequently she developed scoliosis at the age of 6 years, which was treated conservatively in a Milwaukee brace between the ages of 7 and 10. At the age of 10 she underwent an extensive thoraco-lumbar postero-lateral inter-transverse fusion using iliac crest bone graft without instrumentation to treat her progressive scoliotic curve. She was supported in a Milwaukee brace for further 6 months. Following this she had no problems in her back although she had a considerable residual deformity.
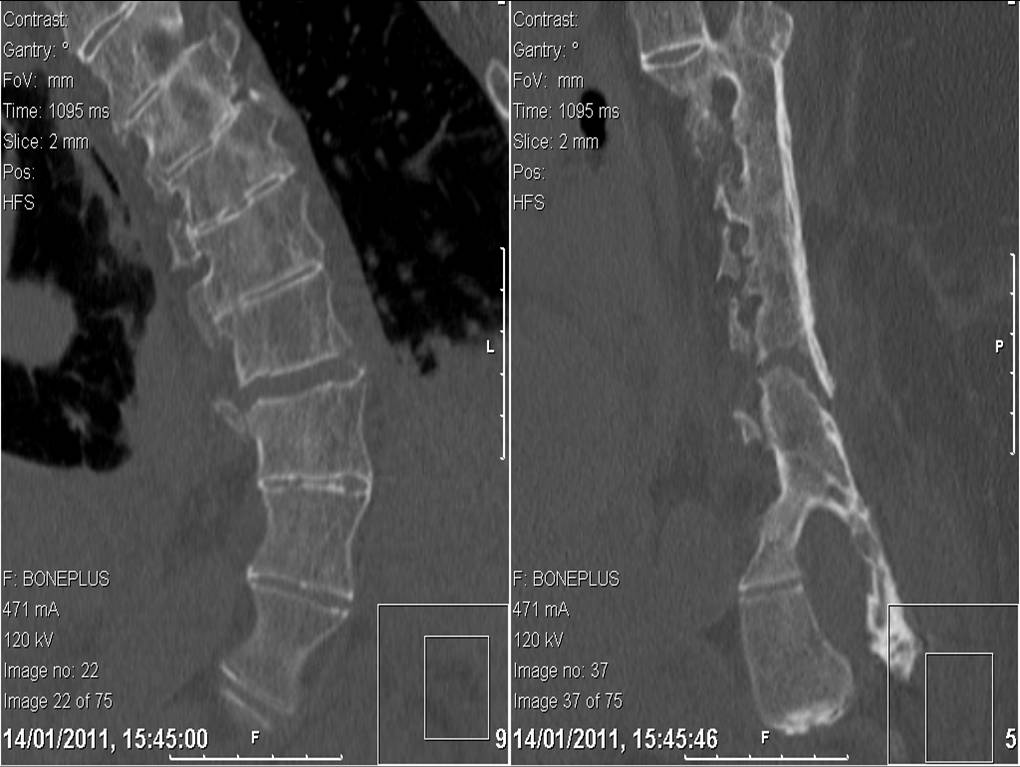
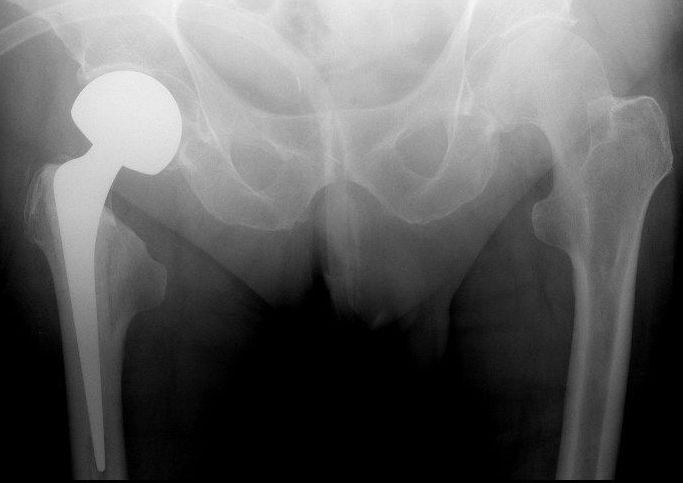
After this recent fall she developed pain in her right-sided thoracic hump. A full neurological examination revealed normal motor & sensory function in both lower limbs. Plain radiographs showed a thoracic scoliosis convex to the left and a broad fusion mass extending approximately from T4 to L1. There was no fracture seen. She was discharged from the A&E department with further analgesia. 3 days later she returned to A&E with increasing pain and respiratory depression due to excessive opiate usage. Investigations also revealed a very high level of serum lithium from her regular lithium medication combined with dehydration and deranged renal function. She was admitted in the high dependency unit for supportive care while the symptoms of pain and discomfort were progressively worsening. Another radiograph of her spine was again inconclusive of any bony injury. A CT scan was performed at this juncture. The CT scan (Fig. 1) showed a fracture line at the junction of T9-T10 extending through the fusion mass, with minimal displacement. She was neurologically stable on clinical examination.
The feasibility of surgical fixation of this fracture was discussed with a specialist scoliosis surgeon and a decision was made to pursue conservative treatment, considering her ongoing medical condition. Surgical fixation was deemed to be technically challenging and very risky. She was not found to be suitable for bracing either. She was advised bed rest with symptomatic management of pain, which was followed by protected and supervised mobilisation.
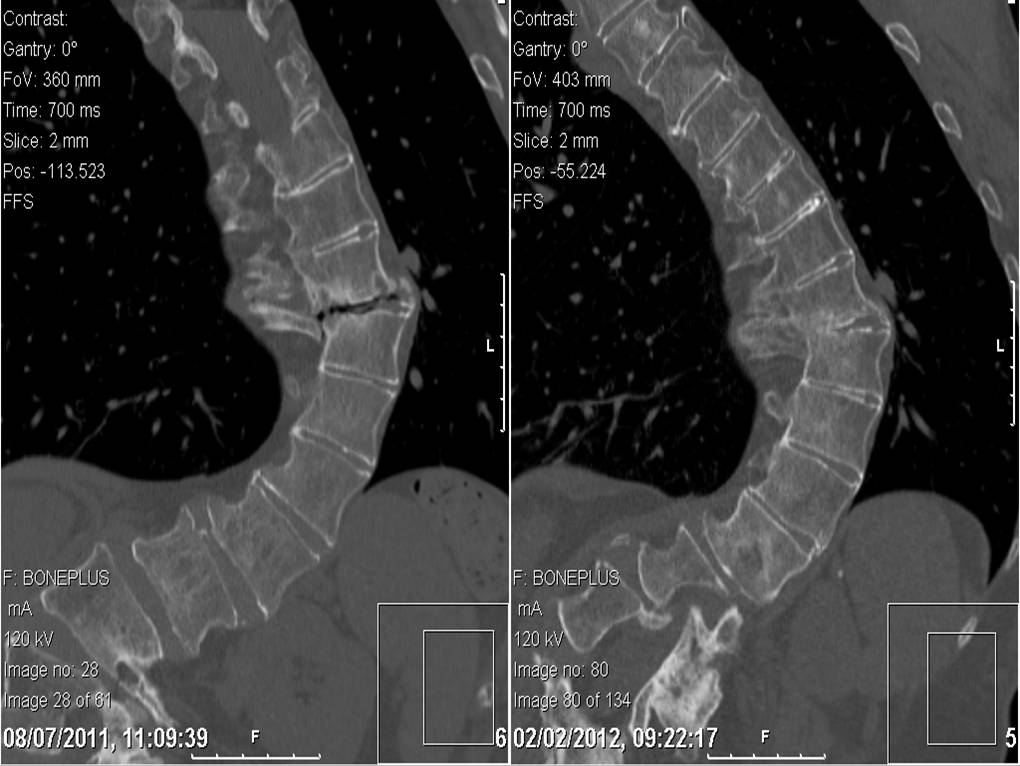
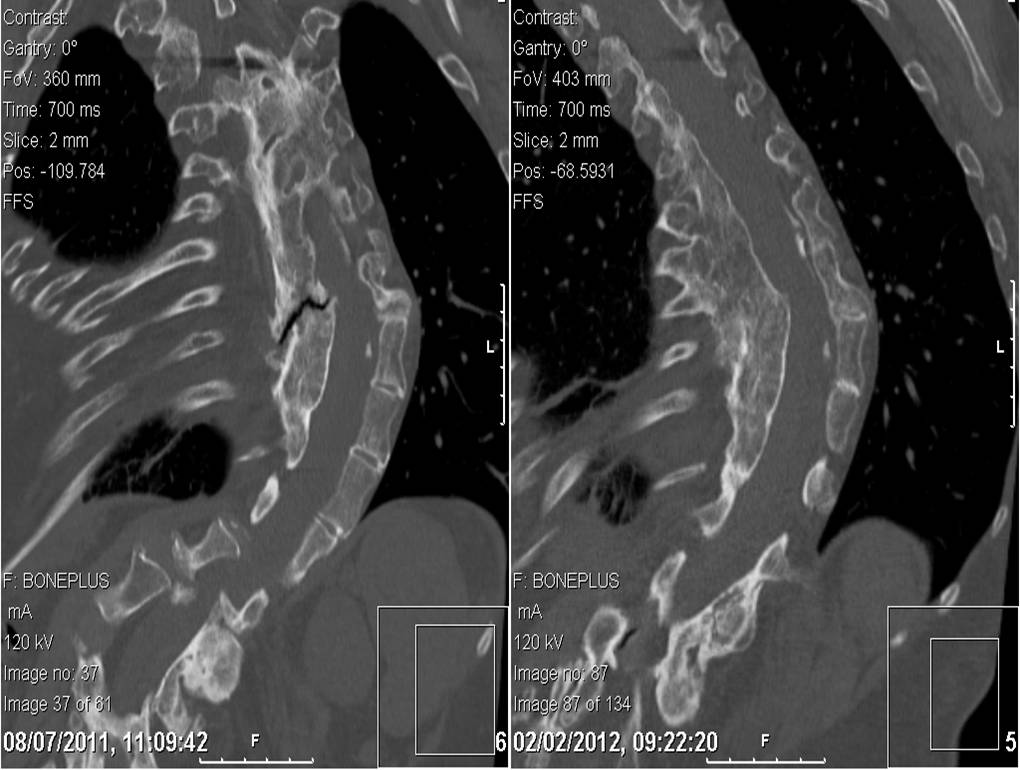
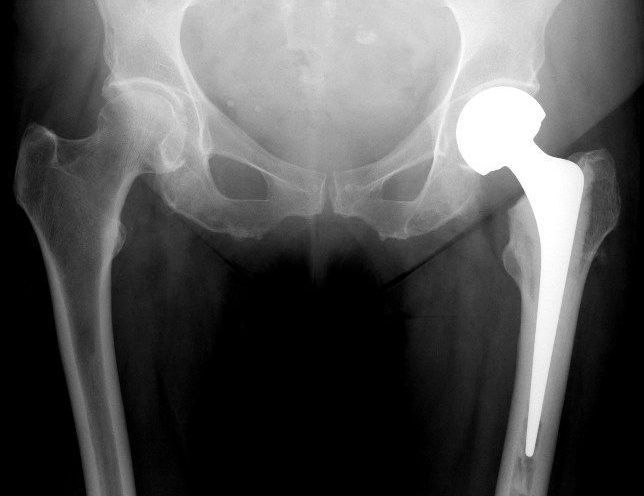
Further CT scans were performed after 6 weeks and after 12 weeks. These showed the fracture had remained stable but minimal signs of healing were observed with persistent gas shadows in the disc space. Throughout this she remained free of any neurological deficiency and her pain was under control. She was allowed mobilisation within the limits of comfort and under supervision. Serial CT scans were performed at the 7th month, which showed a stable spine and some callus formation at the fracture site. The latest follow up scans performed at the 12th month showed bony union had taken place (Fig 2 & 3). She was followed up in the outpatient clinic. She has resumed her normal activities and is now not requiring regular analgesia.
Figure 1- Coronal and Saggital CT Images of the Fracture from January 2011
Figure 2- Coronal Images compared between July 2011 and February 2012 showing healing
Figure 3- Saggital Images compared between July 2011 and February 2012 showing healing
Discussion
Fracture through a fused scoliotic spine is an uncommon entity. Healing of that fracture by conservative measure is fairly uncommon. Most authors point out that “the ankylosed spine breaks like a long bone, transversely, as a result of a bending force” (Bergmann)1. This fracture configuration results in higher rates of non-union and delayed union. In this light we have presented here a unique case report where a fractured fusion mass has healed without surgical intervention.
There are very few reported incidences of fracture through a spinal fusion mass after scoliosis surgery in the published literature in English. Two patients reported by Moskowitz et al2 had injuries as a result of traffic accidents. The exact mechanisms of the injuries were not described and their management was not discussed. One fractured through the fusion mass 20 years after surgery, the other 14 months after surgery.
King and Bradford3 described a fracture-dislocation of T11-T12 in a patient treated with Harrington rods. They decided to operate because of rod angulation and severe trunk de-compensation.
Tuffley and McPhee4 described a patient treated with posterior spinal fusion without instrumentation. The patient sustained a transverse fracture through the fusion mass without displacement after a fall. Posterior fixation with Harrington instrumentation was carried out.
Bagó et al5 described a 30 year old woman who had undergone anterior and posterior fusion with Cotrel-Dubousset instrumentation for progressive idiopathic scoliosis. Two years after surgery, she was in a car accident. A radiographic study and computer tomographic scanning depicted a fracture of T11 and bending of the rods. Observation was instituted and symptoms resolved.
Chung6 reported a post polio patient whose spine was fused from T7 to L4 as a teenager by spinal instrumentation, which was removed after achieving fusion. She fell down stairs fracturing the body of L2 without any neurological deficit. She was treated conservatively for 3 months after which non-union was observed. The fusion mass was fixed with an AO/ASIF broad dynamic compression plate rather than the convention spinal systems such as pedicle screws, Harrington or Luque system because of the absence of normal anatomical landmarks.
All the described case reports were from high-energy trauma unlike our case where the injury was very inconspicuous. We stress upon the fact that these injuries are very rare and can be very difficult to diagnose from plain radiographs. Our patient was fortunate not to have damaged her spinal cord, which is probably because of the low energy trauma she sustained. Our conservative management has worked well in alleviating her symptoms and achieving bony union.
India ranks second in world not only in terms of its population but also in disaster proneness.1 Disasters, whether they are natural or man-made, result in a wide range of mental and physical health consequences.2 International public agenda has taken notice of protection and care of children in natural and man-made disasters. This, in large part, is due to observations that those affected and overlooked often include children and adolescents.3 There is continuous controversy about the impact of disasters on victims including children4, 5and some investigations deny that serious psychological effects occur.6, 7, 8However further researchhas found that the criterion used in these studies were extremely narrow and inadequate and hence more systematic, clinically relevant investigations are required.9 For children and adolescents, response to disaster and terrorism involve a complex interplay of pre-existing psychological vulnerabilities, stressors and nature of support in the aftermath. Previous research has shown that direct exposure to differenttypes of mass traumatic events is associated with an increasein post-traumatic stress symptoms, 10, 11, 12, 13 anxiety, and depression, 11, 14 which are frequently comorbid withpost-traumatic stress reactions among youth.15 To the best of our knowledge, studies on long term psychological effects of disasters on younger age groups from South Asian countries are only a handful even though the frequency and the extent of natural disasters in this part of the world are considerable. As trauma during childhood and adolescents can etch an indelible signature in the individual's development and may lead to future disorder,16 it underscores the need for such studies.
A snowstorm followed by an avalanche took over a small mountainous village “Waltengu Nard” in South Kashmir, India on 19th Feb. 2005, about a month after the devastating Indian Ocean Tsunami. Of the total population, 24.77% (n=164) had perished. 17 As reported, the total population of children and adolescents prior to disaster was 242, of whom 52 died (21.49%).17 The present study is a discreet one which aims to determine long term psychiatric morbidity among the surviving children and adolescents of this disaster affected region five years after the snowstorm disaster. This is based on the notion that psychiatric disturbances can be present in children and adolescents years after a disaster has occurred.18, 19, 20 The socio-demographic variables of the patients are also studied. The results may support the need to apply wide area epidemiological approaches to mental health assessment after any large scale disaster.
Material and Methods
The study was designed as a survey of children attending school. Children from ages 6 years to 17 years from the high school near Waltengu Nard were taken up for the study. Only those children who were present in the area during the disaster were included in the study. Those with presence of any psychiatric disorder prior to the time of disaster, mental retardation, organic brain disorder, serious physical disability prior to disease (e.g. blindness, polio, amputated limbs etc.) or severe medical condition (e.g. congenital or rheumatic heart disease, tuberculosis, malignancy etc.) were excluded from the study. Within the school, an alphabetically ordered list was prepared including all classes of school with children aged 6-17 years 11 months. Every 3rd student on this list was chosen and subjected to inclusion and exclusion criteria until a sample size of 100 children was complete. Informed consent was obtained both from the child and one of his/her caregivers or parents.
Selected children were subjected to the Mini International Neuropsychiatric interview for children and adolescents (MINI-KID) for evaluation of symptoms and diagnosis which is a DSM-IV based diagnostic interview with high reliability and validity. 21, 22 A semi structured proforma was prepared for socio-demographic profile. Kuppuswamy's Socioeconomic Status Scale, 2007 was used for determining socio-economic status. 23 Oslo-3 Social Support Scale (OSS-3) was used to calculate social support. 24
Interviews were conducted following formal training in instituting MINI-KID by trained psychiatrists of the Department of Psychiatry GMC Srinagar. The data was then subjected to appropriate statistical methods. A p-value less than 0.05 was taken as significant.
Results
Of the 100 children and adolescents studied (41.32% of the affected population of children and adolescents) 41 were noted to have at least one psychiatric diagnosis (patients). The socio-demographic profile of these patients is represented in Table 1. Age and sex distribution of diagnoses is presented in Table 2 and Table 3 respectively.
A total of 54 diagnoses were observed in these 41 patients (Figure 1), with comorbidities present in 12 patients (29.27%). 11 of these 12 patients were experiencing two psychiatric disorders present concurrently and 1 was enduring three concurrent psychiatric diagnoses. Post-Traumatic Stress Disorder (PTSD) was the commonest comorbidity seen in 6 patients. This comes to 42.86% of total PTSD cases. This was followed by Major Depressive Disorder (MDD), Generalized Anxiety Disorder (GAD), Suicidality, Social Phobia, Panic Disorder, Agoraphobia and Separation Anxiety Disorder (SAD) in 2 each. Attention Deficit/Hyperactivity Disorder (ADHD), Conduct Disorder (CD), Specific Phobia (dark), Substance Abuse and Dysthymia were comorbid in one patient each. Studies have consistently shown presence of psychiatric comorbidities post-disaster.48, 49 Of the total 54 diagnoses, the commonest were Anxiety disorders (except PTSD), PTSD and affective disorders (includes MDD, dysthymia and mania) comprising 37.04% (N=20), 25.93% (N=14) and 14.81% (N=8) of total diagnosis respectively.
Figure 1: Diagnostic profile of the patients
Discussion
When children and their families are involved in natural or man-made disasters they may be exposed to diverse stressors which may impact mental health of the survivors, including children.25 Studies have suggested that reliance on parental reports of children’s distress may not be valid as parents typically under-report symptoms compared with child and adolescent self-report in mental health surveys.26 Thus in our study the psychiatric interview of each child was done individually without getting leads from their parents. In the early "heroic" and "honeymoon" phases of disaster relief there is much energy, optimism, and altruism. As fatigue sets in over the time and frustrations and disillusionment accumulate, more stress symptoms may appear.27 Accordingly, the study was carried out five years after disaster to catch this delayed response to disaster in the form of psychiatric morbidity.
Consequences of the extensive amount of stress on our sample population due to the snowstorm resulted in a high prevalence of psychiatric disorders in our sample which was apparently not due to any other psychological stress during this period. Despite the fact that the study was done five years after the disaster, the research generated high psychiatric morbidity. Many young survivors reported restlessness and fear with the return of the season in which snowstorm occurred. All these kept the memories of the disaster and the losses fresh in their mind thus not allowing the wounds to heal. Some said that they couldn't keep their minds off the snowstorm during the weeks approaching the anniversary. This was much like the so called anniversary reactions.28 Even children and adolescents, who have rebuilt their homes or found new dwellings to rent, frequently feel a sense of loss at the anniversary. Though the area was provided with adequate relief in terms of better infrastructure, education, employment and financial help in years post disaster to make their life without psychological distress, but, perhaps four such anniversary reactions and the fact that they are still living in the same geographical area and climate conditions have not allowed them to settle down in a routine since the psychological distress. Of the total sample of 100 patients, 41 % (N=41) reported at least one diagnosis. This is almost similar to a study by Kar and Bastia after a natural disaster in Orissa (cyclone) who found 37.9 % of adolescents with any diagnosis.29 Similarly Margoob et al found that 34.39 % had a psychiatric disorder at the end of one year, after disaster.17 Other studies yielded results in the range of 12% to 70% in terms of total psychiatric morbidity.26, 30-33
PTSD was the commonest individual diagnosis in our study with 14% (N=14) of the total population. Studies have shown PTSD prevalence after disaster from as high as 72 %34 to as low as 8 %.35 However, these were done immediately or within a few months after the disaster and the longitudinal pattern was not studied. A study conducted by Margoob et al reported a prevalence of 18.51 % in a sample of survivors one year after the same snowstorm on which this present study is based.17 Similarly, Bockszczanin et al 2.5 years after a flood in Poland reported 18 % of children to be suffering from PTSD.36 Thus our results of 14 % patients suffering from PTSD are also similar to the trend as we are studying them after a period of five years following the disaster. Diagnosis of PTSD in our study was more common among the pre-adolescent age group, 22.58 % (N=7) and adolescents 33.33% (N=2). Similar findings were reported by Hoven et al who found a prevalence of 20.1 % in this age group.30 Also PTSD was more frequent in females in our study. It was observed in 16.98 % females (N=9) as compared to 10.64 % for males. Hoven et al also found high prevalence in girls (13.3 % vs. 7.4 %).30
Anxiety Disorders (excluding PTSD) formed the most common collective diagnostic category in our sample. Anxiety disorders were present in 20 % (N=20) of our sample population which formed about 37.04 % of total diagnosis. These included cases of GAD 5% (N=5), SAD 4% (N=4), Social Phobia 3% (N=3), Agoraphobia 3% (N=3), Panic Disorder 2% (N=2), OCD 2% (N=2) and Specific Phobia 1% (N=1). Similarly Norris et al found anxiety in various forms in 32% of their sample of disaster victims.25 Similar findings were also reported by Reijneveld et al.37 Hoven et al in an important study after 9/11 found prevalence of various anxiety disorders to the magnitude of 28.6%.30 Our study correlated very closely to the above mentioned study. GAD was the commonest anxiety disorder among the above group. A prevalence of 5% (N=5) was found in the study sample. This prevalence was almost half of the earlier studies in children and adolescents after a disaster by Kar and Bastia29 where it was 12% and by Hoven et al 30 where it came out to be 10.3 %. However these studies were conducted within a few months after the disaster and hence came out with a higher prevalence of GAD than ours. It was more common in girls in contrast to boys (7.55 % vs. 2.12%) similar to study by Hoven et al.30 SAD was also seen to predominate in anxiety disorders with 4 % (N=4) of the sample receiving the diagnosis. Some studies like one by Hoven et al found it to be prevalent in 12.3 % of their sample 6 months after 9/11.30 However other studies have found SAD to be comparatively less frequent post disaster in children and adolescents.34 Thus our findings are modest and lie somewhere between the above two studies. Also ours was a long term study hence SAD figures are a bit low. SAD in our study was more prevalent in girls than boys (5.66% vs. 2.12%). Moreover, it was exclusively seen in ages below 10 years. The above findings are in tune with the study by Hoven et al.30 Panic disorder showed a low prevalence in our study and was found in only 2 % (N=2) patients. In both of these patients it was found to be comorbid, with MDD in one and with Agoraphobia in another. Studies immediately post disaster found the prevalence to be around 10.8 % (Math et al)32 and 8.7% (Hoven et al).30 However in the survivors of the same area, in which our study is based, an earlier study one year after the disaster found 3.08 % prevalence of panic disorder which is very similar to our study.17 It was more prevalent in females and is well correlated to a study by Hoven et al.30 Agoraphobia was present in 3 % (N=3) patients. It was comorbid in two patients with panic disorder and with PTSD, and an individual diagnosis in one. Hoven et al have found high rates of Agoraphobia post disaster i.e., about 14.8%.30 But again this study was done only 6 months after 9/11 hence more morbidity. Female preponderance of the diagnosis was established (3.77 % vs. 2.12 %) as with earlier studies.30 Obsessive traits are known to increase subsequent to disaster in the surviving population.38 Similarly 2 % of cases satisfying the criteria for OCD were seen in our study. The commonest obsessions were recurrent intrusive and annoying themes related to the disaster and ruminations about whether it could have been prevented, followed by worries related to harm befalling themselves, family members, or fear of harming others due to losing control over aggressive impulses. Other obsessive themes were related to scenes of trauma and commonly blood. Obsessions regarding extreme fears of contamination were also present.
The affective disorders have been studied less often than PTSD after disaster. Depression is known to occur with increased frequency subsequent to disaster.25 MDD was present in 4 % (N=4) of the total sample population. Studies conducted immediately after disasters have found higher prevalence. Math et al,32 Kar & Bastia29 and Catani et al33 found the prevalence of 13.5 %, 17.6 % and 19.6 % in their studies respectively. A study at three months and at one year after disaster on the adults in the same population as our study found the prevalence of MDD as 29.6 % and 14.28 % respectively.17 This decreasing trend is substantiated by the findings of our study and is in line with it. MDD was more common in females (5.66 % vs. 2.12%) which is similar to the study of Hoven et al.30 Our findings of increased prevalence of MDD in middle adolescents (7.69 %) as compared to other age groups is also comparable to Hoven et al.30 Of the Dysthymia cases, 3 % (N=3) were observed in our studies. Increased prevalence of dysthymia has not been reported post disaster in earlier studies. Our findings could be a part of large affective diaspora with dysthymia resulting from diminished self-esteem and a sense of helplessness subsequent to disaster. In addition to the time period for depression these patients were given the diagnosis of dysthymia because the depressed mood in them was more apparent subjectively than objectively. Finally these patients could have been on a natural course of dysthymia which usually begins in childhood. Combined dysthymia and MDD accounted for 7 % (N=7) of patients which if taken as a collective depression category, the results are slightly more comparable with the above studies. One patient had Mania (past). This patient had a positive family history of Bipolar Affective Disorder. This could be an incidental finding even though psychological stress is known to precipitate mania.39 Also the prevalence is 1 % in our study which is even less than the prevalence in general population thus it could be an artifact.40Studies have consistently found increased prevalence of adjustment disorder after disaster.41 In our study prevalence of adjustment disorder was 3% (N=3, anxiety 2, depression 1). In a study by Math et al 3 months after tsunami it was 13.5%.32 A lower prevalence in our study was again due to the long term nature of study. The role of trauma, stress, and negative life events as risk factors for suicidal ideation and behavior has long been recognized.42 A longitudinal investigation looking at the trends in suicidality and mental illness in the aftermath of Hurricane Katrina found significant increases in suicidal ideation and plans in the year after the disaster as a result of unresolved hurricane related stresses.43 The suicidality in our population sample was found to be 2% (N=2) of sample. These results were in tune with that of Kessler et al, although it was immediately after hurricane Katrina and hence a higher prevalence of 6.4%.43
Many symptoms of PTSD overlap with the symptoms of ADHD and CD.44 In our study, each of the disorders were present in 2 % of the sample. In one patient, they were comorbid with each other (ADHD with CD). In a study by Hoven et al 6 months after 9/11, the prevalence of CD was found to be as high as 12.8 %.30 This could be because of immediate post disaster nature of the study. Also because of the symptom overlap more weight was given to the PTSD diagnosis.
Three patients had a diagnosis of Substance Abuse, Tic Disorder and PDD, 1 % each. Though substance abuse is known to increase subsequent to disaster in adolescents,30 no evidence was found for relation of tic disorder or PDD to the post-disaster psychiatric stress. The cause of a low prevalence of substance abuse in our sample was because of the fact that the area is inhabited by Muslim population and hence alcohol is not religiously sanctioned, and, harder substances are either not available or they can’t be afforded. The only substance which is available is marijuana or cannabis. However, most used it only recreationally and the criterion for abuse was not met. Even the sole patient of substance abuse was also taking cannabis. Also, it is a well known phenomenon that drug dependent subjects do not reveal the true information and deny any history of abuse at first contact with the investigating team.45 Tic disorder and PDD are regarded as biological disorders and their relation to trauma is only incidental.46, 47
Studies have consistently shown presence of psychiatric comorbidities post disaster.48, 49 The same was observed in our study where 29.27 % of total patients had comorbid psychiatric diagnosis. Similar results were found by Kar and Bastia who found comorbidities in 39% of adolescents.29 PTSD is the most common comorbid disorder observed during the period post disaster48, 49 and the same was observed in our study with PTSD comorbid in 14.63 % (N=6) of cases. However when all the anxiety disorders were combined except PTSD, they were found to exceed the comorbidity of PTSD and they were comorbid in 21.95 % (N=9) patients. There is expanding literature regarding comorbidity of anxiety and depression in children and adolescents.50, 51, 52Similar comorbidity of an anxiety disorder (including PTSD) and depressive disorder (including Dysthymia) were seen in 7.32 % (N=3) of patients in our study. These results show that psychiatric diagnoses are frequently comorbid after the disaster and there is a need to be vigilant about them for a holistic psychiatric assessment, treatment and rehabilitation of the survivors.
Sociodemographic Profile: In our sample the prevalence of psychiatric morbidity was at maximum in pre-adolescents (6-10 years age group) and it was 61.29 % of the sample of pre-adolescents.This is consistent with the research that has suggested that younger children possess fewer strategies for coping with both the immediate disaster impact and its aftermath, and thus may suffer more severe emotional and psychological problems.53 Second commonest group was of 11-13 years with 40 % morbidity in them which was consistent with an earlier study which also found significant morbidity in this age group.54 The age characteristics of the total population also closely matched the above findings. More females than males were found to exhibit psychiatric morbidity in our study (47.17 % vs. 34.04 %). Though these findings were in tune with those of Hoven et al,their findings were a little lower than ours (34.7 % vs. 21.8 %).30 Some studies have found that girls express more anxiety-depressive disorders30 and PTSD symptoms55, 56 and boys seen to exhibit more behavioral problems.57 Similarly in our study rates of anxiety disorders, depressive disorders and PTSD were higher in girls and conduct disorder was exclusively found in boys.
Our study suggested that children up to 5th standard were (51.02 %) more susceptible than those in higher classes. This was in accordance with an earlier study by Kar et al.54 These findings are also in accordance with the findings of a study by Hoven et al. which found maximum morbidity (34.1 %) in preschoolers.30 Thus it could be said that higher educational status was protective, in addition to increasing age. Psychiatric morbidity was highest in children who were from joint family systems (48.15%). This was followed by children from extended nuclear (37.5%) and nuclear (27.27%) families. This pattern is consistent with an earlier study by Margoob et al.58 This could be because of the fact that in the sample of joint families there was loss of more family members in the tragedy. There were no cases of upper and upper-middle socio-economic class and lower-middle class was significantly less in our sample. This was because of the demographics per se and was not a sampling error. Consequently, higher morbidity was seen in the upper-lower socio-economic class (49.09%) followed by the lower class (31.71%). All the above findings are in accordance with an earlier study by Margoob et al.58
Psychiatric morbidity was not found to be influenced by the source of family income. Same was observed by Kar and Bastia in their study.29 The majority of the patients had poor social support (52.17%, p=0.03). These findings are substantiated by earlier studies.59 Loss of a parent was strongly associated with lower social support and high psychiatric morbidity. This was also reported by earlier studies.31, 60 Our study reported higher psychiatric morbidity in first-born children (71.43%). This could be due to increased burden of family matters on an eldest child subsequent to a disaster especially when head of family or mother has perished in such a catastrophe. This was in accordance with earlier studies on birth order and psychiatric morbidity.61 However in our study only childs also documented significant morbidity which is in contrast to earlier studies.61 This could be due to the fact that an only child had significantly less social support due to fewer siblings and death in the family due to disaster considerably compounding the problem. Also, often the youngest born is more pampered and hence more likely to feel emotionally insecure when attention is shifted from him in the aftermath of a disaster.
There was an unavoidable limitation in the study; the disaster-affected population was not compared with a normal or control population. The difficulty we faced was finding a control population as the area has a racially, geographically and culturally distinct population of Gujjars and all of them were affected. So no appropriate control group could be found. However if we compare it with most of the studies done in populations from the north India, the prevalence in our study is largely greater than those found In those studies.62
Conclusion
This research portrays and scrutinizes the experience of children and adolescents in the aftermath of a snowstorm disaster and supports the idea that children are susceptible to morbid psychological experiences long after the traumatic event has occurred. With that said, we want to stress the decisive role of support agents for children. These agents include the adults and peers who help children and youth recuperate in the long term. Provision of an outreach psychosocial and clinical service long after the disaster when no one is around to help after the initial knee jerk response of relief agencies is also stressed.
A 61-year-old lady underwent a modified radical mastectomy and axillary clearance in 2008 for a carcinoma of the left breast. Histopathology examination revealed two tumours within the left breast; a 16mm Grade 2 lobular carcinoma with probable vascular invasion and a 9mm Grade 1 infiltrating ductal carcinoma with no vascular invasion. She had clear resection margins. 21 out of 34 removed lymph nodes were positive for metastatic deposits. The tumour was oestrogen receptor positive and HER2 negative. She was staged as T1 N3a Mx and the tumour had a Nottingham Prognostic Index of 5.32. Metastatic workup revealed no distant metastasis.
Postoperatively, she required aspiration of a seroma but her recovery was otherwise satisfactory. She received adjuvant chemotherapy in the form of three cycles of Fluorouracil, Epirubicin and Cyclophosphamide and 3 cycles of Docetaxel. In addition, she had postoperative radiotherapy to the chest wall and supraclavicular fossa (40 Gy in 15 Fractions over 3 weeks) and hormonal therapy with Letrozole 2.5mg once daily.
The patient opted to undergo a prophylactic right mastectomy in 2010. She was regular in follow up and appeared to be free of disease recurrence for 6 years.
Her past surgical history included abdominal hysterectomy and bilateral salpingo-ophorectomy for fibroid disease as well as varicose vein stripping. She is a non-smoker and doesn’t consume alcohol. She had a family history of colon and cervical cancer in her uncle and sister respectively.
The patient visited the surgical outpatient clinic complaining of abdominal cramps, altered bowel habits and fatigue of a few months duration. There was no associated rectal bleeding, haematemesis, melaena, weight loss or urinary symptoms. Physical examination was unremarkable but she was noted to have gradually worsening renal function. Her symptoms were at first attributed to side effects of intravenous antibiotic treatment, which she received during an admission for cellulitis. She had already undergone an upper GI endoscopy which showed oesophagitis and ulceration; biopsies were within normal limits. She received treatment with proton pump inhibitors but her symptoms persisted.
A non-contrast abdominal CT scan was done, on account of her poor renal function, which showed bilateral hydronephrosis and thickening of the postero-superior aspect of the bladder wall. Considering the limitations of the non-contrast study, there were no other abnormalities. A colonoscopy was also done to investigate her altered bowel habit and it revealed a benign-looking stricture in the sigmoid about 25cm from the anal verge which was easily bypassed by the scope.
Figure 1. Benign stricture on flexible sigmoidoscopy
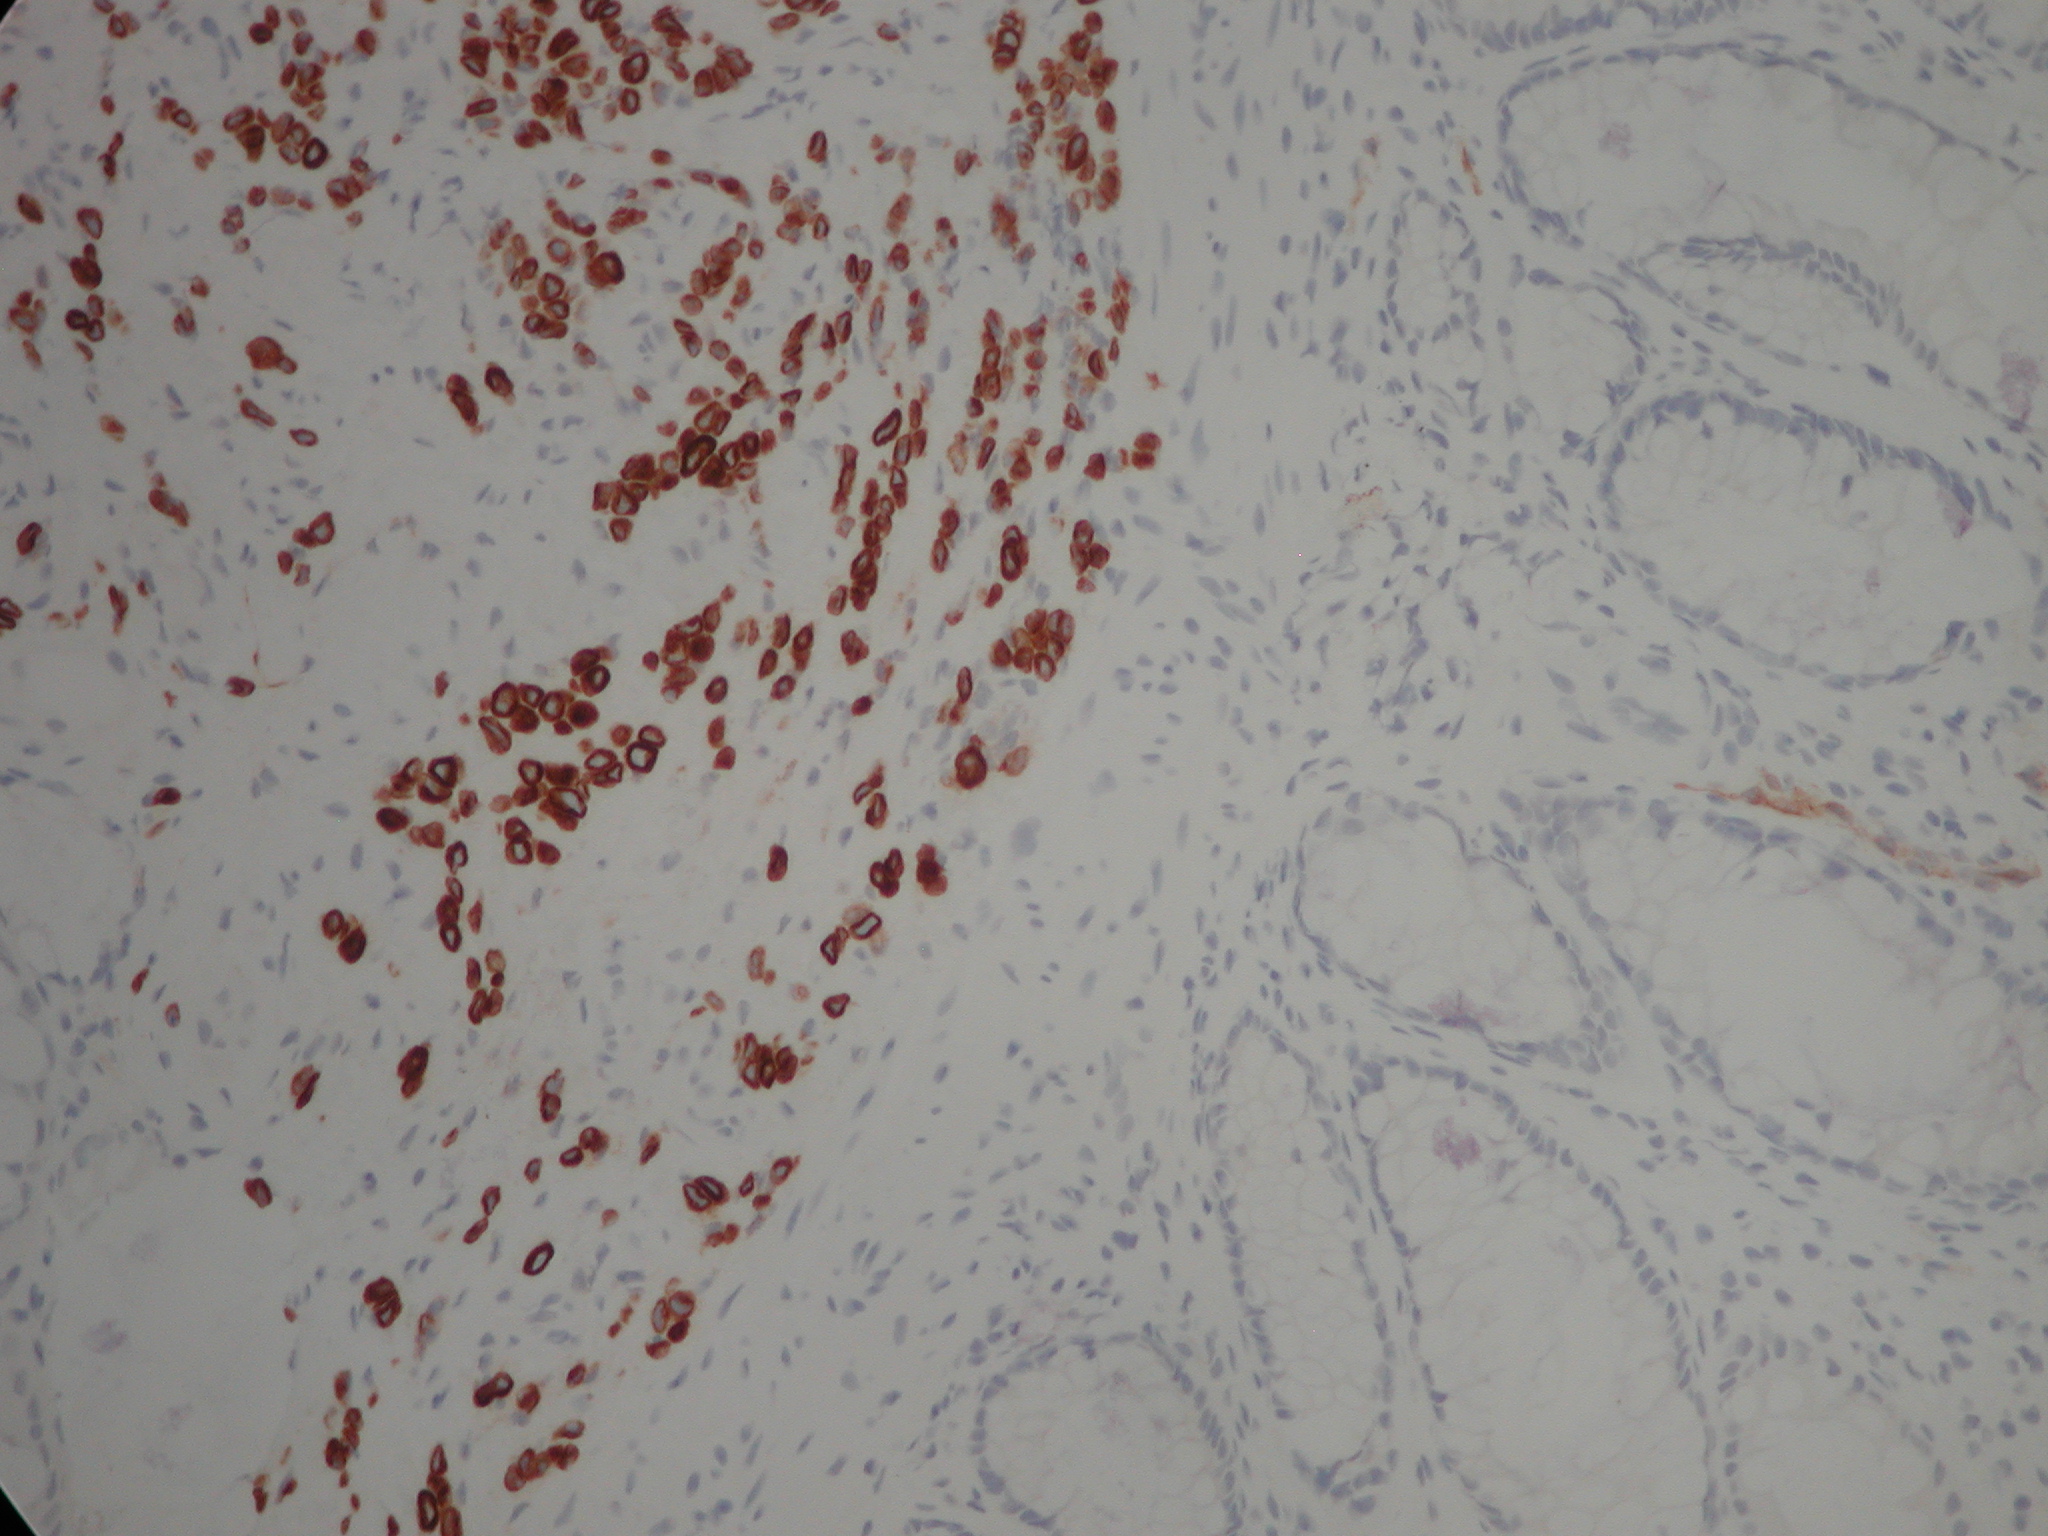
Biopsies of the sigmoid stricture showed an infiltrate of small to medium sized tumour cells in the submucosa, which had an Indian file pattern. They were positive for AE1/AE3 (pancytokeratins) and negative for CD68. They were positive for CK7 and negative for CK20, strongly positive for oestrogen receptors and HER2 negative. Taken in conjunction with the patient’s past history of an invasive lobular carcinoma of the breast, the appearance was consistent with a metastatic lobular carcinoma.
Figure 2. Clusters and cords of cells with positive cytoplasm for the cytokeratin immunostain CK7. Although the classical ‘Indian filing’ of lobular carcinoma is not well seen, the image clearly demonstrates that the large bowel glands are negative (normally CK20+, CK7-) and that the infiltrate is beneath the glandular mucosa (i.e. not originating from dysplastic glands within the mucosa and raising the possibility of infiltration from outside the bowel wall). The magnification is x200. Lobular carcinoma is usually CK7 +, CK20 -, ER +.
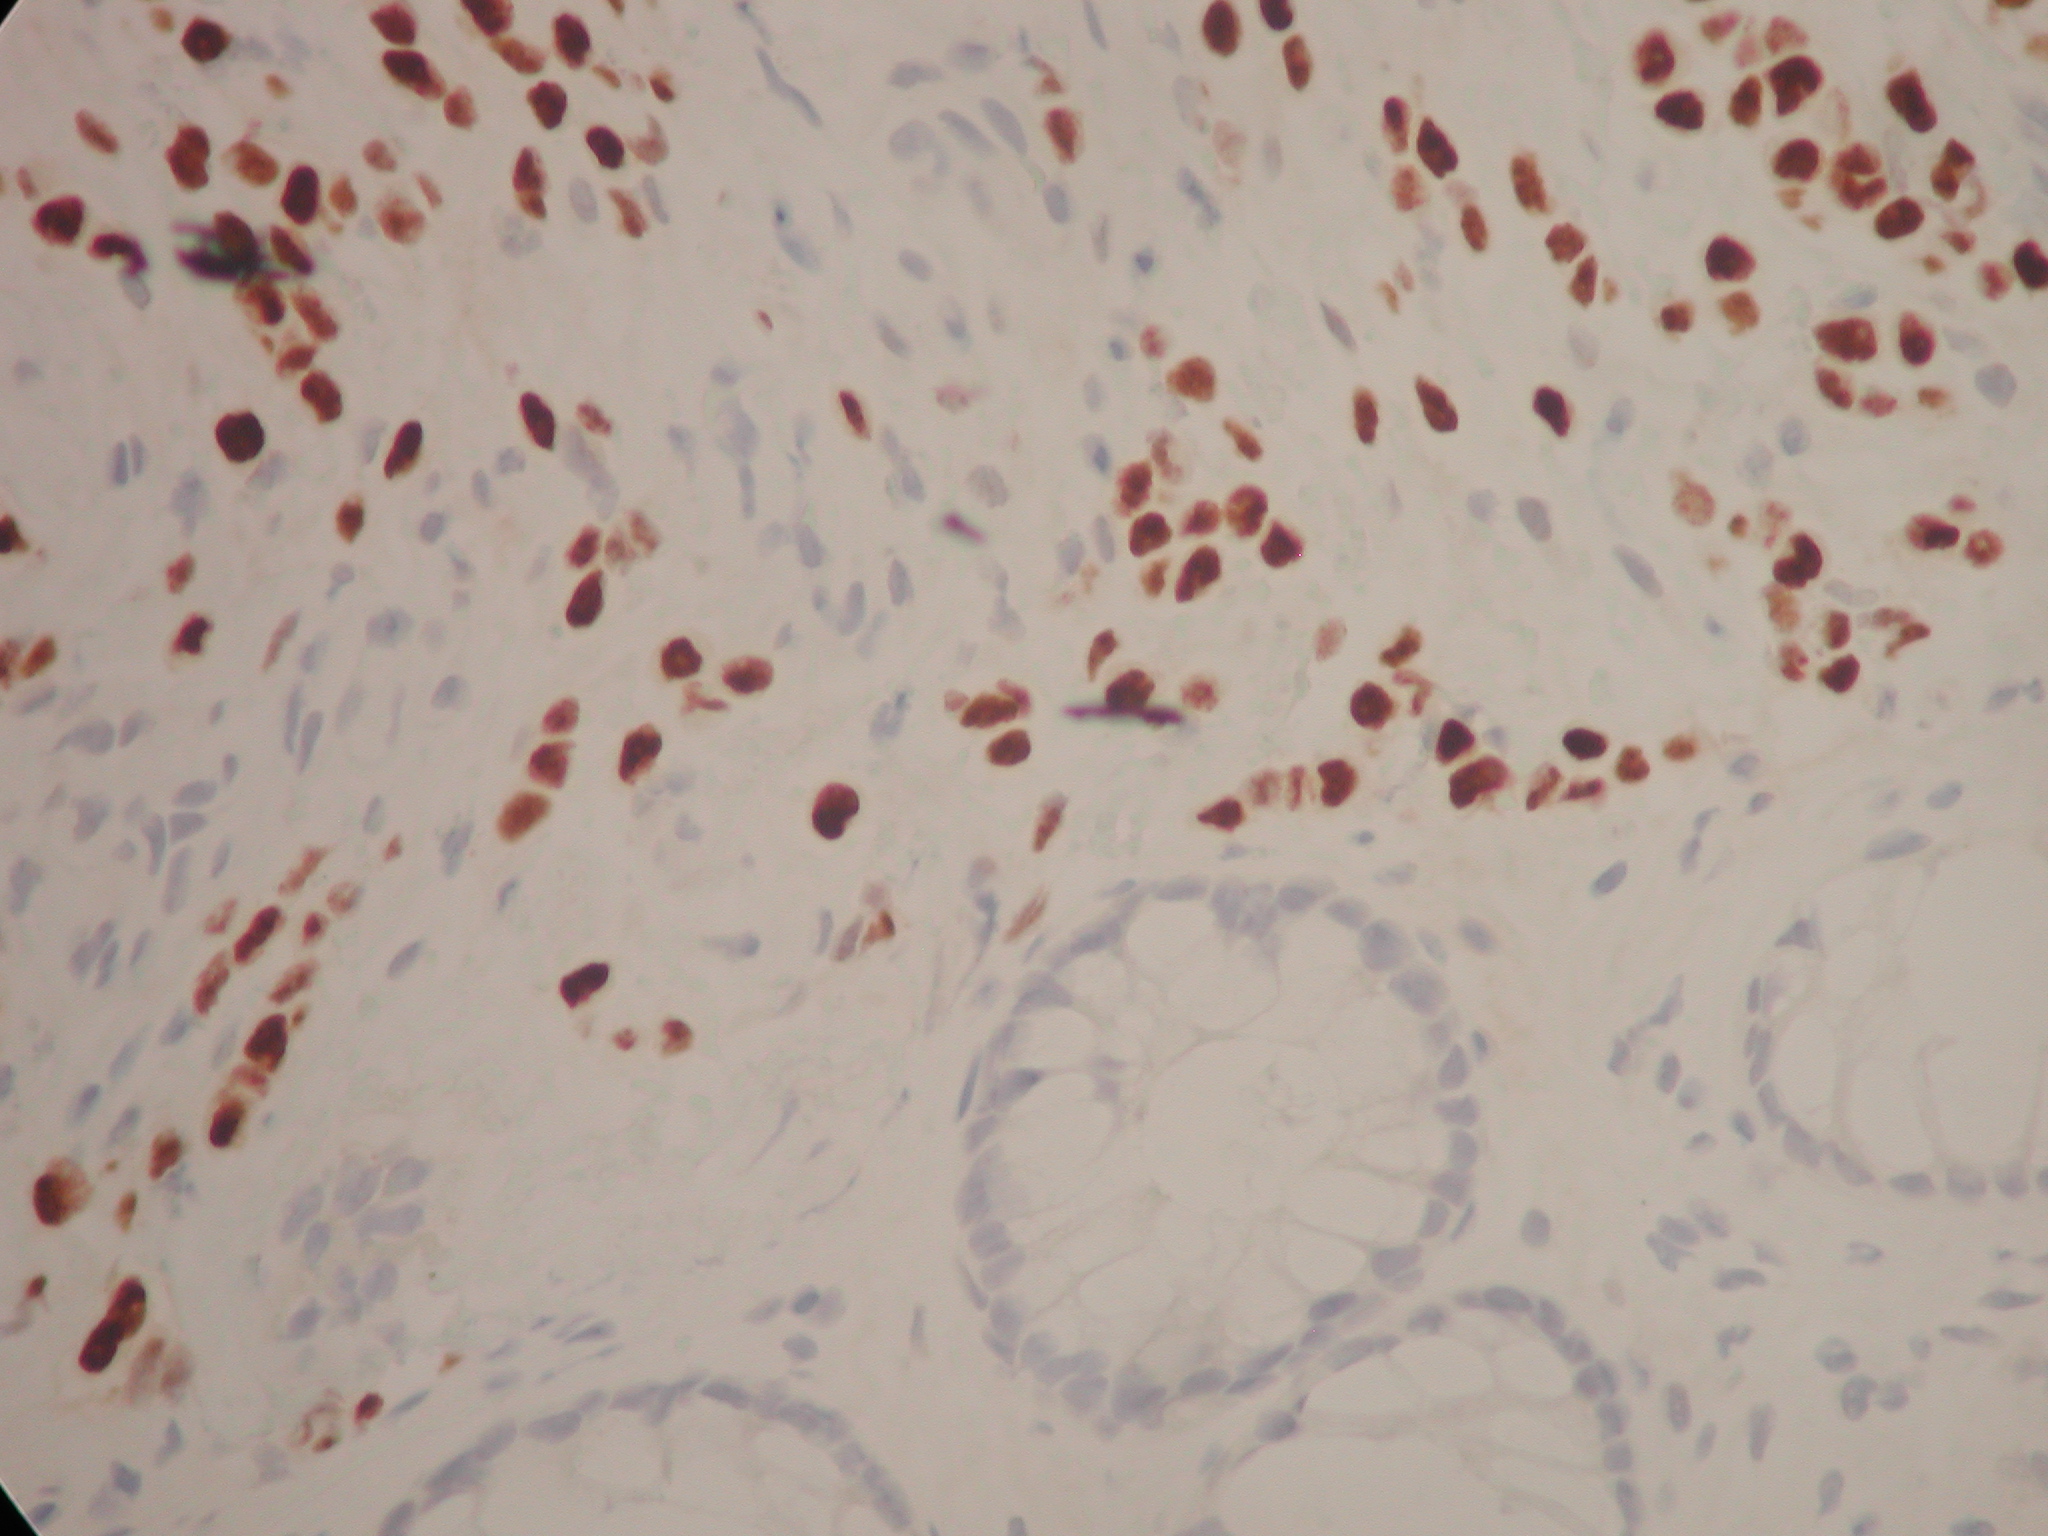
Figure 3. The same cells with their nuclei staining positively with an immunostain to oestrogen receptors. There are a few short chains of ‘Indian filing’ with the cells appearing rather rectangular in shape with straight margins. You can make out slight ‘moulding’ of the nuclei as they press against one another. The magnification is x 400.
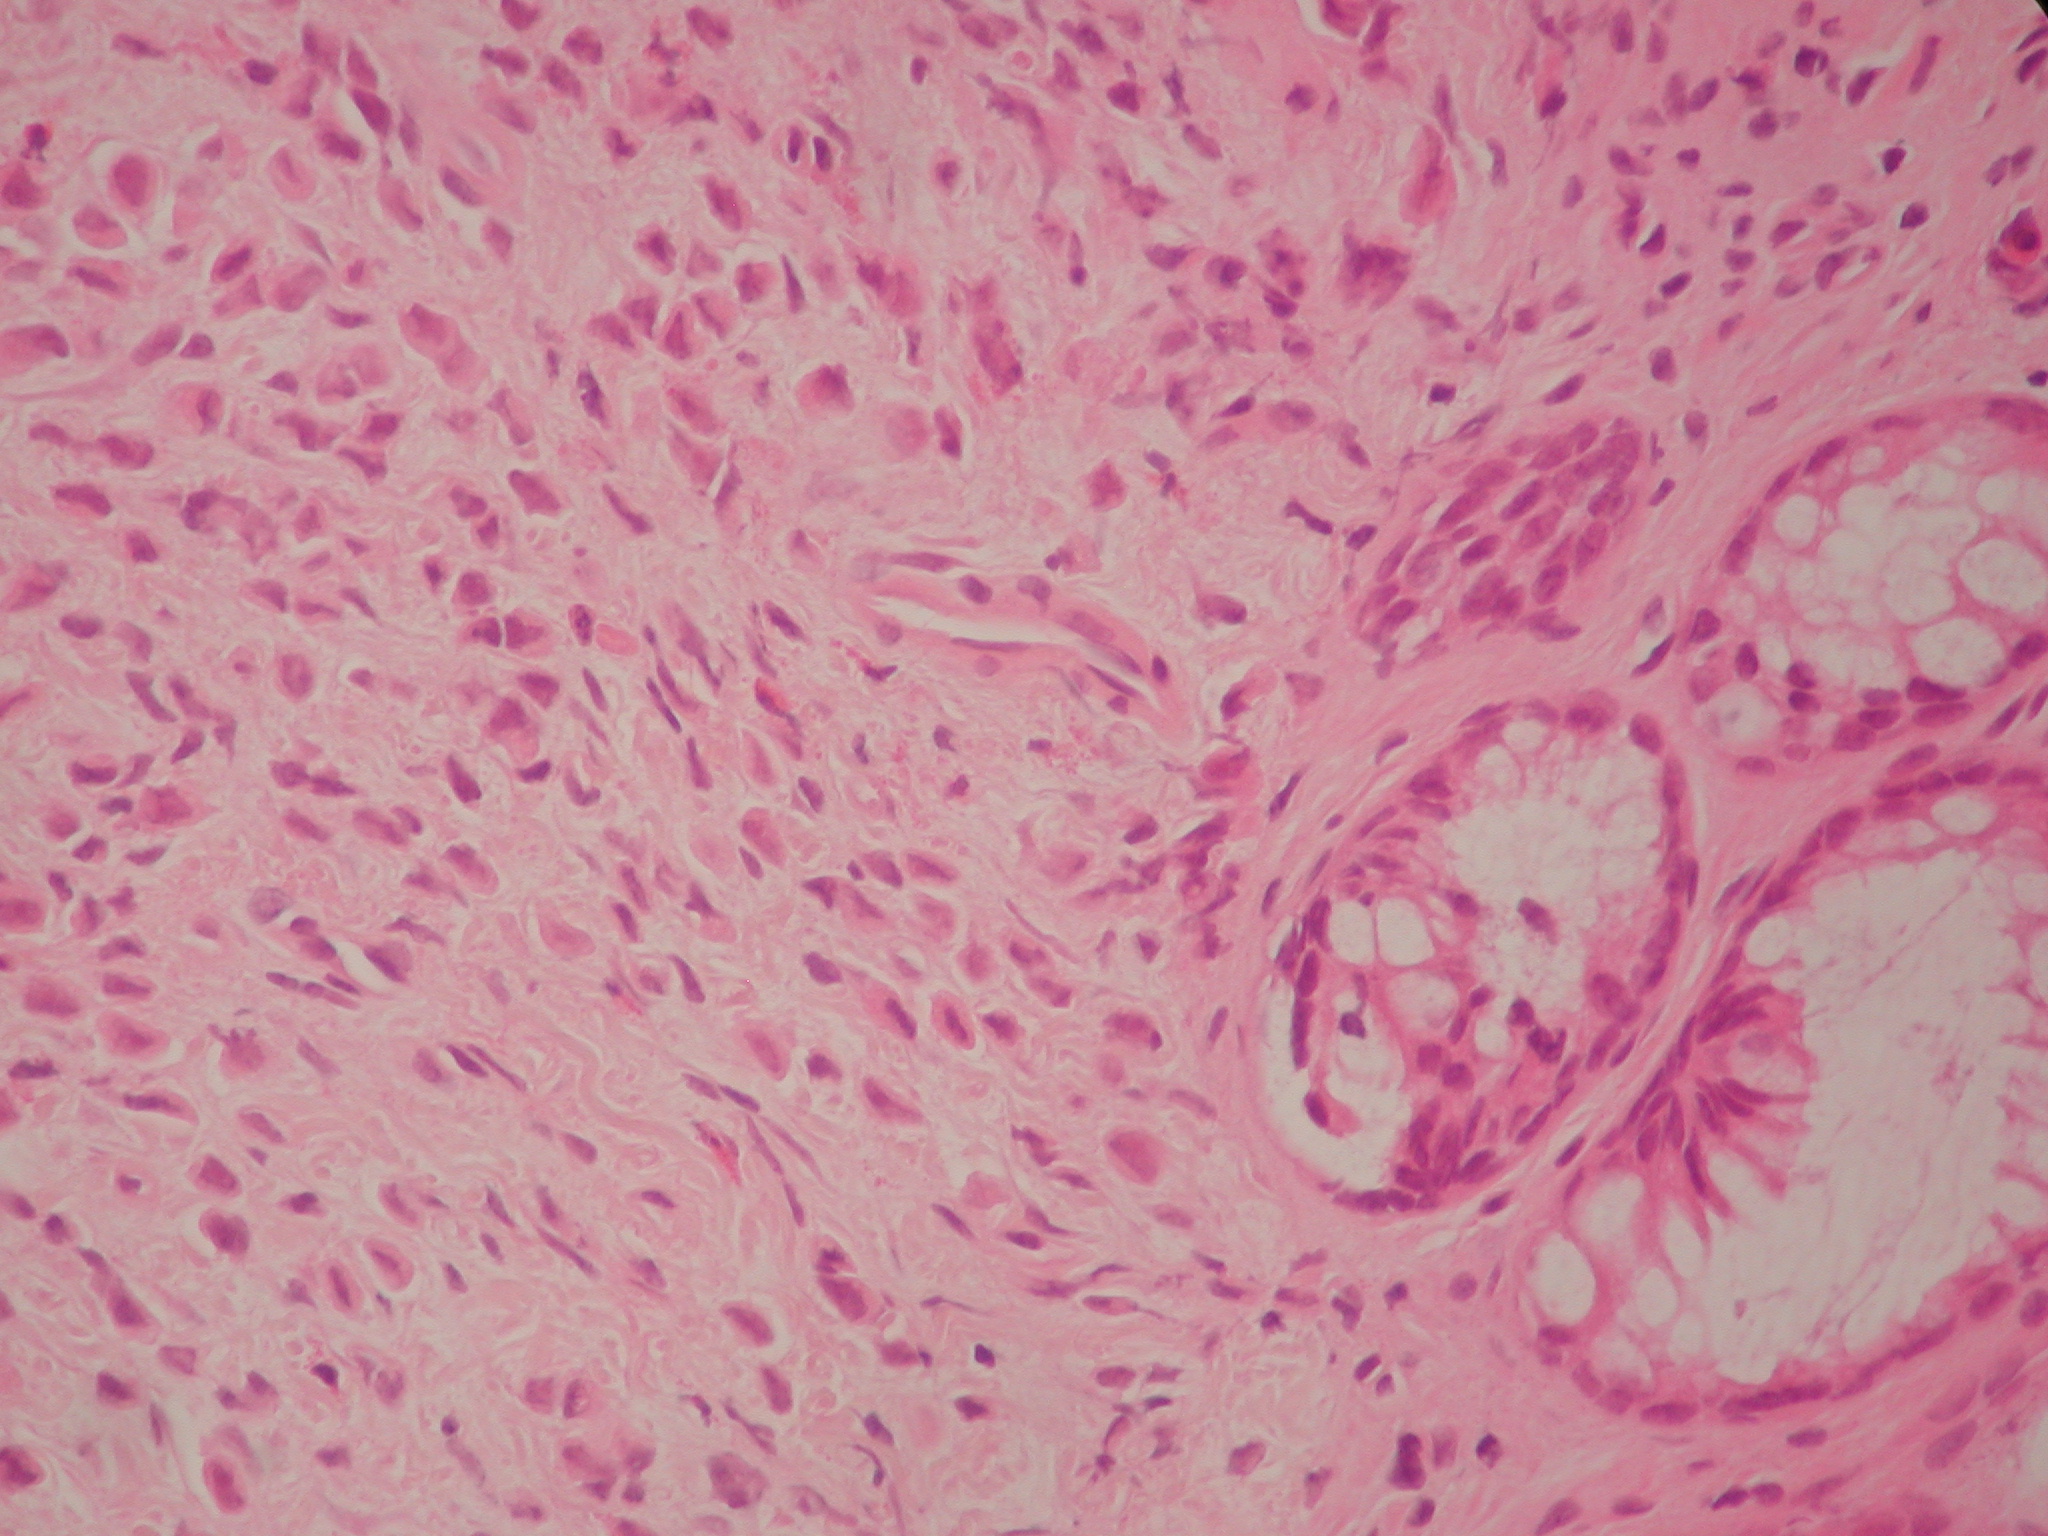
Figure 4. Haematoxylin and Eosin section at 400 magnification. This shows a diffuse infiltrate of single cells with eccentric nuclei.
The patient required a right nephrostomy and a cystoscopy with left double J ureteric stent insertion to address her hydronephrosis and deteriorating renal function before undergoing restaging of her disease.
DISCUSSION
In patients with history of breast cancer, isolated GI metastases are less common than benign disease processes or second primaries of the GI tract.1.2 In a retrospective review, 73 out of 12001 cases of breast cancer had gastrointestinal metastases, out of which 24 were to the colorectum3 and invasive lobular carcinoma was the commonest histological subtype. 3.4 However, sixteen percent of patients with breast cancer have GI metastases at postmortem examination1.
There might be a long interval of time between the diagnosis of breast cancer and development of gastrointestinal metastasis which together with their rare occurrence and nonspecific clinical and radiological manifestations adds to the diagnostic challenge. The median interval between the diagnosis and the development of GI metastasis was reported to be 6 years (range 0.25 to 12.5 years) by Schwarz et al 5with 25 years being the longest reported in the literature.6 Because of this long interval the history of a primary breast cancer can be missed. This also highlights the importance of long term follow up and maintaining an index of suspicion when these patients develop GI symptoms.
In our case, the interval between the diagnosis of breast cancer and colonic metastasis was 81 months. Her GI symptoms were initially attributed to side effects of antibiotic treatment for cellulitis and dyspepsia before investigating her with a colonoscopy. Even at colonoscopy the appearance was that of a smooth benign-looking stricture which did not seem to harbour any sinister pathology
Histological examination is probably the most reliable tool to make a diagnosis and it is prudent in such cases to compare the specimen with the original breast tumour. In this case, there were two primary tumours; an invasive ductal carcinoma as well as a lobular carcinoma but the metastatic disease favoured the lobular component, which is consistent with other published reports in the literature. The reasons why metastases favour lobular carcinoma are poorly understood. One explanation is the loss of E-cadherin expression, a molecule involved in cellular adhesion, in invasive lobular carcinoma7. A similar case in which the primary was a mixed ductal and lobular type with lobular subtype colonic metastasis was reported by Uygun et al.8 Immunohistochemistry can also help in establishing a diagnosis. Metastatic breast cancers tend to be positive for Oestrogen or Progesterone receptors as well as Gross Cystic Disease Fluid Protein-15.9, 10 It is, however, worth noting that primary colonic cancers can be oestrogen receptor positive in 30 to 70% of cases.11
Accurate histopathological diagnosis probably saved our patient an unnecessary surgical treatment for a primary colonic neoplasm as the main focus of her treatment should be systemic therapy for metastatic breast cancer.
CONCLUSION
GI tract metastases from breast cancer are a rare occurrence. The patients may present after a long interval from the original diagnosis and the clinical and radiological features are nonspecific with the diagnosis often established on histological examination. Moreover, the history of breast cancer may not be elicited in all cases and these patients may present to a gastroenterologist or colorectal surgeon rather than a breast surgeon or oncologist. Therefore, remaining vigilant to this possibility is advised in any patient with a history of breast cancer who presents with unexplained GI symptoms.
The American Diabetic Association (ADA) and the American College of Endocrinology (ACE) recommend HbA1c levels as diagnostic criteria for diabetes mellitus. Physicians have adopted HbA1c levels as a convenient way to screen for diabetes, as well as to monitor therapy. There exists concern that because HbA1c is formed from the glycation of the terminal Valine unit of the β-chain of haemoglobin, it may not be an accurate surrogate to ascertain glycemic control in certain conditions that affect the concentration, structure and function of haemoglobin. It makes logical sense to infer that HbA1c levels should at least in part reflect the average haemoglobin concentration ([Hb]). Kim et al (2010) stated that iron deficiency is associated with shifts in HbA1c distribution from <5.0 to ≥5.5% 1 and significant increases was observed in the patients' absolute HbA1c levels 2 months after treatment of anaemia.2 There is a dearth of literature on HbA1c levels in the anaemia population, and a reference range for this unique population does not currently exist. There are a few documented studies on this matter, the findings of which are at best, inconsistent.
It is thought that the various types of haemoglobin found in the myriad of haemoglobinopathies may affect haemoglobin-glucose bonding and/or the lifespan of haemoglobin, and by extrapolation, HbA1c level. Hence, extending target HbA1c values to certain haemoglobinopathaties may be erroneous due to potential differences in glycation rates, analytical methods (HbF interfers with the immunoassay method) and some physiological challenges (markedly decreased red cell survival).3
There is a significant positive correlation between haemoglobin concentration and HbA1c in the patients with haemolytic anaemia.4,5 Cohen et al (2008) reported that observed variation in red blood cell survival was large enough to cause clinically important differences in HbA1c for a given mean blood glucose,6 and haemolytic disorders may cause falsely reassuring HbA1c values.7 Jandric et al (2012) inferred that in diabetic population with haemolytic anaemia, HbA1c is a very poor marker of both overall glycemia and haemolysis.8 Mongia et al (2008) report that immunoassay methods for measuring HbA1c may exhibit clinically significant differences owing to the presence of HbC and HbS traits.9 However, Bleyer et al report that sickle cell trait does not affect the relationship between HbA1c and serum glucose concentration and it does not appear to account for ethnic difference in this relationship in African Americans and Caucasians.10
Koga & Kasayama (2010) advise that caution should be entertained when diagnosing pre-diabetes and diabetes in people with low or high haemoglobin concentration when the HbA1c level is near 5.7% or 6.5% respectively, citing the implication of changes in erythrocyte turnover. They further assert that the trend for HbA1c to increase with iron deficiency does not appear to necessitate screening for iron deficiency to ascertain the reliability of HbA1c in this population.11
In the light of the uncertainty in the influence of anaemia and haemoglobinopathies on HbA1c, it is imperative that clinicians are aware of the caveats with HbA1c values when they make management decisions in the anaemic population.12 There is currently a call for the use of other surrogates for ascertaining average glycemic control in pregnancy, elderly, non-Hispanic blacks, alcoholism, in diseases associated with postprandial hyperglycemia, genetic states associated with hyperglycation, iron deficiency anaemia, haemolytic anaemias, variant haemoglobin states, chronic liver disease, and end-stage renal disease (ESRD).13,14
Study objectives and hypothesis
The study attempts to discern clinical differences in HbA1c levels in patients with anaemia compared to non-anaemic population, as well as to quantify and show the direction of such difference if they indeed exist. We hypothesize that as glucose is covalently bound to haemoglobin in glycosylated haemoglobin, HbA1c levels in non-diabetic anaemic population is significantly lower than in non-diabetic, non-anaemic population.2 However, this relationship may not hold true for certain anaemias, haemoglobinopathies and hyperglycation states in some genetic syndromes.
Study design and method
The study is a retrospective chart review of patients with and without anaemia who underwent haemoglobin concentration and HbA1c level testing at The Brooklyn Hospital Center (TBHC) from July, 2009 to June, 2013. Using Cohen (1987) power table, assuming a power of 0.8, alpha level of 0.05, and a small effect size of 0.2 standard deviations (SD), sample size estimation of 461 was computed. A convenient sampling method was used to select patients who meet inclusion criteria, absent exclusionary conditions. In using this sampling method, we queried the electronic medical record at the TBHC using the below-listed inclusion and exclusion criteria. The query generated a list of “potential subjects”. We then reviewed the electronic chart of each patient on this list to confirm that they indeed meet all study criteria (excluding further if any exclusion criteria was identified on “second look”. We continued the selection until the computed minimum sample size of 461 was significantly exceeded. During this process, we had to examine every patient on the “potential subject” list generated by the initial query to achieve this goal. For the purpose of the study, anaemia is defined as haemoglobin concentration <11g/dl.
Inclusion criteria:
iStudy participant must be at least 21 years of age. We adopted this age criteria because at TBHC, electronic medical records was only available for the non-pediatric population over the study period. Patients below 21 years were managed at the pediatrics department using paper charts until the recent adoption of the EMR system. It would have been difficult conducting the study using paper charts.
iStudy participant must have at least one documented HbA1c level obtained within a month of a haemoglobin concentration assay. This criterion was adopted to allow for more inclusiveness in the study. It is our experience that haemoglobin assays may not be available on the same day as HbA1C assays considering the retrospective nature of the study.
Exclusion criteria:
Confirmed cases of diabetes mellitus (using two or more of the following: presence of symptoms related to diabetes, fasting blood glucose, 2 hours post-prandial glucose, and oral glucose tolerance test).
Documented history of gestational diabetes (GDM)
Documented history of endocrinopathy with affect for glycemic control
Current or prior use of medication with potential to increase or decrease HbA1c (includes, but not limited to antidiabetics, corticosteroids, statins, and antipsychotics)
Pregnancy or pregnancy-related condition within three months of HbA1c assay
Haemoglobin concentration <6 g/dl or >16g/dl.
Blood loss or blood transfusion within two months of HbA1c assay
The study assumed a consistent HbA1c assay method at the study center over the study period. 482 (229 anaemic and 253 non-anaemic) were selected. The study reviewed electronic medical records of selected patients, extracting data on HbA1c, fasting blood glucose (FBG), 2-hour post-prandial serum glucose (2HPPG), 2-hour oral glucose tolerance test (OGTT), haemoglobin concentration and electrophoresis, and anaemia work-up results when available. Subsequent measures of HbA1c two months after correction of anaemia was also documented and compared to pre-treatment levels.
Results and Analysis
The mean age of the anaemic and non-anaemic was 51.8 and 64.6 years respectively. Using the student’s t-test and x2 analysis respectively, the difference in mean age of both groups (anaemia and non-anaemic) was significant at p0.05 while gender distribution was similar (p>0.05), see table 1. The mean HbA1c for anaemic and non-anaemic groups was 5.35% and 5.74% respectively, amounting to a 0.4 unit difference in (8%) in mean HbA1c. This difference was statistically significant (p0.02). A significantly higher variance was observed in the anaemia group (0.79 vs. 0.64).
Table 1: Gender and age distribution and statistics
Age in years Anaemia
#(%)
Gender (M/F)
Mean Age (in yrs)
21-44
20(8.7)
17/41
45-64
76(33.2)
43/86
≥65
133(58.1)
10/32
Total
229(100.0)
70/159
64.6
Non-anaemic
21-44
64(25.3)
23/42
45-64
134(53.0)
58/81
≥65
55(21.7)
18/31
Total
253(100)
99//154
51.8
p-Values: Age=0.023, Gender=0.061
Assuming that 95% of the population is normal, computation of HA1c reference range (mean ±1.96SD) for the anaemia and non-anaemic group yielded 3.8-6.9 and 4.5-7.0 respectively. There was a significantly positive spearman correlation between [Hb] and HbA1C (r=0.28, p0.00). The mean HbA1c level and proposed reference ranges for the five anaemia subgroups (anaemia of chronic disease [ACD], iron deficiency anaemia [IDA], mixed anaemia, macrocytic anaemia and sickle-cell disease) are shown in table 2. Using one-way ANOVA analysis, the difference in the mean [Hb] and HbA1c across anaemia subtypes was not statistically significant (p0.08 and p0.36 respectively), see table 2.
Table 2: Anaemia subtypes with HbA1c statistics
Anaemia Type
#
Mean[Hb]
MeanHbA1c
95% CI (HbA1c)
Ref. range (HbA1c)
ACD
92
9.23
5.41
5.24-5.59
3.5-7.1
IDA
78
9.41
5.38
5.22-5.54
3.9-6.8
Mixed
11
9.11
5.21
4.82-5.59
3.9-6.5
Macrocytic
43
8.83
5.14
4.92-5.37
3.7-6.6
SCD
5
9.12
5.55
4.84-6.26
3.8-7.3
Anaemia (all types)
229
9.21
5.35
5.24-5.44
3.8-6.9
Non-anaemic
253
12.87
5.735
5.66-5.81
4.5-7.0
p-values: [Hb] for anaemia subtypes=0.08, HbA1C for anaemia subtypes=0.36, HbA1C anaemia vs. non-anaemia=0.02. ACD: anaemia of chronic disease, IDA: iron deficiency anaemia, SCD: sickle cell disease.
The study also examined the anaemia group to document the effect of anaemia correction on HbA1c levels. Only 62 of the 229 anaemic participants had documented [Hb] and HbA1c after interventions to correct anaemia, see table 3 and 4.
Table 3: Trend in [Hb] and HbA1c
N
Mean
SD
SEM
Change
p-Value
[Hb]1
62
9.2
1.07
0.14
[Hb]2
62
10.1
1.98
0.25
[Hb]=0.9
0.00
HbA1c1
62
5.37
0.69
0.88
HbA1c2
62
5.35
0.66
0.83
HbA1c=0.02
0.78
[Hb]1 and [Hb]2: haemoglobin concentration pre- and post- treatment for anaemia. HbA1c1 and HbA1c2: HbA1c pre- and post-treatment for anaemia
Table 4: Trend in [Hb] and HbA1c for anaemia subtypes
N
Mean[Hb]1
Mean[Hb]2
Δ Hb
pValue
MeanHbA1c1
MeanHbA1c2
ΔA1c
pVal
ACD
33
9.1
9.7
0.6
0.0
5.44
5.35
0.09
0.3
IDA
21
9.4
10.7
1.3
0.0
5.30
5.33
0.03
0.8
Mixed
1
Macrocytic
6
SCD
1
Total
62
9.2
10.1
0.9
0.0
5.37
5.35
0.02
0.8
ΔHb: change in haemoglobin concentration ([Hb]), ΔA1c: change in HbA1c
Using the student’s t-test, analysis, a 0.9g/dl mean improvement in [Hb] in the anaemia group (significant at p0.00) did not result in a statistically significant change in HbA1c (-0.02 units, p0.78). Similar results were obtained with anaemia of chronic disease and iron deficiency anaemia (ICD: change [Hb] =+0.6g/dl, change HbA1c=0.09, p0.31; IDA: change [Hb]=+1.3g/dl, change HbA1c=0.03, p0.79).
Discussion
There was an over-representation of the elderly in the anaemia group (58.1% vs. 21.7%). This is not unexpected as nutritional anaemia and anaemia of chronic disease increase in prevalence with the increasing co-morbidities associated with increasing age. The linear relationship between [Hb] and HbA1c holds true for anaemic and non-anaemia populations. There is a statistically significant difference of 0.4units (8%) in the mean HbA1c between the anaemic and the non-anaemic population. This difference is even more marked when the lower limit of the range is compared (3.8 vs. 4.5, difference of 0.7unit, 18%), the significance of which is not as clinically impacting as the upper limit of the range (diabetes mellitus diagnostic criteria). However, the relatively lower limit of normal for HbA1c in anaemic subgroups (especially of anaemia of chronic disease) may make low values of HbA1c in these patients less indicative of over-enthusiastic glycemic control, as well as less predictive of the increase in mortality associated with such tight control.
The upper range of normal for HbA1c for the anaemia and the non-anaemic groups and by extrapolation the proposed diagnostic criteria for diabetes, is however more similar (6.9 vs. 7.0%). This result appear consistent with Koga and Kasavama (2010) assertion that the trend in HbA1c does not appear to necessitate screening for iron deficiency to ascertain the reliability of HbA1c in this population.11 Our observation is explained by the greater variance associated within the anaemia group. The significantly higher variance observed in the anaemia may be explained by the convenient homogenization of clinically heterogeneous anaemia entities in the anaemia group. Perhaps a prospective study that avoids this may report differently.
The significantly higher variance (23%) in the anaemia is explained by the heterogeneity of the subtypes within the anaemia group. The myriad of pathophysiologies (from variant haemoglobin affecting structure and function, and perhaps glycation rates of haemoglobin, to shortened erythrocyte lifespan due to intravascular and extravascular haemolysis) accounts for a less precise HbA1c reference range for the anaemia group. Separating the anaemia group into unique anaemia subtypes created less heterogeneity, reduced some within group variance and yielded a more precise references range for some anaemia subtypes.
The widened 95% CI of mean and reference ranges observed with mixed and sickle cell anaemia (95% CI of mean =4.82-5.59 and 4.84-6.26 respectively) may be attributable in part to the small number of participants in these subgroups (11 and 5 respectively, the normal curve is less robust in these circumstances [when n<30])). Furthermore, the marked variability in the type, severity, and the number of chronic morbidities and deficiencies causing mixed anaemia may be contributing. The imprecision of HbA1c observed with the sickle cell may be compounded by the unstable clinical course of sickle disease, marked by periodic crises with fluctuating [Hb] associated with intermittent or chronic haemolysis. These observations make the case for defining HbA1c reference ranges for each anaemia type.
A modest correction of anaemia (Δ [Hb] of +0.9g/dl, i.e <1g/dl) did not appear to cause a significant change in HbA1c levels. It is possible that higher increments in [Hb] may produce significant change in HbA1c (we predict in the direction of increment). A similar pattern was observed with anaemia of chronic disease and iron deficiency anaemia subtypes, where improvements in [Hb] of 0.6 and 1.3g/dl respectively did not cause a significant change in HbA1c. We propose that with anaemia of chronic disease, the change in [Hb] concentration was too modest to cause a significant change in HbA1c. The relative small size of participants (33) examined also makes type II statistical errors highly likely. We further propose that with anaemia of chronic disease, the myriad of functional cellular and system abnormalities (many, potentially affecting cellular homeostasis, especially acid-base balance and haemoglobin molecule covalent binding) associated with the primary disorder may impact on the potential for increase in HbA1c with increasing [Hb]. In view of the retrospective nature of the study, we could not ascertain the timelines of certain interventions and hence accurately determine the persistence of anaemia correction. Theoretically, a recent correction in [Hb] is less likely to impact on HbA1c. As alluded to above Kim et al (2010) evaluated for changes in HbA1c two months after correction of anaemia. Similar explanations are offered for the observation with iron deficiency anaemia. There were only 21 participants in the iron anaemia subgroup (i.e. <30, probable violation of a rule for use of parametric tests), making the parametric statistical tests less robust for the analysis. We did not study patterns with mixed, macrocytic and SCD, as each subtype had <7 (1,6,1) participants.
The study examined a large volume of data, eliminating as much as possible, potential extraneous factors in the relationship between [Hb] and HbA1c levels. However, the retrospective nature of the study made the control of other extraneous variables and certain patient attributes infeasible. It was also difficult to discern critical timelines and hence eliminate the potential impact of certain therapeutic interventions. Also, our exclusion of the younger population of patients (i.e. 16-20 years) does not necessarily indicate the result of the study may not be extended to this population of anaemia patients. In fact the similar human haemoglobin physiology in this group advises that the results may be extended to this younger population without concern. Due to the retrospective nature of the study, and in our attempt to increase inclusiveness, we allowed haemoglobin concentration and HbA1c assays done within a month of each other. In reality though, the majority (57%) had same day assays and even a greater majority (79%) had within same week assays. We recommend a larger scale prospective study with participants representative of all anaemia subtypes and ages so that the results can be extrapolated to the general population of anaemia patients.
Conclusion
The study emphasizes the need to exercise caution when applying HbA1c reference ranges to anaemic populations. It makes the case for defining HbA1c reference ranges and thus, therapeutic goals for each anaemia subtype. Redefining such reference ranges may increase the sensitivity of HbA1c in diagnosing diabetes in anaemic population if indeed the lower mean HbA1c (observed in this study) translates into significantly lower upper limits of references ranges (not observed in this study). Also, the realized reduced lower limits of reference range in this population will lead to appropriate clinical tolerance for lower HbA1c levels, with avoidance of inappropriate intervention for erroneous perception of over-enthusiastic control of diabetic hyperglycemia. We recommend that, absent risks factors for and symptoms relatable to diabetes, marginal elevations in HbA1c levels (i.e. HbA1c >6%) in anaemic patients should warrant confirmation of diagnosis using fasting blood glucose and 2HPPG or OGTT. The use of other surrogates of glycemic control, immune to the blur associated with haemoglobin type and concentration, may circumvent the problem associated with use of HbA1c in this special population. To this end, fructosamine and glycated albumin assays are currently being examined. 1,15
Lumbar punctures are commonly performed by both medical and anaesthetic trainees but in different contexts. Medically performed lumbar punctures are often used to confirm a diagnosis (meningitis, subarachnoid haemorrhage) whilst lumbar puncture performed by anaesthetists are usually a precedent to the injection of local anaesthetics into cerebrospinal fluid for spinal anaesthesia. The similarity relies on the fact that both involve the potential for iatrogenic infection into the subarachnoid space. The incidence of iatrogenic infection is very low in both fields; a recent survey by the Royal College of Anaesthetists1 reported an incidence of 8/707 000 whilst there were only approximately 75 cases in the literature after ‘medical’ lumbar puncture.2 However, the consequences of iatrogenic infection can be devastating. It is likely that appropriate infection control measures taken during lumbar puncture would reduce the risk of bacterial contamination. The purpose of the present study is to compare infection control measures taken by anaesthetic and medical staff when performing lumbar puncture.
Method
A survey was constructed online (www.surveymonkey.com) and sent by email to 50 anaesthetic and 50 acute medical trainees in January 2011. All participants were on an anaesthetic or medical training programme and all responses were anonymous. The survey asked whether trainees routinely used the following components of an aseptic technique3 when performing lumbar puncture:
Sterile trolley
Decontaminate hands
Clean patient skin
Apron/gown
Dressing pack
Non-touch technique
Sterile gloves
No ethical approval was sought as the study was voluntary and anonymous.
Results
The overall response rate was 71% (40/50 anaesthetic trainees and 31/50 medical). All anaesthetic trainees routinely used the components of an aseptic technique when performing lumbar puncture. All medical trainees routinely cleaned the skin, decontaminated their hands and used a non-touch technique but only 80.6% used sterile gloves. 61.3% of medical trainees used a sterile trolley, 38.7% used an apron/gown and 77.4% used a dressing pack.
Discussion
This survey shows that adherence to infection control measures differ between anaesthetic and medical trainees when performing lumbar puncture. The anaesthetic trainees have a 100% compliance rate compared to 80% for the medical trainees for all components of the aseptic technique. Both groups routinely cleaned the patient’s skin, decontaminated their hands and used a non-touch technique. However, there were significant differences in the use of other equipment, with fewer medical trainees using sterile gloves, trolleys, aprons and dressing packs.
Although the incidence of iatrogenic infection after lumbar puncture is low, it is important to contribute to this low incidence by adopting an aseptic technique. There may be differences with regards to the risks of iatrogenic infection between anaesthetic and medical trainees. Anaesthetic lumbar punctures involve the injection of a foreign substance (local anaesthesia) into the cerebrospinal fluid and may therefore carry a higher risk. Crucially however, both anaesthetic and medical lumbar punctures involve accessing the subarachnoid space with medical equipment and so the risk is present.
There are many reasons for the differing compliance rates between the two specialties. Firstly, anaesthetic trainees perform lumbar punctures in a dedicated anaesthetic room whilst the presence of ‘procedure/treatment rooms’ is not universal on medical wards. Secondly, anaesthetic trainees will always have a trained assistant present (usually an operating department practitioner, ODP) who can assist with preparing equipment such as dressing trolleys.
The mechanism of iatrogenic infection during lumbar puncture is not completely clear.4 The source of microbial contamination could be external (incomplete aseptic technique, infected equipment) or internal (bacteraemia in the patient); the fact that a common cause of iatrogenic meningitis are viridans streptococcus strains5 (mouth commensals) supports the notion that external factors are relevant and an aseptic technique is important.
It is very likely that improved compliance amongst acute medical trainees would result from a dedicated treatment room on medical wards, but this is likely to involve financial and logistical barriers. The introduction of specific ‘lumbar puncture packs’, which include all necessary equipment (e.g. cleaning solution, aprons, sterile gloves) may reduce the risk of infection; the introduction of a specific pack containing equipment for central venous line insertion reduced colonisation rates from 31 to 12%.6 The presence of trained staff members to assist medical trainees when performing lumbar puncture may assist in improved compliance, similar to the role of an ODP for anaesthetic trainees.
The main limitation of this study is that the sample size is small. However, we feel that this study raises important questions as to why there is a difference in infection control measures taken by anaesthetic and medical trainees; it may be that the environment in which the procedure takes place is crucial and further work on the impact of ‘procedure rooms’ on medical wards is warranted.
Non-attendance in outpatient clinics accounts for a significant wastage of health service resources. Psychiatric clinics have high non-attendance rates and failure to attend may be a sign of deteriorating mental health. Those who miss psychiatric follow-up outpatient appointments are more ill with poor social functioning than those who attend (1). They have a greater chance of drop out from clinic contact and subsequent admission (1). Non-attendance and subsequent loss to follow up indicate possible risk of harm to the patient or to others (2).
Prompts to encourage attendance at clinics are often used and may take the form of reminder letters (3), telephone prompting(4) and financial incentives (5). Issuing a copy of the referral letter to the appointee may prompt attendance for the initial appointment (6). Contacting patients by reminder letters prior to their appointments has been effective in improving attendance rates in a number of settings, including psychiatric outpatient clinics and community mental health centres (3).
Studies investigating the efficacy of prompting for improving attendance have generated contrasting findings and non-attendance remains common in clinical practice. We, therefore, carried out a naturalistic, prospective controlled study to investigate whether reminder letters would improve the rate of attendance in a community-based mental health outpatient clinic.
Design and Methods
The study was carried out at the Community Mental Health Centres based in Runcorn and Widnes in Cheshire, UK. The community mental health team (CMHT) provides specialist mental health services for adults of working age. Both CMHTs are similar in demographics, socio-economic need and, have relatively higher non-attendance rates in the clinic. In the week prior to the appointment, clerical staff from community mental health team sent a standard letter to some patients reminding the date and time of the appointment and name of the consulting doctor. They recorded whether patient attended, failed to attend or cancelled the appointment irrespective of whether they had received a reminder letter or not.
We compared the attendance rates between experimental group (those who had received the reminder letters) and the control group ( those who had not received the reminder letters) over a period of 18 months. Throughout the study period, the same medical team held the clinics and there had been no major change in the outpatients’ clinic setting or administrative and procedural changes influencing outpatients’ attendance. Care Planning Approach (CPA) was implemented and in operation even before the introduction of reminding letters at both the sites.
Attendance rates for all the clinics held during the study period were obtained from medical records. For all subjects who failed to attend, age and gender, was obtained from patients’ database. Patients whose appointments were cancelled were also included in the study.
Statistics and Data analysis
The data was analysed using SISA - Simple Interactive Statistical Analysis (7). Chi -squared tests were used to investigate the attendance rates between the groups, new patients and follow-ups, with the P value for statistical significance set at 0.05. Odds ratios were calculated to measure the size of the effect. In addition, we examined how age and gender may have influenced the effect of the text based prompting on attendance.
Results
In the experimental group a total of 114 clinics were booked, with clinic lists totalling 843 patients. Of these, 88 were new referrals and 755 were follow-up appointments. 65 of 114 clinics had full attendance. A total of 228 patients failed to attend the clinic. Of those who failed to attend, 25 patients were new referrals and 203 were follow-up patients. 28 follow up patients and 2 patients newly referred to the team called to cancel their appointments.
In the control group, a total of 71 clinics were booked amounting to a total of 623 patients. Of these, 86 were new referrals and 537 were for follow-up patients. Only 25 out of 71 clinics had full attendance. A total of 211 patients failed to attend. Of those who failed to attend, 32 were new referrals and 179 were follow-up patients. 55 follow up patients and 13 patients newly referred to the team called to cancel their appointments.
Of those who failed to attend in the experimental group, 98 (43%) were women. The mean age of non-attendees was 38 years; with a range of 18-76 yrs .Of those who failed to attend in the control group110 (52%) were women. The mean age of non-attendees was 32 years; with a range of 19-70 yrs.
In our study, failure to attend was not distributed evenly but had seasonal peaks at Christmas and during the summer vacation period.
The outcome from prompting in the experimental group is compared with the control group and displayed in Table 1.
Outcomes
Control group n (%)
Experimental group n (%)
χ2 (df)
P
OR (CI)
No of clinics with full attendance
25
65
8.32
0.0039
2.44(1.32-4.50
Total No of Pts attended
344
585
15.05
0.0001
1.57(1.25-1.98)
No of new Pts attended
41
61
3.743
0.053
1.9 (0.98-3.67)
No of follow up Pts attended
303
524
11.39
0.0007
1.52(1.19-1.94)
No of Cancellations
68
30
38.63
0
3.85(2.46-6.04)
χ2 = Chi square, df = degree of freedom, OR= Odds Ratio, CI= Confidence Interval
The attendance rate in the experimental group was 71.95% (585/813) as opposed to 56.57% (344/555) in the control group (OR=1.57; p=0.0001).
The attendance rate for new patients in the experimental group was 70.9%( 61/88) as opposed to 56.16 %( 41/ 86) in the control group (OR=1.9; p=0.053).
The attendance rate for follow up patients in the experimental group was 72.0%( 524/727) and 62.8% (303/482) in the control group (0R=1.52; p=0.0007).
In addition, there were significantly more (by 22%) number of clinics with full attendance in the experimental group (OR= 2.44, P=0.003).
The observed difference was not influenced by patient’s age or gender.
Discussion
The results from this study confirm previous findings that reminder letters within a week before the appointment can improve attendance rates in community mental health clinics. Our results are similar to those of the Cochrane systematic review, which has suggested that a simple prompt in the days just before the appointment could indeed encourage attendance (8).
Although it has been reported elsewhere(8) that text based prompting increases the rate at which patients keep their initial appointments, our study did not show a similar result for new patients.
It is already demonstrated that new patients and follow-up patients in psychiatric clinics are distinct groups with different diagnostic profiles, degrees of mental illness and with different reasons for non-attendance. Follow-up patients are severely ill, socially impaired and isolated than new patients. (1). Forgetting the appointment and being too unwell are the most common reasons given for non-attendance by follow-up patients, while being unhappy with the referral, clinical error and being too unwell are the most common reasons in the new patient groups (1). In addition, it has also been observed that increased rate at which patients keep their first appointments is more likely related to factors other than simple prompting (4) This explains our finding that prompting was more beneficial for follow-up patients as opposed to new referrals to the Community Mental Health Team.
We also identified several patients with severe mental illness who ‘did not attend’ for three successive outpatient appointments. Their care plans were reviewed and arrangements made to follow up with their community psychiatric nurses as domiciliary visits at regular intervals. Such measures should reduce duplication of the services and shorten the waiting times for psychiatric consultation, which are well-recognised factors associated with non-attendance (9).
Non-attendance is an index of severity of mental illness and a predictor of risk (1). In addition to reminder letters, telephone prompts are also known to improve attendance (4). Successful interventions to improve attendance may be labour intensive but they can be automated and, ultimately, prove cost effective (8)
We noticed that there is limited research and lack of quality randomised controlled trials in the area of non-attendance and the effectiveness of intervention to improve attendance in mental health setting. More large, well-designed randomised studies are desirable. We also recommend periodic evaluation of outpatient non-attendance in order to identify high-risk individuals and implement suitable measures to keep such severely mentally ill patients engaged with the services.
There was no randomisation in this study and we relied on medical records. We have not directly compared the characteristics of non-attendees with those patients who did attend the clinics. We did not evaluate other clinical and socio-demographic factors (e.g. travelling distance, financial circumstances, etc) that are known to influence the attendance rates in mental health setting. Hence, there may be limitations in generalising the results beyond similar populations with similar models of service provision.
The advent of benzodiazepines in the late fifties was met with great excitement by the practicing physicians around the world. Their range of actions – sedative/hypnotic, anxiolytic, anticonvulsant and muscle relaxant – combined with low toxicity and alleged lack of dependence potential seemed to make them ideal medications for many common conditions. The drugs were prescribed long term, often for many years, for complaints such as anxiety, depression, insomnia and ordinary life stressors. They began to replace barbiturates; drugs known to be dangerous in overdose, which tended to cause addiction and were associated with troublesome side-effects. Previous compounds including opium, alcohol, chloral and bromides were similarly burdened.
The first benzodiazepine, chlordiazepoxide (Librium), was synthesized in 1955 by Leo Sternbach while working at Hoffmann–La Roche on the development of tranquilizers. The compound showed very strong sedative, anticonvulsant and muscle relaxant effects when submitted for a standard battery of animal tests. These impressive clinical findings led to its speedy introduction throughout the world in 1960 under the brand name Librium. Following chlordiazepoxide, diazepam was marketed by Hoffmann–La Roche under the brand name Valium in 1963.
The benefits of benzodiazepines and the apparent lack of discouraging factors led an alarming rise of benzodiazepine prescriptions. In the late 1970s benzodiazepines became the most commonly prescribed of all drugs in the world.1 In1980, Tyrer reported that each day about 40 billion doses of benzodiazepine drugs are consumed throughout the world.3 This figure is staggering by any standards. However, towards the end of the 1970s, awareness begin to grow that benzodiazepines were being unnecessarily over-prescribed and it was noticed that certain patients might become dependent on benzodiazepines after chronic use.4 In particular, patients found it difficult to stop taking benzodiazepines because of withdrawal reactions and many complained that they had become ‘addicted’. Several investigations showed quite unequivocally that benzodiazepines could produce pharmacological dependence in therapeutic dosage.5-9
In 1988, the Committee of Safety of Medicines reacted to the concerns by spelling out emphatic guidelines about the use of benzodiazepines drugs. For anxiety and insomnia, benzodiazepines are indicated for short term relief (two to four weeks) only if the condition is severe, disabling and subjecting the individual to extreme distress.10
Tolerance and dependence
Tolerance is a phenomenon that develops with many chronically used drugs. The body responds to the continued presence of the drug with a series of adjustments that tend to overcome the drug effects. In the case of benzodiazepines, compensatory changes occur in the GABA and benzodiazepine receptors which become less responsive, so that the inhibitory actions of the GABA and benzodiazepines are decreased. As a result, the original dose of the drug has progressively less effect and a higher dose is required to obtain the original effect.
Dependence is understood to be the inability to control intake of a substance to which one is addicted. It encompasses a range of features initially described in connection with alcohol abuse, now recognised as a syndrome (see box 1) associated with a range of substances.
Dependence has two components: psychological dependence, which is the subjective feeling of loss of control, cravings and preoccupation with obtaining the substance; and physiological dependence, which is the physical consequences of withdrawal and is specific to each drug. For some drugs (e.g. alcohol) both psychological and physiological dependence occur; for others (e.g. LSD) there are no marked features of physiological dependence.
Box 1: Dependence Syndrome*
Three or more of the following manifestations should have occurred together for at least one month or if persisting for periods of less than one month then they have occurred together repeatedly within a twelve month period.
A strong desire or sense of compulsion to take the substance.
Impaired capacity to control substance-taking behaviour in terms of onset, termination or level of use, as evidenced by: the substance being often taken in larger amounts or over a longer period than intended, or any unsuccessful effort or persistent desire to cut down or control substance use.
A physiological withdrawal state (see F1x.3 and F1x.4) when substance use is reduced or ceased, as evidenced by the characteristic withdrawal syndrome for the substance, or use of the same (or closely related) substance with the intention of relieving or avoiding withdrawal symptoms.
Evidence of tolerance to the effects of the substance, such that there is a need for markedly increased amounts of the substance to achieve intoxication or desired effect, or that there is a markedly diminished effect with continued use of the same amount of the substance.
Preoccupation with substance use, as manifested by: important alternative pleasures or interests being given up or reduced because of substance use; or a great deal of time being spent in activities necessary to obtain the substance, take the substance, or recover from its effects.
Persisting with substance use despite clear evidence of harmful consequences, as evidenced by continued use when the person was actually aware of, or could be expected to have been aware of the nature and extent of harm.
* ICD 10 Classification of Mental and Behaviour disorder, online version 2007.
Withdrawal syndrome and discontinuation syndrome
Any drug consumed regularly and heavily can be associated with withdrawal phenomenon on stopping. Clinically significant withdrawal phenomena occur in dependence to alcohol, benzodiazepines, opiates and are occasionally seen in cannabis, cocaine and amphetamine use. In general, drugs with a short half-life will give rise to more rapid but more transient withdrawal.
Discontinuation syndrome is a common phenomenon and occurs with all classes of antidepressants. It is only experienced when one tries to discontinue its use. The most common symptoms are dizziness, vertigo, gait instability, nausea, fatigue, headaches, anxiety and insomnia. Less commonly shock-like sensations, paraesthesia, visual disturbances, diarrhoea and flu-like symptoms have been reported. Symptoms usually begin 2-5 days after SSRI discontinuation or dose reduction. The duration is variable (one to several weeks) and ranges from mild to moderate intensity in most patients, to extremely distressing in a small number. Tapering antidepressants at the end of treatment, rather than abrupt stoppage, is recommended as standard practice by several authorities and treatment guidelines11-13.
The terms ‘antidepressant withdrawal syndrome’ and ‘antidepressant discontinuation syndrome’ are used interchangeably in the literature. ‘Discontinuation’ is preferred as it does not imply that antidepressants are addictive or cause a dependence syndrome. The occurrence of withdrawal symptoms does not in itself indicate that a drug causes dependence as defined in ICD 10 (World Health Organisation 1992)14 and DSM –IV (American Psychiatric Association, 1994)15.
Understanding how benzodiazepines work and their effects
For the first 15 years after the introduction of benzodiazepines, no clear picture emerged as to how these drugs might exert their psychotropic effects. The great breakthrough in our understanding in the mechanism of action of benzodiazepines came in the mid 1970s when biologists at Hoffman-La Roche demonstrated that benzodiazepines exert their psychotropic effects by potentiating GABA neurotransmission.16
GABA, Gamma-Amino butyric acid, is the most important inhibitory neurotransmitter in the mammalian brain representing about 30% of all synapses in the whole brain. GABAergic neurones mediate pre-synaptic inhibition by depressing the release of neurotransmitter at excitatory input synapse, and post-synaptic inhibition by depressing synaptic excitation of the principal neuron. When benzodiazepines react at their receptor site, which is actually situated on the GABA receptor, the combination acts as a booster to the actions of GABA making the neuron more resistant to excitation. Several studies showed that benzodiazepines were able to facilitate both types of inhibition, indicating that the effects of the benzodiazepines were in fact due to an interaction with the GABAergic transmission process17-19.
Various subtypes of benzodiazepine receptors have slightly different actions. Alpha 1 is responsible for sedative effects. Alpha 2 exerts anxiolytics effects. Alpha 1, Alpha 2 and Alpha 5 are responsible for anticonvulsant effects. As a consequence of the enhancement of GABA’s inhibitory activity caused by benzodiazepines, the brain’s output of excitatory neurotransmitters including norepinephrine, serotonin, dopamine and acetylcholine is reduced.
The studies on the receptor binding of benzodiazepines and the subsequent changes that occur in the central nervous system have provided us with an adequate explanation for some or all of the actions of benzodiazepines, which are listed in Box 2.
Box 2: Four principle biological properties of benzodiazepines
Anxiolytic and behavioural inhibition – The anxiolytic effect is seen in animals as an increase of those behavioural responses that are suppressed experimentally by punishment or which are absent because of innate aversion20-23.
Anticonvulsant – Benzodiazepines are most potent against chemically induced epileptiform activities. At higher doses most, but not all, benzodiazepines also prevent seizures induced by electric shock24.
Sedative/hypnotic – These effects of benzodiazepines are most easily observed as a decrease of spontaneous locomotor activity in rodents placed in an observation chamber. Benzodiazepines will shorten sleep latency (amount of time taken to fall asleep after the lights have been switched off) which can be demonstrated by electroencephalogram25.
Muscle relaxant - Common tests on rodents show that benzodiazepines impair performance at motor performance tasks for example the rodent’s ability to balance on a rotating drum. The cat shows marked ataxia at after relatively low doses25.
What are benzodiazepines used for?
Sleep disorders
The benzodiazepines are used widely in the treatment of sleep disorders and many have been developed and licensed for this purpose. They are mainly known as hypnotic drugs (sleeping pills) because insomnia is the main target use. Certain factors are important in determining the choice of the hypnotic drug. Ideally, the hypnotic should be effective at inducing sleep in the individual, and should enhance objective and subjective elements of sleep. It should have a fast onset with minimal side effects and the absence of withdrawal symptoms.
The early benzodiazepine hypnotics were drugs such as nitrazepam and flurazepam. After their introduction, it was found that they had half-lives of more than a day, and individuals suffered undesirable effects such as sedation, ataxia or amnesia during the day. This was problematic especially for those individuals who needed to drive or operate machinery. Another consequence was of falls with subsequent hip fractures in the elderly population because, due to slower metabolism, they accumulated raised plasma levels of the drug. For these reasons, benzodiazepines with shorter half lives were developed so that plasma levels fall below the functional threshold concentration by the next morning.
The first of the shorter half-life benzodiazepine hypnotics to be introduced were temazepam and triazolam. Temazepam has a half-life of 5 hours and is commonly used in primary, secondary and tertiary settings for insomnia. A possible drawback of very short half-life hypnotics is rebound insomnia. This is a state of worsening sleep which commonly follows discontinuation of a regularly used hypnotic.
An important point to note is that although the subjective efficacies of benzodiazepines are widely reported, the use of polysomnography (a sleep study that involves recording a variety of physiological measures including electroencephalograph, electro-oculogram and electromyogram) has shown that sleep architecture in individuals with insomnia is not normalised by benzodiazepines. The increase in sleep duration can be accounted for by an increase in the time spent in stage 2 of sleep, while the amount of time spent in slow-wave sleep (deep) and REM (rapid eye movement) is actually decreased26.
Anxiety disorders
It can be argued that the benzodiazepines are probably the most efficacious and best tolerated pharmacological treatments of anxiety. Numerous studies, many of them conducted under stringent double-blind conditions, have consistently shown that benzodiazepines produce significantly more improvement than placebo in both somatic and emotional manifestations of anxiety27-29.
Before the introduction of benzodiazepines, anxiety disorders were treated either with the barbiturates or related drugs such as meprobomate and glutethimide. These agents were highly likely to be abused and led to a great deal of dependence. Moreover, they were toxic in overdose and fatalities were high in populations using them. The improved efficacy and safety profile of benzodiazepines, aided by intense campaigns to restrict use of barbiturate-type drugs, meant they rapidly became the first choice drugs for anxiety within a few years of them being introduced.
Much clinical practice and opinion suggests that benzodiazepine can be used as first-line treatment for acute anxiety episodes as long as CSM guidelines are adhered to. For more intractable conditions such as established social phobia, generalised anxiety disorder and panic disorder, they should probably be reserved for adjunctive or second-line agents.
In contrast to the treatment of sleep disorders, it is important to achieve a constant level of receptor occupation to maintain anxiolysis throughout the day. So for anxiety, compounds with longer elimination half-lives are preferred, whereas for sleep induction, short half-life drugs are favoured. The principal benzodiazepines used as anxiolytics include diazepam, chlordiazepoxide, clonazepam, lorazepam, alprazolam and oxazepam.
The use of benzodiazepines as first-line agents for anxiety has been on the decline since the 1990s. There are changing cultural and medical attitudes to the prescription of drugs for the treatment of anxiety disorders as a result of growing evidence that psychological approaches are also effective. The risks of dependence and withdrawal difficulties are problematic in a significant number of patients. Another issue is the abuse of benzodiazepines by drug addicts and diversion of legitimate supplies on to the black market. There is competition from other agents (buspirone, tricyclic antidepressants, monoamine oxidase inhibitors and selective serotonin reuptake inhibitors) which have a different side-effect profile and are free from dependence/withdrawal problems.
Seizure Disorders
The anti-convulsant effects of benzodiazepines find their greatest clinical use in the acute control of seizures. Diazepam, clonazepam and lorazepam have all been used in the treatment of status epilepticus.
Status epilepticus is a life-threatening condition in which the brain is in a state of continuous seizure activity which can result in impaired respiration, hypoxic brain damage and brain scarring. It is a medical emergency that requires quick and effective intervention.
Diazepam was reported to be effective for the treatment of status-epilepticus in the mid-1960s 30-32 and is still widely considered to be the drug of choice for the initial control of seizures. Given intravenously, diazepam has a rapid onset of clinical activity achieving cessation of the seizure within 5 minutes of injection in 80% of the patients in one studyWhere facilities for resuscitation are not immediately available; diazepam can be administered as a rectal solution.
Although intravenous diazepam is effective for status epilepticus, it is associated with a high risk of thrombophlebitis which is why BNF suggests use of intravenous lorazepam. Lorazepam is also highly activeIts onset of action is rapid but because of its slower rate of tissue distribution, its anticonvulsant activity is prolonged compared to diazepam35,36.
Gestaut et al (1971) showed that clonazepam was an even more potent anti-convulsant than diazepam in the treatment of status epilepticusIt can be administered via the buccal mucosa (an advantage in children) and can also be given as a suppository.
Benzodiazepines are undoubtedly potent anti-convulsants on acute administration but their use in long-term treatment of epilepsy is limited by the development of tolerance to the anti-convulsant effects and by side-effects such as sedation and psychomotor slowing,39They are usually considered as an adjunct to standard drugs where these have failed to give acceptable control.
Table 1: Pharmacokinetic profile of common benzodiazepines and their licensed indications
Long-acting
TMax (hrs)
T1/2 (hrs)
Licensed indications11
Chlordiazepoxide42
2
7-14
Short-term use in anxiety, adjunct to acute alcohol withdrawal
Diazepam42
0.5-2
32-47
Short term use in anxiety, adjunct to acute alcohol withdrawal, insomnia, status epilepticus, muscle spasm, peri-operative use.
Clonazepam43
2.5
23.5
all forms of epilepsy, myoclonus, status epilepticus
Intermediate-acting
Temazepam42
1
5-8
Insomnia; peri-operative use.
Nitrazepam, Flurazepam*42
1-3
16-48
Short-term use for insomnia
Loprazolam, Lormetazepam42
1-3
8-10
Short-term use for insomnia
Short-actingα
Lorazepam42
1-1.5
10-20
Short term use in anxiety or insomnia; status epilepticus; peri-operative use.
Oxazepam42
2.2-3
5-15
Short term use in anxiety
Midazolam43
0.6
2.4
Sedation with amnesia, sedation in intensive care, induction of anaesthesia.
Alprazolam42
1.2-1.7
10-12
Short term use in Anxiety
Tmax: time to peak plasma concentration
T1/2: half-life
*Nitrazepam and flurazepam have prolonged action and may give rise to residual effects on the following day. Temazepam, Loprazolam and Lormetazepam act for a shorter time and have little or no hangover effect. αShort-acting compounds preferred in hepatic impairment but carry a greater risk of withdrawal symptoms.
Other uses
Alcohol detoxification – Benzodiazepines have become the standard pharmacological treatment for alcohol withdrawal. In acute alcohol detoxification, long acting benzodiazepines, such as diazepam or chlordiazepoxide are more appropriate than shorter acting agents like lorazepam or temazepam. The two principal reasons for this are 1) former drugs provide stable plasma concentrations over several hours which is necessary to maintain control over central nervous system excitability, and 2) There is a higher risk of addiction with short-acting drugs in this patient population.
In alcohol dependent patients with hepatic impairment, oxazepam or lorazepam is more suitable as they are not eliminated by hepatic oxidation through the Cytochrome P450 system. Cytochrome p450 (CYPs) is a collective generic term use to describe a superfamily of membrane bound heme-thiolate proteins of critical importance in the oxidative and reductive metabolism of both endogenous and foreign compounds. CYPs are the major enzymes in drug metabolism accounting for 75% of the total metabolismMany of the CYPs in humans are found in the liver and the gastrointestinal tract. After the acute detoxification is over, many patients enter rehabilitation programmes aimed at maintaining abstinence in the community. There is no evidence that use of benzodiazepines is useful in reducing alcohol craving or facilitating abstinence.
Anaesthesia – The psychotropic effects of benzodiazepines make them appropriate for use as anaesthetic agents or as adjuncts to anaesthesia. Muscle relaxation, sedation and retrograde amnesia are sought after properties in anaesthetic agents. Midazolam is used as a sedative agent in patients undergoing minor invasive practices considered as traumatic, such as dental treatment or endoscopy.41
Muscle relaxants – The muscle relaxant properties of benzodiazepines are an indication for their use in some neurological disturbances for symptomatic relief of muscle spasms and spasticity.
Assessment and management of patients with chronic benzodiazepine dependence
Because of the adverse effects, lack of efficacy and socioeconomic costs of continued benzodiazepine use, long-term users have for many years been advised to withdraw if possible or at least to reduce dosage.10,44 Echoing the CSM advice, the Mental Health National Service Framework (NSF), which was published in 1999, recommended that benzodiazepines should be used for no more than two to four weeks for severe and disabling anxiety. The Mental Health NSF called upon health authorities to implement systems for monitoring and reviewing prescribing of benzodiazepines within local clinical audit programmes. Primary Care Trusts (PCTs) should ensure that this recommendation is still being implemented45.
In primary care, early detection and intervention are the main principles of assessment. The initial assessment should
· Establish the pattern of benzodiazepine usage: onset, duration, which benzodiazepine/s, dosage history, current regime and any periods of abstinence.
· Check for evidence of benzodiazepine dependence (see box 3).
· If benzodiazepine dependence is present, determine the type of benzodiazepine.
· Detail any history of previous severe withdrawal (including history of seizures).
· Establish the level of motivation to change.
Dependence on benzodiazepines often indicates psychosocial problems in a person. Benzodiazepines are increasingly used in conjunction with other substance of abuse to enhance the effects obtained from opiates, and to alleviate withdrawal symptoms of other drugs of abuse such as cocaine, amphetamines or alcohol. The patient needs to have an individualised and a comprehensive assessment of their physical and mental health needs and any co-morbid use of other drugs and alcohol. Stable psychological health and personal circumstances are desirable features for successful withdrawal from benzodiazepines. Certain patients will be unsuitable for withdrawal, e.g. those patients experiencing a current crisis or having an illness for which the drug is required at the current time. Referral to specialist teams may be appropriate for some, e.g. if the patient is also dependent on other drugs or alcohol, if there is co-existing physical or psychiatric morbidity or if there is a history of drug withdrawal seizures. In some circumstances, it may be more appropriate to wait until other problems are resolved or improved.
This list is probably not inclusive. Not all patients get all the symptoms. Different individuals get a different combination of symptoms.
Management of benzodiazepine withdrawal
Withdrawal of the benzodiazepine drug can be managed in primary care if the patients in consideration are willing, committed and compliant. Clinicians should seek opportunities to explore the possibilities of benzodiazepine withdrawal with patients on long-term prescriptions. Interested patients could benefit from a separate appointment to discuss the risks and benefits of short and long term benzodiazepine treatment47. Information about benzodiazepines and withdrawal schedules could be offered in printed form. One simple intervention that has been shown to be effective in reducing benzodiazepine use in long-term users is the sending of a GP letter to targeted patients. The letter discussed the problems associated with long-term benzodiazepine use and invited patients to try and reduce their use and eventually stopAdequate social support, being able to attend regular reviews and no previous history of complicated drug withdrawal is desirable for successful benzodiazepine withdrawal.
Switching to diazepam: This is recommended for some people commencing a withdrawal schedule. Diazepam is preferred because it possesses a long half-life, thus avoiding sharp fluctuations in plasma level. It is also available in variable strengths and formulations. This facilitates stepwise dose substitution from other benzodiazepines and allows for small incremental reductions in dosage. The National Health Service Clinical Knowledge Summaries recommend switching to diazepam for people using short acting benzodiazepines such as alprazolam and lorazepam, for preparations that do not allow for small reductions in dose (that is alprazolam, flurazepam, loprazolam and lormetazepam) and for some complex patients who may experience difficulty withdrawing directly from temazepam and nitrazepam due to a high degree of dependencySee table 2 for approximate dose conversions of benzodiazepines when switching to diazepam.
Gradual Dosage Reduction:It is generally recommended that the dosage should be tapered gradually in long-term benzodiazepine users such as a 5-10% reduction every 1-2 weeks1,49.Abrupt withdrawal, especially from high doses, can precipitate convulsions, acute psychotic or confusional states and panic reactions. As mentioned earlier, benzodiazepines’ enhancement of GABA’s inhibitory activity reduces the brain’s output of excitatory neurotransmitter such as norepinephrine, serotonin, dopamine and acetylcholine. The abrupt withdrawal of benzodiazepines may be accompanied by uncontrolled release of dopamine, serotonin and other neurotransmitters which are linked to hallucinatory experiences similar to those in psychotic disorders46.
The rate of withdrawal should be tailored to the patient's individual needs and should take into account such factors as lifestyle, personality, environmental stressors, reasons for taking benzodiazepines and the amount of support available. Various authors suggest optimal times of between 6-8 weeks to a few months for the duration of withdrawal, but some patients may take a year or more,50A personalised approach, empowering the patient by letting them guide their own reduction rate is likely to result in better outcomes.
Table 2: Approximate equivalent doses of benzodiazepines1
Benzodiazepine
Approximate equivalent dosage (mg)a
Alprazolam
0.5
Chlordiazepoxide
25
Clonazepam
0.5
Diazepam
10
Flunitrazepam
1
Flurazepam
15-30
Loprazolam
1
Lorazepam
1
Lormetazepam
1
Nitrazepam
10
Oxazepam
20
Temazepam
20
aClinical potency for hypnotic or anxiolytic effects may vary between individuals; equivalent doses are approximate.
Patients may develop numerous symptoms of anxiety despite careful dose reductions. Simple reassurance and encouragement should suffice in most cases however, in a minority who are experiencing significant distress, formal psychological support should be available. Cognitive therapy, behavioural approaches including relaxation techniques and breathing exercises for anxiety management as well as other therapies such as massage and yoga may alleviate difficulties during withdrawal. Psychoeducation around withdrawal symptoms should be offered and a referral to a support organisation or group is helpful.
Although prescriptions of benzodiazepines have declined substantially since 1988, there is an ongoing challenge within all sectors of the NHS to prevent benzodiazepine dependence. This can be achieved by adhering to official recommendations to limit prescriptions to 2-4 weeks, or for brief courses or occasional usage. All health authorities should have clinical audit programmes reviewing and monitoring prescribing rates for benzodiazepines. Through this, increased awareness of CSM guidelines amongst all health care professionals should aid in more appropriate prescriptions and subsequent monitoring that is required to prevent unnecessary prescriptions. Patients on long-term prescriptions should be offered the opportunity for controlled withdrawal and the relevant psychological and social support.
Urinary tract infection (UTI) is the second most common infectious complaint in geriatric clinics overall, and the most common outpatient complaint caused by bacteria.1 The diagnosis and treatment of UTI in the elderly is not the same as treating UTI in adults. In frail elderly patients with age-associated multiple severe underlying disorders and cognitive impairment, early recognition of bacteraemic UTI and prompt, appropriate treatment are critical in reducing the mortality.2Also, the extensive and inappropriate use of antimicrobial agents has invariably resulted in the development of antibiotic resistance which, in recent years, has become a major problem worldwide.3 The diagnosis and empirical treatment of UTI in the elderly is challenging and a sound knowledge of the prevalent epidemiology of bacteria and their resistance pattern is necessary for the same. However, there is not much information on the aetiology and resistance pattern of UTI in the elderly in India. This study was done to find out the present uropathogen profile causing UTI in our centre and their antibiotic resistance patterns.
Subjects and methods
This prospective study was done at our tertiary care centre from January to December 2008. The study included all patients who were admitted or visited the outpatient departments in the hospital with symptoms of UTI during the study period and had UTI confirmed by positive urine culture reports. Only one sample from each subject was considered. Subjects with clinical symptoms of UTI but no growth on culture were excluded from final analysis. Subjects who were treated with another antimicrobial within the previous 48 hours, or within 24 hours if only a single dose and in the presence of an appropriate positive culture and ileal loops or vesicoureteral reflux were also excluded from the study. Complete data regarding demography, sex preponderance, associated symptoms, pathogenic organisms causing UTI and their antibiotic resistance were collected.
Overall, 194 subjects were included in the study (male: 116, female: 78). The mean age of the study population was 73.54±7.19 years, ranging between the ages of 65 and 96. The distribution of patients according to gender across various age groups is given in table 1. A general trend of more male subject enrolment was seen across all the age groups.
Table 1. Age and gender distribution of complicated and uncomplicated urinary tract infection.
Age group
Male
Percent
Female
Percent
Total
Percent
65-74
66
56.9
48
61.5
114
58.8
75-84
40
34.5
24
30.8
64
33.0
85-94
10
8.6
5
6.4
15
7.7
≥95
0
0
1
1.3
1
.5
Total
116
100.0
78
100.0
194
100.0
Isolation and identification of uropathogens
A clean catch midstream specimen, or suprapubic aspirate in subjects who were unable to give the former, was collected in a sterile, wide-mouth, leak-proof container to hold approximately 50ml from these subjects. Using a calibrated loop method of loop diameter 4 mm, 10 µL of the uncentrifuged specimen was transferred onto the agar plate and streak, using the modified Mayo’s technique without flaming the loop for isolation, and incubated at 35- 370C for 24 hours. A specimen was considered positive for UTI if a single organism was cultured at a concentration of >105 Colony Forming Units/ml. The Gram-positive and Gram-negative organisms culture isolates were further identified by using various biochemical reactions up to genus/species level wherever applicable.
Antibiotic sensitivity testing
In the presence of any potential growth, antibiotic sensitivity testing was done by the Modified Kirby-Bauer disc diffusion method according to the Clinical and Laboratory Standards Institute (CLSI) guidelines.4 The antibiotics tested were Imepenem, Meropenem, Ciprofloxacin, Ofloxacin, Norfloxacin, Amikacin, Gentamicin, Nitrofurantoin and Cotrimoxazole (Pathoteq Labs, India).
Extended Spectrum Beta-Lactamase (ESBL) detection
The screening for ESBL was done using Cefpodoxime (<17mm), Ceftazidime (<22mm), Aztreonam (<27mm), Cefotaxime (<27mm) and Ceftriaxone (<25mm). If the organisms showed the zone of inhibition lower than the minimum for any antibiotic disc, ESBL positivity was suspected. The phenotypic confirmation was done by testing the strain against Ceftazidime (Ca) and Ceftazidime/Clavulanic Acid. A > 5mm diameter of the zone of inhibition for Ceftazidime/Clavulanic Acid in comparison to Ceftazidime was considered indicative of ESBL production. Escherichia coli (E. coli) ATCC 25922 was used as ESBL negative and Klebsiella pneumoniae (K. pneumoniae) 700603 was used as ESBL positive reference strain.4
Statistical analysis
Descriptive statistics (totals, means, percentages, and standard deviations) were conducted using the statistical software package - SPSS Version 16.0 (SPSS Inc., Chicago, USA). Age, gender, organisms causing UTI, their antibiotic sensitivity and resistance, symptomatology of these subjects, and risk factors for UTI were included in the analysis and the results presented in tables and figures.
Results
Fever (57/194 - 29.4%) and dysuria (52/194 - 26.8%) were common symptoms of most UTI patients (Fig. 1). Diabetes mellitus (DM) and recent uro-genital instrumentation were the most common risk factors associated with UTI in the present study (Table 2). The organism profile and their antibiotic resistance profile were similar in patients with or without DM.
Figure 1. Various symptomatologies seen in patients with urinary tract infection during the initial presentation
Table 2. Frequency of various risk factors in subjects with urinary tract infection.
Risk Factor
Frequency
Percent
Catheterization
29
14.9
Diabetes Mellitus
97
50.0
Immunosuppression
2
1.0
Recent history of uro-genital Instrumentation
43
22.2
Recurrent urinary tract infection
14
7.2
Renal stones
5
2.6
E. coli (138/194 - 71.1%) was the most commonly isolated pathogen responsible for UTI in the present study (Figure 2). 56.2% of the total infection was caused by ESBL positive organisms. The antimicrobial potency and spectrum for nine selected antimicrobial agents (Imepenem, Meropenem, Ciprofloxacin, Norfloxacin, Ofloxacin, Gentamicin, Amikacin, Nitrofurantoin and Cotrimoxazole) against the uropathogens were studied. The highest and least antibiotic resistance was noted against fluoroquinolones (79.9%) and carbapenems (3.61%) respectively (Fig. 3).
Figure 2.Frequency and distribution pattern of urinary tract infection pathogens and percentage Extended Spectrum Beta-Lactamase (ESBL) production.
Figure 3. Resistance pattern to various antibiotics of the uropathogens
Discussion
While increased frequency and dysuria are usual symptoms of UTI, uncertainty looms around the same as these symptoms can be masked by catheterisation, or be common and chronic in the elderly even in the absence of UTI.5-10Fever was the most common symptom of UTI in the present study as with similar studies worldwide.11-13 Studies have found that the elderly do not lack a febrile response; that an elevated temperature was the most common initial symptom, a marker for a serious infection, and the most important clinical indicator for antibiotic treatment.14-16 Whitelaw et al17 reported that a delay in interpreting fever as a symptom of UTI led to a high mortality rate in the elderly within 24 hours of admission.
Diabetes isconsidered as an important risk factor for UTI with manyauthors having defined UTI in patients with DM as complicated when the UTI is symptomatic.18-19 However, the authors did not find that DM influenced the organism profile and their antibiotic resistance in the present study. Bonadio et al20 studied the influence of DM on the spectrum of uropathogens and antimicrobial resistance in elderly adult patients with asymptomatic UTI (mostly hospital-acquired). They found that DM per se did not seem to influence the isolation rate of different uropathogens and their susceptibility patterns to antimicrobials. These findings indicate that, although DM is a known immunomodulator, the role played by the same in altering the antibiotic resistance is minimal compared to recent invasive procedures.
Although the uropathogen profile of the present study resembles similar studies worldwide, the antibiotic resistance of these organisms was unusually high.2, 21 Cotrimoxazole is the recommended drug for treating UTI. However, more than one third of the study subjects were resistant to the first-line drug. 79.9% of the uropathogens were resistant to fluoroquinolones, which are considered as the second-line drug. As prior fluoroquinolone use is a known risk factor for fluoroquinolone-resistantE. coli infection, it is plausible that frequent fluoroquinolone prescriptions may be contributing to the observed resistance.22-23 Aypak et al 24 found that treatment durations were statistically longer than the recommended three-day course when patients were empirically treated with fluoroquinolones due to increased resistance rates, and suggested to discourage the empirical use of fluoroquinolones in UTI.
The most troublesome finding of the present study is that ESBL-positive organisms accounted for 56.2% of the total infection. Not much information on ESBL-producing organisms causing UTI is available from India and most of these reports are from the younger population. The prevalence of ESBL-positive UTI in these studies varied between 26.6% and 48.3%.25-26 To the best of our knowledge, this is the highest ever reported prevalence of ESBL-positive UTI in the elderly worldwide. ESBL-producing organisms are frequently resistant to many of the antimicrobial agents usually recommended for the treatment. As lesser new antibiotics are available for their management, we need to be concerned of this issue in years to come especially in tertiary care centres. A unified antibiotic protocol is necessary to limit the morbidity and mortality associated with inappropriate and under-treatment of UTI.
The limitations of the present study were that altered mental status was not considered as one of the clinical manifestations of UTI in the elderly, which could have mitigated the total number of study subjects included in the study. In addition, the phenotypic confirmation of ESBL-positive organisms was done using only Ceftazidime/Clavulanic Acid and not Cefotaxime/Clavulanic Acid as per the latest CLSI guidelines. As a result, there may be under-reporting of the incidence of ESBL organisms in the present study.
In conclusion, we report a significantly high resistance to common antibiotics among the uropathogens in the present study. Furthermore, the very high rate of ESBL-positive UTI is of concern, and monitoring for the same is necessary to prevent treatment failure and increased morbidity and mortality with UTI.
Eating disorders are defined as those disorders in which there is excessive concern with the control of body weight and shape, accompanied by grossly inadequate, irregular or chaotic food intake. It is widely accepted that eating disorders occur in young adults and adolescents, however, a number of reports have described series of young patients with eating disorders aged from eight years upwards.1,2The range of disorders in children includes selective eating, food avoidance emotional disorder, functional dysphagia and pervasive refusal syndrome.
ANOREXIA NERVOSA.
The DSM IV diagnostic criteria for anorexia nervosa are as follows:
Refusal to maintain body weight at or above a minimally normal weight for age and height (e.g weight loss leading to maintenance of body weight less than 85% of expected; or failure to make weight gain during growth period).
Intense fear of gaining weight or becoming fat, even though underweight.
Disturbance in the way one’s body weight and shape is experienced, undue influence of body weight or shape on self evaluation, or denial of the seriousness of current low body weight.
Absence of at least three consecutive menstrual cycles
Subtypes:
Restricting Type: During the current episode of anorexia nervosa, the person has not regularly indulged in binge eating or purging behaviour.
Binge-Eating/Purging Type: During the current episode of anorexia nervosa, the person has regularly indulged in binge eating or purging behaviour.3
The above criteria are intended primarily for use with older patients and do not adequately address the problems of anorexia nervosa in children. For example, criterion D in DSM IV applies only to post-menarcheal females and states that there should be an “absence of at least three consecutive menstrual cycles”. This is clearly inapplicable in this age group, where the majority are premenarcheal. Equally unhelpful is the statement that weight should be maintained at less than 85% of that expected, for expected weight can only be calculated on the basis of height and age. Yet growth may also be impaired because of poor nutrition, so further adjustments have to be made. For these reasons, the Eating Disorders Team at Great Ormond Street Hospital for Sick Children in London, U.K, developed a more practical diagnostic criterion for early onset anorexia nervosa.4The current criteria is as follows:
Great Ormond Street diagnostic criteria for early-onset Anorexia Nervosa:
Determined weight loss (e.g. food avoidance, self-induced vomiting, excessive exercising and abuse of laxatives).
Weight loss: Since children should be growing, static weight may be regarded as equivalent to weight loss in adults. Weight loss is a real cause for concern in children, since they have lower total body-fat deposits and therefore do not have much fat to lose. One measurement for weight loss uses the Tanner-Whitehouse Standards6 where 100% represents the desired weight for a child’s sex, age and height, and 80% or less is classed as ‘wasting’.
Food avoidance: Children with anorexia nervosa give a variety of reasons for refusing food, the most common of which appears to be a fear of becoming obese. Other reasons include feelings of nausea or fullness, abdominal pain, appetite loss and difficulty swallowing. 7
Self-induced vomiting: Fosson et al (1987) reported that at least 40% of the 48 children included in their study of early-onset anorexia nervosa were known to be vomiting at presentation.
Excessive exercising: This is not uncommon in children with anorexia nervosa. Daily exercise workouts may be a feature in these children’s lives. Sometimes exercise may be carried out in secret in the privacy of the bedroom or bathroom.
Laxative abuse: This is not as common as in adult populations partly because children have less access or opportunity to obtain laxatives, but nevertheless, it still occurs.
Abnormal cognitions regarding weight and/or shape: The main beliefs are centred around body image and its distortion, although it must be acknowledged that body image is difficult to assess reliably. Many children with anorexia nervosa will report that they consider themselves fat even when severely underweight, which is similar to the clinical observation seen in adult patients with the same condition.
Preoccupation with weight: Children with anorexia nervosa tend to be preoccupied by their own body weight and are often experts at calorie counting. This preoccupation is closely related to fear of fatness.
Physical Aspects
The majority of physical changes in anorexia nervosa are predominantly related to the effects of starvation and dehydration. This includes slow pulse rate, low blood pressure and poor circulation leading to cold hands and feet. Often there is excess fine hair especially on the back, known as ‘lanugo’. Teeth may be pitted, eroded and decayed from gastric acid during vomiting.
A wide range of biochemical changes have been described in anorexia nervosa, although there is little information specifically relating to children. These include low haemoglobin and white cell count, low levels of potassium and chloride, raised liver enzymes such as alanine transaminase and alkaline phosphatase, and low levels of plasma zinc and serum iron.
A number of endocrine changes appear in anorexia nervosa and evidence suggests that this is due to the secondary effects of starvation. Changes include increased cortisol, growth hormone and cholecystokinin, and decreased luteinizing hormone, follicle stimulating hormone, oestrogen, triodothyronine and thyroid stimulating hormone.
BULIMIA NERVOSA
The DSM IV diagnostic criteria for bulimia nervosa is as follows 8 :
Recurrent episodes of binge eating e.g, eating large amounts of food in two hours, and a sense of lack of control during the episode.
Regular use of methods of weight control:
vomiting
laxatives
diuretics
fasting or strict diet
vigorous exercise.
Minimum average of two binges a week in three months.
Self-evaluation is influenced by body weight or shape.
The disturbance does not occur exclusively during episodes of anorexia nervosa.
Sub-types:
Purging Type: During the current episode of bulimia nervosa, the person regularly engages in self-induced vomiting or laxative misuse, diuretics or enemas.
Non-purging Type: During the current episode of bulimia nervosa, the person has used other inappropriate compensating behaviours such as fasting or excessive exercise, but not regularly used purging behaviour. 2
Self-induced vomiting can lead to complications such as fluid and electrolyte disturbance and gastro-intestinal bleeding. Other physical complications include dental erosions, enlargement of the salivary glands, and muscle weakness.
OTHER EATING DISORDERS IN CHILDREN
Food Avoidance Emotional Disorder
This term was first introduced by Higgs et al (1989)9, to describe a group of underweight children presenting with inadequate food intake and emotional disturbance who did not meet the criteria for anorexia nervosa.
The operational definition we use has evolved from Higgs and colleagues original description together with clinical experience and is as follows:
Food avoidance not accounted for by primary affective disorder.
Weight loss.
Mood disturbance not meeting criteria for primary affective disorder.
No abnormal cognitions regarding weight or shape.
No morbid preoccupation regarding weight or shape.
No organic brain disease or psychosis.
Selective Eating
Selective eaters are a group of children who present with very restricted eating habits in terms of the range of foods they will accept. Characteristics include:
Have eaten a narrow range of foods for at least 2 years.
Unwillingness to try new foods.
No abnormal cognitions regarding weight or shape.
No fear of choking or vomiting.
Weight may be low, normal or high.
Pervasive Refusal Syndrome
This term was first described by Lask et al (1991).10 The main features are:
Profound refusal to eat, drink, walk, talk or self-care.
Determined resistance to efforts to help.
Initially these children present with features fairly typical of anorexia nervosa, but the food avoidance is gradually followed by a more generalised avoidance with a marked fear response.
Functional Dysphagia
Children with this condition generally present with complaints of difficulty or pain on swallowing. Features include:
Food avoidance.
Fear of swallowing, choking or vomiting.
No abnormal cognitions regarding weight or shape.
No morbid preoccupation regarding weight or shape.
No organic brain disease or psychosis.
For more information on the above eating disorders in children see Lask & Bryant-Waugh (1999).5
INCIDENCE AND PREVALENCE
For a number of reasons, the incidence and prevalence of childhood-onset anorexia are not known. There have been no epidemiological studies which have focussed specifically on this age group and the strict diagnostic criteria used in wider epidemiological studies may lead to a substantial underestimate of the true incidence. 2 However studies in adolescent populations estimate the prevalence to be in the order of 0.1-0.2% 11, 12 and it is likely to be even lower in children. Although debatable, an increase in actual referral rate of anorexia nervosa in children has been reported.2 Gender distribution: Five to ten percent of cases of anorexia nervosa in the adolescent and young adult population occur in males.13 However, in children, studies have reported that between 19 and 30% of children with anorexia nervosa have been boys.7,9,14,15
At present, there is little epidemiological information on the other eating disorders in children.
MANAGEMENT AND INTERVENTIONS16
Initial assessment
Comprehensive assessment should include physical, psychological and social components. Those with low to moderate risk should be managed as an outpatient. Those who are severely emaciated, with serious risk of self harm, with severe deterioration or with poor response to treatment are deemed high risk and should be considered for inpatient treatment or urgent referral to specialist services.
Anorexia nervosa – outpatient care
Psychological interventions
Psychological interventions are the key element in the management of anorexia.
The delivery of psychological interventions should be accompanied by regular monitoring of a patient’s physical state including weight and specific indicators of increased medical risk.
• When delivering psychological treatment consider, in conjunction with the patient:
– Cognitive analytical therapy (CAT)
– Cognitive behaviour therapy (CBT)
– Interpersonal psychotherapy (IPT)
– Focal psychodynamic therapy
– Family interventions focused explicitly on eating disorders
• Focus of treatment should be on weight gain, healthy eating, and reducing other symptoms related to eating disorders.
• Dietary counselling should not be provided as the sole treatment for anorexia nervosa.
Medication
Pharmacological interventions have a very limited evidence base for the treatment of anorexia nervosa.
• Medication is not effective as sole or primary treatment; caution should be exercised in its use for comorbid conditions such as depression or obsessive–compulsive disorder, as these may resolve with weight gain alone
• Avoid using drugs that affect the heart such as antipsychotics, tricyclic antidepressants, some antibiotics and some antihistamines.
Anorexia nervosa – inpatient care
•Body Mass Index (BMI) is a measure of weight in relation to height. Normal BMI range is 18.5-24.9. BMI below 17 is a concern and GPs should consider referral to specialist services. However, BMI below 15 is serious and inpatient care should be considered.
• Consider inpatient treatment for patients with high or moderate physical risk, who have not improved with appropriate outpatient treatment or have significant risk of suicide or severe self-harm.
• Admit to setting that can provide the skilled implementation of refeeding with careful physical monitoring (particularly in the first few days of refeeding) and in combination with psychosocial interventions
• Consider increased risk of self-harm and suicide at times of transition for patients with anorexia nervosa, especially that of the binge–purging sub-type.
Psychological treatment
• Psychological treatment is a key element of an inpatient stay, but evidence for what kind of treatment or approach to treatment is effective, is limited.
• A structured symptom-focused treatment regimen with the expectation of weight gain should be provided, with careful monitoring of the physical status during refeeding.
• Provide psychological treatment with a focus on both eating behaviour and attitudes to weight and shape, and wider psychosocial issues with the expectation of weight gain
• Do not use rigid behaviour modification programmes.
Feeding against the will of the patient
• Feeding against the will of the patient should be an intervention of last resort in care and should only be done in the context of the Mental Health Act 1983 or Children Act 1989.
Post-hospitalisation treatment in adults
• Following discharge, extend the duration of psychological treatment over that normally provided to those who have not been hospitalised, typically for at least 12 months.
• Offer outpatient psychological treatment that focuses on both eating behaviour and attitudes to weight and shape, and on wider psychosocial issues, with regular monitoring of both physical and psychological risk.
Anorexia nervosa –physical management
Anorexia nervosa carries considerable risk of serious physical morbidity. Awareness of the risk, careful monitoring and, where appropriate, close liaison with an experienced physician, are important in the management of the physical complications of anorexia nervosa.
Managing weight gain
• Aim for an average weekly weight gain of 0.5–1 kg in inpatient settings and 0.5 kg in outpatient settings. This requires about 3500 to 7000 extra calories a week
• Provide regular physical monitoring and consider multivitamin/multimineral supplementation in oral form for both inpatients and outpatients.
• Total parenteral nutrition should not be used unless there is significant gastrointestinal dysfunction.
Managing risk
• Inform patients and their carers if the risk to their physical health is high
• Involve a physician or paediatrician with expertise in the treatment of medically at-risk patients for all individuals who are at risk medically.
• Consider more intensive prenatal care for pregnant women to ensure adequate prenatal nutrition and fetal development.
• Oestrogen administration should not be used to treat bone-density problems in children and adolescents as this may lead to premature fusion of the epiphyses.
• Healthcare professionals should advise people with eating disorders and osteoporosis or related bone disorders to refrain from physical activity that significantly increases the likelihood of falls.
Additional considerations for children and adolescents
The involvement of families and other carers is particularly important.
The right to confidentiality of children and adolescents with eating disorders should be respected.
Family members, including siblings, should normally be included in the treatment of children and adolescents with eating disorders. Interventions may include sharing of information, advice on behavioural management and facilitating communication.
Anorexia nervosa
• Family interventions that directly address the eating disorders should be offered to children and adolescents with anorexia nervosa.
• Offer children and adolescents individual appointments with a health professional separate from those with their family members or carers.
• For children and adolescents, once a healthy weight is reached, ensure increased energy and necessary nutrients are available in the diet to support growth and development.
• Involve carers of children and adolescents in any dietary education or meal planning.
Inpatient care of children and adolescents with anorexia nervosa
• Inpatient care of children and adolescents should be within age-appropriate facilities (with the potential for separate children and adolescent services), which have the capacity to provide appropriate educational and related activities. They should also balance the need for treatment and urgent weight restoration with the educational and social needs of the young person.
• Consider using the Mental Health Act 1983 or the right of those with parental responsibility to override the young person’s refusal to receive treatment that is deemed essential.
• Seek legal advice and consider proceedings under the Children Act 1989 if the patient and those with parental responsibility refuse treatment where treatment is deemed essential.
Bulimia nervosa
Following the initial assessment consider:
• As a possible first step, an evidence-based self-help programme – direct encouragement and support to patients undertaking such a programme may improve outcomes. This may be sufficient treatment for a limited subset of patients.
Psychological treatment should form the key element of treatment, so consider:
• For adolescents: Cognitive behavioural therapy for bulimia nervosa (CBT-BN) adapted as needed to suit their age, circumstances and level of development.
• Where there has been no response to CBT or it has been declined: other psychological treatments,particularly interpersonalpsychotherapy (IPT). (Note: patients should be informed that IPT takes 8–12 months to achieve results comparable with CBT-BN).
Medication may have a role
• Consider a trial of an antidepressant drug as an alternative or additional first step to using an evidence-based self-help programme.
• In terms of tolerability and reduction of symptoms, SSRIs (specifically fluoxetine) are the drug of first choice for the treatment of bulimia nervosa.
• The effective dose of fluoxetine may be higher than for depression.
• Beneficial effects will be rapidly apparent and are likely to reduce the frequency of binge eating and purging, but the long-term effects are unknown.
• No drugs, other than antidepressants, are recommended for the treatment of bulimia nervosa.
Physical management
• Assess fluid and electrolyte balance where vomiting is frequent or there is frequent use of laxatives.
• If electrolyte balance is disturbed, consider behavioural management as the first option
• If supplementation is required, use oral rather than intravenous preparations.
Bulimia nervosa – inpatient or day care
• Consider inpatient treatment for patients with risk of suicide or severe self-harm.
• Admit patients to a setting with experience of managing this disorder.
PROGNOSIS 17
If untreated, anorexia nervosa carries high mortality rates of
10-15%. If treated, one third have full recovery, one third partial recovery and one third have chronic problems. Poor prognostic factors for anorexia nervosa include: chronic illness, late age of onset, bulimic features such as vomiting and purging, anxiety when eating with others, excessive weight loss, poor childhood social adjustment, poor parental relationships and male sex.
Prognosis for Bulimia nervosa is generally good, unless there are significant issues of low self esteem or evidence of severe personality disorder.
The Western world is experiencing a rapid increase in the incidence of femoral neck fractures, from 50000 fractures in 1990 to a projected 120000 in 20151 as the age of the population increases. Hip fractures account for approximately 20 percent of orthopaedic bed occupancies in Britain at a total cost of up to £25000 per patient1.Around half of these fractures are intracapsular in nature of which two thirds are displaced.
The ideal surgical treatment for displaced intracapsular femoral neck fractures remains controversial with studies indicating a lack of consensus among treatment centres2,3. Options include reduction with internal fixation, cemented or cementless hemi-arthroplasty and total hip replacement. Internal fixation is less traumatic than arthroplasty but has a higher re-operation rate4,5 whilst cemented femoral prostheses are associated with a lower rate of revision compared to cementless implants. In addition there are statistically significant improvements in pain scores, walking ability, use of walking aids and activities of daily living within the cemented group6,7. The cementation process may however be associated with increased morbidity due to fat embolisation and increased length of operation8.
Treatment planning for intracapsular fractures, therefore, needs to take into account the patient’s medical fitness and activity level as well as the cost-effectiveness of the procedure.
Figure 1: Exeter Trauma Stem (ETS) Implant
The Exeter Trauma Stem is a new monoblock unipolar implant using an intermediate size 1.5, forty millimetre offset Exeter stem with a large head sized to match the patient’s anatomy (Figure 1, 2).
Figure 2: X-ray of ETS with correct length. Neck cut has been made 1cm above lesser trochanter with shoulder of prosthesis sunk below greater trochanter to ensure equal leg length
As yet there are no independent published series of the results of using this implant. Purported advantages of the ETS include the use of a tried and tested polished, tapered stainless steel stem with which many primary hip surgeons are familiar, ease of ‘cement-in-cement’ revision to a total hip replacement should the patient develop acetabular erosion and the relatively low cost of £240 compared to many contemporary cemented implants.
This study prospectively evaluates the first 50 ETS hemiarthroplasties performed at the Norfolk and Norwich University Hospital, UK over a six month period providing an indication of early outcomes and complications involved with the use of this prosthesis.
METHOD
Patients presenting to our unit with a displaced intracapsular femoral neck fracture who were sufficiently active to get out of their home independently, had an ASA grade of 1 or 2 and were not significantly cognitively impaired were treated with a cemented ETS prosthesis. In addition, patients with displaced intracapsular fractures associated with significant comminution of the medial femoral neck precluding the use of our standard calcar-bearing Austin Moore (Stryker Howmedica Osteonics Ltd) hemiarthroplasty were also treated with an ETS regardless of functional capability and medical condition.
The first fifty patients who underwent ETS hemiarthroplasty as a primary treatment for fractured neck of femur were included in the study. Four patients were excluded. Two of these patients had an ETS performed due to failure of cancellous screw fixation and two as part of a two stage revision for infected uncemented prosthesis.
All fifty procedures were performed with the patient in the lateral position via the modified lateral approach with the glutei incised at the musculotendinous junction. Cefuroxime was given on induction in each instance followed by two post operative doses at eight and sixteen hours after the procedure. Patients were scored by the hospital protocol for risk of thrombosis and were administered aspirin or subcutaneous low-molecular weight heparin as appropriate. All drains were removed between twenty-four and forty-eight hours and patients were mobilised within one day of operation as pain allowed.
Patient demographics and operative details were gathered both from the patients’ notes and from the ORSOS computerised theatre system.
Radiographic evaluation involved the Barrack9 cementation grading system, Dorr’s criteria10,11 including varus/valgus alignment of the prosthesis and leg length measurement.. Measurements of length and varus/valgus were performed using the PACS (GE Medical Systems 2005) digital imaging system by two orthopaedic registrars independent of one another.
Finally all fifty patients were sent an Oxford Hip Score12 at between two and four months postoperatively. Three patients died before the questionnaires were sent and of the remaining forty seven, there was a 98% response rate with 44 questionnaires completed solely by the patient and a further two completed with the aid of a carer.
RESULTS
1. Patient Demographics and operative details
Of the fifty patients in the study, thirty six were female and fourteen male. The mean age was 78 (range 38 to 99). Forty four ETS hemiarthroplasties were performed due to patient fitness and activity levels (Type 1 patients) with six undertaken in frail patients due to fracture extension into the calcar (Type 2). All type 1 patients were ASA grade 1 or 2 with all type 2 patients ASA grade 2-4. All type 1 patients had a mini-mental test score of 10/10 with type 2 patients ranging from 0-7.
The mean delay to surgery was 26 hours (9-58). Eight procedures were performed by consultants, thirty eight by registrars (training years three to six) and four by the trauma fellow under supervision by a senior. The mean operative time was sixty four minutes and the mean haemoglobin drop was 2.6 g/dl3 . Seven patients required post operative transfusion of either two or three units of packed cells.
Thirty four of the patients mobilised unaided pre-injury with eight using one stick, four using two sticks and four using a frame. Using the four categories above, the average drop in mobility from injury to discharge was 1.6 levels.
The average hospital stay was 8.6 days (range 5-69) with thirty five patients discharged to their own house, four to their own residential home and eleven to a rehabilitation ward.
2. Radiographic Evaluation
The cement mantle was firstly evaluated using Barrack’s grading:-
grade A: medullary canal completely filled w/ cement (white out). grade B: a slight radiolucency exists at the bone cement interface. grade C: a radiolucency of more than 50% at the bone cement interface. grade D: radiolucency involving more than 100% of the interface between bone and cement in any projection, including absence of cement distal to the stem tip
Post-operative radiographic evaluation according to this system showed that 54% of cement mantles were Barrack grade B (27 cases) with the majority of the remainder grade C (12 cases) and grade A (eight cases). Two were graded as D.
Dorr’s criteria were employed firstly to assess whether there was an adequate cement thickness of 3mm in Gruen zones 3 and 7 and of one centimetre distal to the tip of the prosthesis. Thirty-four prosthesis scored 3/3, nine scored two, four scored one and two scored none.
Dorr’s criteria also assess position of the prosthesis using the AP radiograph. Ten prostheses were placed in a neutral position related to the femoral shaft. Seven were placed in 1-2 degrees of varus, twenty-seven were placed in 1-2 degrees of valgus and five were placed in 3-6 degrees of valgus.
There were equal leg length measurements in nineteen patients post-operatively with two patients left 5-10mm short on the operated side. Twenty-eight patients were left long with a mean lengthening of 12mm (5-30) and of these five were left between 20 and 30mm long one of which was irreducible and needed to be revised on the table.
3. Post-operative Scoring
The Oxford Hip Score contains 6 questions relating to pain and six relating to function and mobility which are scored 1 point for the best outcome and five for the poorest (Score 12-60). The average pain score was 12.0 and the average functional score was 15.2 giving an overall score of 27.2. The type 1 patients fared better with an average score of 25.3, the average score for type 2 patients was 44.3
4. Complications
The one immediate complication was the need for an on-table revision due to an irreducible prosthesis.
There was one superficial wound infection requiring antibiotic therapy and one early deep infection requiring open washout in theatre which resolved the infection in combination with antibiotic therapy.
There were three deaths (one CVA, one MI and one from pneumonia) all of which occurred between 30-90 days from the operative procedure.
DISCUSSION
The cohort of patients included in this study was similar to other studies with regards to male:female ratio, age and cognitive function4,5. The patients also experienced a delay to surgery and length of operation similar to previous studies4,7. The length of inpatient stay, however, was markedly better at 8.6 days compared to approximately fourteen to twenty-one days cited in the literature13,14.
The length of operation, post-operative mobility and transfusion requirements were also similar to studies evaluating hemiarthroplasty outcomes4,5.
Post-operative radiographic evaluation showed greater than 50% of cement mantles were Barrack grade B with the majority of the remainder grade C (24%) and A (16%). There was no statistical difference between our findings and those of an 8-12 year study of the Exeter stem in total hip replacement15. The two Barrack D grade cement mantles were in patients who became unwell intra-operatively and the decision was taken not to pressurise during cementation.
Figure 3: Original ETS broach with squared off handle, not allowing intra-operative trialling
The major difficulty evident from this study is the correct positioning of the ETS prosthesis with regards to restoration of accurate leg length which the authors believe was due to two reasons. Firstly, the original set for the Exeter Trauma Stem comes with one femoral broach (Fig 3) which does not allow trial reduction. Therefore positioning of the prosthesis required intra-operative estimation of the correct leg length which can be difficult with hip fractures as the leg length is abnormal at the commencement of surgery. Therefore the centre of rotation of the femoral head on the injured side was approximated by comparison with the contralateral side on the pelvic AP radiograph and referenced against the level of the greater trochanter during the procedure.
Secondly, because the large monoblock head of the ETS is matched to the patient’s own femoral head anatomy, the diameter of the ETS head is generally around 15-30mm wider than the 28mm heads commonly used with the Exeter stem in elective hip arthroplasty. Therefore care must be taken to sink the stem by a corresponding amount if a similar neck cut is used or the femoral neck osteotomy should be made at a more distal level. This often involves positioning the shoulder of the ETS stem below the level of the greater trochanter. This can mislead surgeons who are familiar with the Exeter stem as placing the ETS stem in a similar position to that employed with smaller head elective arthroplasty results in limb lengthening. Figure 4 shows a leg length discrepancy of 15mm despite a low neck cut as the stem has not been sunk sufficiently. This led to 56% of patients being left with true lengthening of the operated limb and one prosthesis irreducible. It is difficult to assess whether this is a common problem in the literature with other hemiarthroplasties used for femoral neck fractures as none of the comparable studies comment on clinical or radiographic assessment of leg length.
Figure 4: X-ray of ETS with limb lengthening. Although the neck cut has been made relatively low in relation to the lesser trochanter, the shoulder of the prosthesis slopes marginally above the greater trochanter, inadvertently lengthening the operated limb.
One major advantage to the tapered Exeter stem is the ease with which conversion to a total hip replacement can be performed using an in-cement technique16. Many of the patients included in this study were below the age of 70 and a proportion could be expected to outlive the prosthesis especially with regards to acetabular erosion4. Whilst none of this cohort has required revision for loosening, the irreducible Exeter implant was revised on-table using this technique without further complication.
Post operative Oxford Hip Scores were encouraging with no difference between our mean score of 27.2 and other studies evaluating both cemented hemiarthroplasty and total hip replacement following femoral neck fracture12,17,18.
The mortality rate was 6% six to twelve months post surgery with all three deaths more than one month post surgery and apparently unrelated to the surgery itself. Overall mortality rates following neck of femur fracture are approximately thirty percent at one year however studies specifically looking at outcomes following cemented hemiarthroplasty in the fit and active patient have found mortality rates similar to this study5,19.
Costing around £240, the ETS is a relatively cheap prosthesis in comparison to cemented bipolar prosthesis depite the additional expense of a cement restrictor, bone cement, cement gun and cement pressurisers.
In conclusion, the Exeter Trauma Stem (ETS) is an effective method of treating displaced intracapsular neck of femur fractures with encouraging post-operative functional, pain and radiographic scoring outcomes. The message highlighted by this study is that additional care is needed with regards to the correct positioning of the prosthesis to ensure the restoration of limb length. Subsequent to discussion with the Stryker representative regarding the results of this study, a second generation trialling system has been added to the set with a modular broach. The authors suggest that not only should these modular broaches be used, but also accurate pre-operative planning is needed to ensure equal leg lengths post-operatively.
Definition of restraint: a device or medication that is used to restrict a patient’s voluntary movement. Prevalence of physical restraints: up to 17% in acute care settings. Prevalence of chemical restraints: up to 34% psychotropic drug use in long term care facilities. Complications of restraints: include documented falls, decubitus ulcers, fractures, and death. Regulations: require documentation of indications plus failure of alternatives by a licensed professional. Prevention of removal of life sustaining treatment: is a relatively clear indication for restraints. Informed consent: including consideration of risks, benefits, and alternatives is necessary in all cases. Barrier to reducing restraints: a misguided belief that, by use, one is preventing patient injury. Steps can be taken to limit their use: including an analysis of behaviours precipitating their use.
Case study
A 79 year old female nursing home resident with frontotemporal dementia and spinal stenosis has a chronic indwelling catheter for cauda equina syndrome and neurogenic bladder. Attempts to remove the catheter and begin straight catheterization every shift were met by the patient becoming combative with the staff. Replacing the catheter led to repeated episodes of the patient pulling out the catheter. The patient lacks decision making capacity to weigh the risks, benefits, and alternatives; but she clearly doesn’t like having a catheter in. The attending physician instituted wrist restraints pending a team meeting. Unfortunately, attempts by the patient to get free led to dislocation of both shoulders and discharge to the hospital.
Introduction
A restraint is any device or medication used to restrict a patient’s movement. In the intensive care unit, for example, soft wrist restraints may be used to prevent a patient from removing a precisely placed endotracheal tube. A lap belt intended to prevent an individual from falling from a wheelchair in a nursing home is a restraint if the patient is unable to readily undo the latch.1 In the case study above of a catheterized, demented patient, if medication is used to prevent the patient from striking out at staff when performing or maintaining catheterization, then the medication is considered a restraint.
There is little data on efficacy and benefits of restraints1. Even when the indication to use a restraint is relatively clear, the outcome is often opposite of the intention. Consider that restraints used for keeping patients from pulling out their endotracheal tubes are themselves associated with unplanned self- extubation2. Complications of restraints can be serious including death resulting from medications or devices3,4.Use of restraints should be reserved for documented indications, should be time limited, and there should be frequent re-evaluation of their indications, effectiveness, and side effects in each patient. Lack of a Food and Drug Administration (FDA) approved indication for use of medications as restraints in agitated, aggressive, demented patients has led to recommendations that medications in these situations be used only after informed consent with proxy decision makers5. Medical, environmental, and patient specific factors can be root causes of potentially injurious behavior to self or others as in the case study above. To ensure consideration and possible amelioration of these underlying causes, the Center for Medicare and Medicaid Services (CMS ) in 2006 required face to face medical and behavioral evaluation of a patient within one hour after restraints are instituted by a physician (licensed independent practitioner). As a result of controversy surrounding this rule, clarification of that rule in 2007 allowed for a registered nurse or physician assistant to perform the evaluation provided that the physician is notified as soon as possible6 . In depth situational analysis of the circumstances surrounding the use of restraints in individual cases as well as education of the patient, family, and caregivers may lead to the use of less restrictive alternatives7.
Frequency of restraint use
Frequency of restraint use depends on the setting, the type of restraint, and the country where restraint use is being studied. In the acute care hospital setting, reported physical restraint use was 7.4% to 17%.a decade ago8.Two decades ago, in long term care facilities prevalence was reported as 28%-37%.9 . There has been a steady decline over the past several decades coincident with regulation such that, according to the Department of Health and Human Services, it is down to about 5% since newer CMS rules went into effect in 2007. In contrast, some European nursing homes still report physical restraint use from 26% to 56%10,11.
Chemical restraint is slightly more prevalent than physical restraint with a prevalence of up to 34% in long term care facilities in the US prior to regulations12.There is some indication that prevalence may be decreasing, some say markedly, perhaps as a result of government regulation13,12 .Interestingly, one case-control study of more than 71,000 nursing home patients in four states showed that patients in Alzheimer special care units were no less likely to be physically restrained compared to traditional units. Furthermore, they were more likely to receive psychotropic medication14.
Complications of restraint use
The use of chemical and physical restraints is associated with an increase in confusion, falls, decubitus ulcers, and length of stay15,16. Increase in ADL dependence, walking dependence, and reduced cognitive function from baseline has also been reported17. Use of restraints often has an effect opposite the intended purpose of protecting the patient, especially when the intent is prevention of falls18. Physical restraints have even caused patient deaths. These deaths are typically due to asphyxia when a patient, attempting to become free of the restraint, becomes caught in a position that restricts breathing4,19.
Antipsychotic medications may be used as restraints in elderly patients with delirium or dementia who become combative and endanger themselves and others; however, there is no FDA approval for these drugs for this use5. In a meta-analysis, an increased relative risk of mortality of 1.6 to 1.7 in the elderly prompted the FDA to mandate a “black box” label on atypical antipsychotic medications stating that they are not approved for use in the behavioral manifestations of dementia20. Other research suggests that conventional antipsychotics are just as likely to cause death, if not more so3. Forensic research also links antipsychotic medication and patient deaths21. The reported relative risk of falls from these drugs is 1.722. Given the risks, if antipsychotic medications are used at all, they need to be prescribed as part of a documented informed-consent process. Education of patients, families of patients, and facility staff about the harms of restraints is a good first step in a plan to avoid or eliminate their use. Over the past several decades, regulations have arisen in the United States because of complications of restraints and a lack of clear evidence supporting their use.
The regulatory environment in the United States
The Omnibus Budget Reconciliation Act of 1987 (OBRA 87) resulted in regulations that specify the resident’s right to be free of the use of restraints in nursing homes when used for the purpose of discipline or convenience and when not required to treat the resident’s medical symptoms23,24. OBRA87 related regulations also specified that uncooperativeness, restlessness, wandering, or unsociability were not sufficient reasons to justify the use of antipsychotic medications. If delirium or dementia with psychotic features were to be used as indications, then the nature and frequency of the behavior that endangered the resident themselves, endangered others, or interfered with the staff’s ability to provide care would need to be clearly documented24. Comprehensive nursing assessment of problem behaviors, a physician order before or immediately after instituting a restraint, and documentation of the failure of alternatives to restraint are required before the use of a restraint is permitted. The restraint must be used for a specific purpose and for a specified time, after which reevaluation is necessary.
The Joint Commission on Accreditation of Healthcare Organizations (JCAHO) instituted similar guidelines that apply to any hospital or rehabilitation facility location where a restraint is used for physical restriction for behavioral reasons25. In response to the 1999 Institute of Medicine report, To Err is Human, JCAHO focused on improving reporting of sentinel events to increase awareness of serious medical errors. Not all sentinel events are medical errors, but they imply risk for errors as noted in the revised 2007 JCAHO sentinel event definition: A sentinel event is an unexpected occurrence involving death or serious physical or psychological injury, or the risk thereof6. The JCAHO recommends risk reduction strategies that include eliminating the use of inappropriate or unsafe restraints. The recommendations for restraint reduction are prioritized along with items like eliminating wrong site surgery, reducing post-operative complications, and reducing the risk of intravenous infusion pump errors6. It is clear that JCAHO considers placing restraints as a sentinel event to be monitored and reported. CMS and JCAHO have worked to align hospital and nursing home quality assurance efforts especially with respect to the standard concerning face to face evaluation of a patient within one hour of the institution of restraints. They held ongoing discussions that resulted in revised standards for the use of restraints in 200926. Among the agreed upon standards are: policies and procedures for safe techniques for restraint, face to face evaluation by a physician or other authorized licensed independent practitioner within one hour of the institution of the restraint, written modification of the patient’s care plan, no standing orders or prn use of restraints, use of restraints only when less restrictive interventions are ineffective, use of the least restrictive restraint that protects the safety of the patient, renewal of the order for a time period not to exceed four hours for an adult, restraint free periods, physician or licensed independent practitioner daily evaluation of the patient before re-ordering restraint, continuous monitoring, and documentation of strategies to identify environmental or patient specific triggers of the target behavior. The one hour face to face evaluation may be accomplished by a registered nurse provided that the attending physician is notified as soon as possible26.
Indications for use of restraints
The risk of using a restraint must be weighed against the risk of not using one when physical restriction of activity is necessary to continue life-sustaining treatments such as mechanical ventilation, artificial feeding, or fluid resuscitation. Every attempt should be made to allow earlier weaning from these treatments, thereby rendering the restraint unnecessary. Even in cases where the indication is relatively clear, the risks, benefits, and alternatives must be weighed (see Figure).
In an emergency, when it is necessary to get a licensed provider’s order for a restraint to prevent a patient from disrupting lifesaving therapy or to keep a patient from injuring others, an analysis of what may be precipitating the episode is essential. Are environmental factors such as noise or lighting triggering the behavio? Are patient factors such as pain, constipation, dysuria, or poor vision or hearing triggering the disruptive behavior? Is there an acute medical illness? Is polypharmacy contributing? Psychotropic drugs and drugs with anticholinergic activity are common culprits. Patient, staff, family, and other health care providers need to be queried.
One must guard against perceiving the continued need for life-sustaining treatment and the use of restraints as being independent factors, because that misconception can lead to a vicious cycle. For example, a patient who has persistent delirium from polypharmacy and needs artificial nutrition and hydration which perpetuates the need for continued chemical and physical restraints. Correcting the polypharmacy and the restraint as a potential cause of the delirium can break the cycle. When restraints are indicated, one must use the least-restrictive restraint to accomplish what is needed for the shortest period of time. Restraint-free periods and periodic reassessments are absolutely required.
A weaker indication is the use of restraints to prevent patient self-injury when the danger is not imminent. Such an indication exists when a patient repeatedly attempts unsafe ambulation without assistance or when he or she cannot safely ambulate early in the process of rehabilitation from deconditioning or after surgery. In these cases, weighing the risks and benefits of the restraint is more difficult than when considering restraints to maintain life-sustaining treatment.
Even more difficult to justify is the use of restraints to restrict movement to provide nonurgent care. An example might be a patient who repeatedly removes an occlusive dressing for an early decubitus ulcer. In these cases, it is more fruitful to use alternatives to restraints. For example, considering alternatives to a urinary catheter is more important than documenting that restraints are indicated to keep the patient from pulling it out.
If used, the specific indication, time limit, and plan for ongoing reevaluation of the restraint must be clearly documented. Effectiveness and adverse effects must be monitored. Restraint-free periods are also mandatory. The same is true for chemical restraints. Periodic trials of dosage reduction and outcome are mandatory.
Barriers to reducing the use of restraints
Perceived barriers to reducing restraints can be thought of as opportunities to build relationships between patients, physicians, staff, patients’ families, and facility leaders. A legitimate fear of patient injury, especially when the patient is unable to make his or her own decisions, is usually the root motivation to use restraints. Ignorance about the dangers of restraint use results in a sincere, but misguided, belief that one is acting in the patient’s best interest27. Attempts to educate physicians, patients, and staff may not have been made. These barriers are opportunities for the community to work together in creative partnerships to solve these problems. Even in communities where there are no educational institutions, there are opportunities for educational leadership among physician, nursing, and other staff. Conversely, lack of commitment to reducing restraints by institutional leaders will tend to reinforce the preexisting barriers. Regulatory intervention has been a key part of gaining the commitment of institutional leadership when other opportunities were not seized. On the other hand, competing regulatory priorities such as viewing a serious fall injury as a ‘never event’ and simultaneously viewing institution of a restraint as a sentinel event may lead to reduced mobility of the patient18. An example of this would be the use of a lap belt with a patient-triggered release. The patient may technically be able to release the belt, but the restricted mobility may lead to deconditioning and an even higher fall risk when the patient leaves the hospital. In the process of preventing the serious fall injury or ‘never event’ there is, even at the regulatory level, intervention that may not be in the patient’s best interest. These good intentions are, again, a barrier to the reduction of the use of restraints and an opportunity for physician leadership in systems based care collaboration. Physician leadership probably needs to extend beyond educational efforts. Evidence suggests education may be necessary but not sufficient to reduce the use of restraints10.
Reducing the use of restraints
Steps can be taken to reduce the use of restraints before the need for them arises, when the need for restraints finally does arise, and while their use is ongoing.
Programs to prevent delirium, falls in high-risk patients, and polypharmacy are all examples of interventions that may prevent the need for restraints in the first place. Attention to adequate pain control, bowel function, bladder function, sleep, noise reduction, and lighting may all contribute to a restraint-free facility.
When a restraint is deemed necessary, a sentinel event has occurred. Attempts to troubleshoot the precipitating factors must follow. Acute illness such as infection, cardiac, or respiratory illness must be considered when a patient begins to demonstrate falls or begins to remove life-sustaining equipment. Highly individualized assessment of the patient often requires input from physical therapy, occupational therapy, social work, nursing, pharmacy, and family. If root causes are determined and corrected, the need for restraints can be ameliorated and alternatives can be instituted.
The least restrictive alternative should be implemented when needed. For example, a lowered bed height with padding on the floor can be used for a patient who is at risk for falls out of bed in contrast to the use of bedrails for that purpose. Another example is the use of a lap belt with a Velcro release as opposed to a vest restraint without a release. A third example is the use of a deck of cards or a lump of modeling clay to keep the patient involved in an alternative activity to the target behavior that may be endangering the patient or staff. Alternatives to the use of restraints need to be considered both when restraint use is initiated and during their use. Judicious use of sitters has been shown to reduce falls and the use of restraints28. When danger to self or others from patient behaviors and restraints are deemed necessary, a tiered approach has been recommended by Antonelli29 beginning with markers and paper or a deck of cards for distraction and then proceeding up to hand mitts, lap belts, or chair alarms if needed. Vest or limb restraints are the default only when other methods have been ineffective29.
Literature from the mental health field provides some guidance to those attempting to use the least intrusive interventions for older patient behaviors that endanger themselves or others. A combination of system-wide intervention, plus targeted training in crisis management to reduce the use of restraints has been demonstrated to be effective in multiple studies30. In a recent randomized controlled study, one explanation the author gives for the ineffectiveness the educational intervention is that the intervention was “at the ward level unlike other restraint reduction programs involving entire organizations.”10. Research and clinical care in restraint reduction will likely need to be both patient-centered and systems-based in the future.
Case study revisited
Our 79 year old female with frontotemporal dementia and spinal stenosis noted in the above case pulls out her urinary catheter. The physician is called and determines that the patient’s urine has been clear prior to the episode, that she has no fever, nor does she have evidence of acute illness. The patient is likely pulling the catheter out simply because of the discomfort caused by the catheter itself since the patients behavior is at the same baseline as before the catheter was inserted as determined by discussion with the staff. The patient is unable to inhibit her behavior because of the frontotemporal dementia. The physician places a call to the medical power of attorney and explains the risks of bladder infection, bladder discomfort, renal insufficiency, and overflow incontinence from untreated neurogenic bladder. This is weighed against the risk of frequent infections and bladder discomfort from a chronic indwelling urinary catheter, or damage to the urethra from pulling the catheter out. The option of periodic straight catheterization is dismissed by the medical power of attorney as being too traumatic for this demented patient who becomes agitated during this procedure.
The medical power of attorney considers the options and agrees to observation by the staff without the catheter overnight with a team conference the next day. At the conference, it was noted that overnight the patient had several episodes of overflow incontinence in spite being toileted every few hours while awake. The patient had no signs of discomfort and was changed when found to be wet. A bladder scan done at the facility showed a few hundred cubic centimeters of residual urine after the patient was noted wet and changed. The team conference yielded the informed decision to continue checking the patient frequently and changing when wet as well as frequent toileting opportunities.
The patient continued at baseline for twelve weeks until she developed urinary sepsis and the patient’s medical power of attorney was contacted about additional care decisions.
Conclusion
A restraint is any device or medication used to restrict a patient’s movement. Complications of restraints can be serious including death resulting from both medications and devices. Use of restraints should be reserved for documented indications, should be time limited, and there should be frequent re-evaluation of their indications, effectiveness, and side effects in each patient. Analysis of environmental and patient specific root causes of potentially self-injurious behavior can lead to reduction in the use of restraints. Education of the patients, families, and the health care team can increase the use of less restrictive alternatives.
In the first part of this review we considered neurodegenerative and neurobehavioural diseases and the findings that these diseases commonly are associated with systemic and central nervous system bacterial and viral infections.1 In this second part we continue with psychiatric diseases, autoimmune diseases, fatiguing illnesses, and other chronic diseases where chronic infections play an important role.
Psychiatric diseases
Borrelia-associated psychiatric disorders
In addition to neurologic and rheumatologic symptoms Borrelia burgdorferi has been associated with several psychiatric manifestations2, 3 (see also below). Such infections can invade the central nervous system and may cause or mimic psychiatric disorders or cause a co-morbid condition. A broad range of psychiatric conditions have been associated with Lyme disease, including paranoia, dementia, schizophrenia, bipolar disorder, panic attacks, major depression, anorexia nervosa and obsessive-compulsive disorder.4-7 For example, depressive states among patients with late Lyme disease are fairly common, ranging from 26% to 66%.3 It is not known whether B. burgdorferi contributes to overall psychiatric morbidity, but undiagnosed chronic Lyme disease caused by this spirochete is considered a differential diagnosis in patients with certain psychiatric symptoms such as depressive symptoms, lack of concentration and fatigue.
The neuropsychiatric sequelae of chronic Lyme disease remains unclear. Studies were performed, some on large numbers of patients, to investigate whether a correlation exists between chronic Lyme disease (defined by seropositivity) and psychiatric disorders.8-11 Interestingly, different results were reported on the association between B. burgdorferi infection and psychiatric morbidity.8-11 For example, Hájek et al.8 compared the prevalence of antibodies to B. burgdorferi in groups of psychiatric patients and healthy subjects. Among the matched pairs, 33% of the psychiatric patients and 19% of the healthy comparison subjects were seropositive. In contrast, Grabe et al.11 did not find an association between Borrelia seropositivity and mental and physical complaints. In 926 consecutive psychiatric patients that were screened for antibodies and compared with 884 simultaneously recruited healthy subjects, seropositive psychiatric patients were found to be significantly younger than seronegative ones, and this was not found in the healthy controls.10 However, none of the psychiatric diagnostic categories used in this study exhibited a stronger association with seropositivity.10 These findings suggest a potential association between B. burgdorferi infection and psychiatric morbidity, but fail to identify any specific clinical 'signature' of the infection. This might be due to the very low incidence in an endemic region (0.2%, CI 95% 0.0% to 1.1%) as demonstrated in 517 patients hospitalized for psychiatric diseases.9
In addition to serological data, clinical evidence for the association of psychiatric symptoms and post-Lyme disease has also been investigated. If mental and physical complaints in patients were assessed with the von Zerssen's complaint scale using multivariate analyses, the data revealed that definitions of seropositivity were not associated with increased mental or physical complaints.11 In contrast, if the SF-36 was used to determine Quality of Life (QOL) in post-Lyme patients, the average SF-36 physical component summary (40±9, range 29-44) and mental component summary (39±14, range 23-46) of the QOL assessment were worse than the general USA population, and they could be significantly improved by anti-Lyme antibiotics (46% versus 18%, p=0.007).5 Barr et al.12 examined the relation between complaints of memory disturbance and measures of mood and memory functioning in 55 patients with serological evidence of late-stage Lyme borreliosis. There was a significant correlation between subjective memory ratings and self-reported depression (p<0.001) but not with objective memory performance, indicating memory disturbance in chronic Lyme patients. Using a structured psychiatric interview, the Positive and Negative Affect Schedule, the Lyme Symptom Checklist, and a battery of neuropsychological tests in 30 post-Lyme patients, participants did not appear to have an elevated incidence of psychiatric disorders or psychiatric history.13 Their mood, however, was characterized by lowered levels of positive affect and typical levels of negative affect that were similar to affect patterns in individuals with chronic fatigue syndrome (CFS). Similarly, Hasset et al.4, 7 reported on 240 consecutive post-Lyme patients who were screened for clinical psychiatric disorders, such as depression and anxiety. After adjusting for age and sex, these disorders were more common in symptomatic patients than in the comparison group (Odds Ratio=3.54, CI 95% 1.97-6.55, p<0.001), but personality disorders were comparable in both groups.
Although psychiatric co-morbidity and other psychological factors are prominent in post-Lyme patients, it remains uncertain whether these symptoms can be directly attributed to the chronic course of Borrelia infections or to other chronic illness-related factors.
Schizophrenia
Several microbes have been suspected as pathogenetic factors in schizophrenia, such as Chlamydia species, toxoplasma, and various viruses. For example, a number of studies have reported associations between Toxoplasma gondii infection and the risk of schizophrenia with an overall hazard ratio of 1.24.14 In addition, chlamydial infections have been found in 40% of schizophrenic patients compared to 7% in healthy controls.15 These infections represented the highest risk factor yet found to be associated with schizophrenia that was highly significant (Odds Ratio=9.43, p=1.39 x 10⁻¹⁰), especially with Chlamydophila psittaci (Odds Ratio=24.39, p=2.81 x 10⁻⁷). Interestingly, schizophrenic carriers of the HLA-A10 genotype were clearly the most often infected with Chlamydia, especially C. psittaci (Odds Ratio=50.00, p=8.03 x 10⁻⁵), pointing to a genetically related susceptibility.15 However, skepticism against the role of bacterial infection in schizophrenia was also fostered by the low impact of anti-infectious treatment on the course of disease progression in schizophrenia.16
Genetic backgrounds and viral infections and/or reactivations as well as cytokine-related pathomechanisms have also been proposed as causative for psychiatric disorders, such as schizophrenia. Specific genetic patterns of MICB polymorphism (MHC class I polypeptide-related sequence B, chromosome 6p21) were identified in patients seropositive for CMV and HSV-1.17 Similar polymorphisms were found for the COMT Val158Met related to serological evidence of HSV-1 infections in individuals with bipolar disorder.18 This serologic evidence of HSV-1 infection appeared to be associated with cognitive impairment in individuals with bipolar disorders19 and was found to be an independent predictor of cognitive dysfunction in individuals with schizophrenia.20 In addition, viral exposure during gestation has been described as a risk factor for schizophrenia. Offspring of mothers with serologic evidence of HSV-2 infection were at significantly increased risk for the development of psychoses (Odds Ratio=1.6; CI 95% 1.1-2.3). These results are consistent with a general model of risk resulting from enhanced maternal immune activation during pregnancy.21 However, this was not confirmed in another study.22 Similar contradictory results were observed in a small group of 8 patients with schizophrenia where reactivation of herpesviruses (HSV-1, CMV, EBV, varicella-zoster virus and human HHV-6) and other viruses (measles, rubella, mumps, influenzaA and B and Japanese encephalitis viruses) during acute onset or exacerbation of schizophrenia was investigated, but none of these viruses were detected in these patients.23 Also, a search for HSV-1 or varicella zoster virus infection in postmortem brain tissue from schizophrenic patients did not reveal evidence of persistent CNS infections with these viruses.24
Schizophrenic patients show a number of cytokine changes that may be important in their condition. For example, differences in interleukin-2, -4 and –6, among other cytokines, have been seen in schizophrenic patients.25-27 Often these changes in cytokines or cytokine receptors have been linked to associated genetic changes found in schizophrenia.28-30 Monji et al.31 recently reviewed the evidence for neuroinflammation, increases in pro-inflammatory cytokines and genetic changes in schizophrenia and concluded that these changes are closely linked to activation of microglia. Although the microglia comprise only about 10% of the total brain cells, they respond rapidly to even minor pathological changes in the brain and may contribute to neurodegeneration through the production of pro-inflammatory cytokines and free radicals. CNS infections could also activate microglia and cause similar events.
Neuropsychiatric Movement Disorders
Giles de la Tourette’s syndrome (TS) is a neurological condition that usually begins in childhood and results in involuntary sounds or words (vocal tics) and body movements (movement tics). An association between infection and TS has been repeatedly described.32 Abrupt onset of the disease, usually after infection, was noted in up to 11% of these patients.33-34 A role for streptococcal infections (PANDAS, see below) as causative or mediating agent in TS was established several years ago.35 Additionally, the involvement of other infectious agents, such as B. Burgdorferi or M. pneumoniae, has been described in case reports and small studies. For example, comparing 29 TS patients with 29 controls revealed significantly elevated serological titers in TS patients (59% versus 3%). This higher proportion of increased serum titers, especially IgA titers, suggested a putative role for M. pneumoniae in a subgroup of patients with TS.36 In predisposed persons, infection with various agents including M. pneumoniae should be considered as at least an aggravating factor, but an autoimmune reaction has to be taken into account in TS patients. In addition, co-infections with toxoplasmosis have been described in a few case reports of obsessive-compulsive disorder (OCD).37 As mentioned above, streptococcal infections are likely to play a pivotal role in these syndromes.35
The pathogenic mechanism may be secondary to an activation of the immune system, resulting in an autoimmune response. This will be discussed in the next section.
Autoimmune Diseases
Infections are associated with various autoimmune conditions.38-40 Autoimmunity can occur when infections like cell-wall-deficient bacteria are released from cells containing parts of cell membranes that are then seen as part of a bacterial antigen complex, or bacteria can synthesize mimicry antigens (glycolipids, glycoproteins or polysaccharides) that are similar enough in structure (molecular mimicry) to stimulate autoimmune responses against similar host antigens. Alternatively, viral infections can weaken or kill cells and thus release cellular antigens, which can stimulate autoimmune responses, or they can incorporate molecules like gangliosides into their structures.
In addition to molecular mimicry, autoimmunity involves several other complex relationships within the host, including inflammatory cytokines, Toll-like receptor signalling, stress or shock proteins, nitric oxide and other stress-related free radicals, among other changes that together result in autoimmune disease.38, 39
Guillain-Barré syndrome
Guillain-Barré syndrome (GB) is a demyelinating autoimmune neuropathy often associated with bacterial infections.40 Symptoms include pain, muscle weakness, numbness or tingling in the arms, legs and face, trouble speaking, chewing and swallowing. Of the types of infections found in GB, Campylobacter jejuni, Mycoplasma pneumoniae and Haemophilus influenzae are often found.39 For example, Taylor et al.41 found serological evidence of C. jejuni in 5 of 7 patients with GB and other motor neuropathies, and Gregson et al.42 found anti-ganglioside GM1 antibodies that cross-reacted with C. jejuni liposaccharide isolates. When infections were examined in GB cases in India, Gorthi et al.43 found that 35% and 50% of GB patients had serological evidence of C. jejuni and M. penumoniae infections, respectively, while one-third of cases showed evidence of both infections. In Japan Mori et al.44 found that 13% of GB patients had antibodies against Haemophilus influenzae . Autoantibodies stimulated by infections found in GB patients can cross-react with nerve cell gangliosides (anti-GM1, anti-GM1b, anti-GD1a, among others), and these are thought to be important in the pathogenesis of GB.45 Indeed, injection of C. jejuni lipo-oligosaccharide into rabbits induces anti-gangliosides and a neuropathy that resembles acute motor axonal neuropathy.46
Viruses have also been found to be associated with GB.40 Examples are: CMV,47 HIV,48 herpes simplex virus,49 West Nile virus,50 and HHV-6.51
Paediatric autoimmune neuropsychiatric disorders associated with Streptococci ('PANDAS')
Streptococcal infections in children are usually benign and self-limited. In a small percentage of children, however, prominent neurologic and/or psychiatric sequelae can occur. Post-streptococcal basal ganglia dysfunction has been reported with various manifestations, all of which fall into a relatively well-defined symptom complex or syndrome called paediatric autoimmune neuropsychiatric disorders associated with streptococcal infection (PANDAS).52
Evidence from past studies indicates that adults and children with a symptom course consistent with PANDAS experience subtle neuropsychological deficits similar to those of primary psychiatric diagnosis of OCD and TS.53 PANDAS are now considered as a well-defined syndrome in which tics (motor and/or vocal) and/or OCD are consistently exacerbated in temporal correlation to a group A beta-hemolytic streptococcal infection. However, the pathological relationship between OCD or tics/TS in childhood to antecedent group A Streptococci is still not fully understood.52
In an epidemiological investigation Leslie et al.54 assessed whether antecedent streptococcal infection(s) increase the risk of subsequent diagnosis of OCD, TS, other tic disorders, attention-deficit hyperactivity disorder (ADHD) or major depressive disorder (MDD). Children with newly diagnosed OCD, TS, or tic disorder were more likely than controls to have had a diagnosis of streptococcal infection in the previous year (Odds Ratio=1.54, CI 95% 1.29-2.15). Previous streptococcal infection was also associated with incident diagnoses of ADHD (Odds Ratio=1.20, CI 95% 1.06-1.35) and MDD (Odds Ratio=1.63, CI 95% 1.12-2.30).54 Similar results were found in a retrospective, cross-sectional, observational study of 176 children and adolescents with tics, TS, and related problems.55 In a case-control study of children 4 to 13 years old patients with OCD, TS, or tic these disorders were more likely than controls to have had prior streptococcal infection (Odds Ratio=2.22; CI 95% 1.05-4.69) in the 3 months before onset date. The risk was higher among children with multiple streptococcal infections within 12 months (Odds Ratio=3.10; CI 95% 1.77-8.96).56 Having multiple infections with group A beta-hemolytic Streptococcus within a 12-month period was associated with an increased risk for TS (Odds Ratio=13.6; CI 95% 1.93-51.0). Similar results were found in patients with typical symptoms of Tourette's syndrome.57 The frequency of elevated anti-streptolysin O titers was also significantly higher (p=0.04) in patients with attention-deficit hyperactivity disorder (64%) than in a control group (34%).58
Sydenham's chorea is one manifestation of post-streptococcal neuropsychiatric movement disorders. A pathogenic similarity between Sydenham's chorea, TS and other PANDAS has been suggested since some patients can present with one diagnosis and then evolve with other neuropsychiatric conditions.59 These observations support a role of group A streptococcal infection and basal ganglia autoimmunity. Anti-basal ganglia antibodies that are associated with serologic evidence of recent streptococcal infection were found as potential diagnostic markers for this group of disorders, which includes Sydenham's chorea as the prototype.60
However, contradictory results were also reported.61 For example, an association between symptom exacerbations and new group A beta-hemolytic streptococcus infections among 47 paediatric patients with TS and/or OCD was not observed.59 In addition, the failure of immune markers for streptococcal infections to correlate with clinical exacerbations in a small study of children with paediatric autoimmune neuropsychiatric disorders raised concerns about the viability of autoimmunity as a pathophysiological mechanism in these syndromes.62 However, in a second study the same group reported that patients who fit published criteria for paediatric autoimmune neuropsychiatric disorders associated with streptococcal infections represented a subgroup of those with chronic tic disorders and OCD. These patients may be vulnerable to group A beta-hemolytic Streptococcus infection as a precipitant of neuropsychiatric symptom exacerbations. 63
Taken together, these findings provide epidemiologic evidence that some paediatric-onset neuropsychiatric disorders, including OCD, tic disorders, ADHD, and MDD, may be, at least partially, related to prior streptococcal infections. Group A beta-hemolytic Streptococcus infections are likely not the only event associated with symptom exacerbations for PANDAS patients, but they appear to play a role at least in a subgroup of these children. A potential genetic susceptibility for these post-infectious complexes has been recently proposed.64
The recent recognition that these paediatric neurobehavioural syndromes have infectious and/or immunologic triggers has pointed to important new avenues for their management.
Chronic fatigue syndrome/myalgic encephalomyelitis (CFS/ME) is a fatiguing illness characterised by unexplained, persistent long-term disabling fatigue plus additional signs and symptoms, including neurophysiological symptoms.65 Brain imaging studies have shown that CFS/ME patients are dysfunctional in their ventral anterior cingulate cortex, and they also have other brain MRI abnormalities.66, 67 In addition, CFS/ME patients also have immunological and inflammation abnormalities, such as alternations in natural killer cell function68, 69 and cytokine profiles.70, 71 In addition, the hypothalamo-pituitary-adrenal axis, which plays a major role in stress responses, appears to be altered in CFS/ME.72
Most, if not all, CFS/ME patients have multiple chronic bacterial and viral infections.73-80 For example, when patients were examined for evidence of multiple, systemic bacterial and viral infections, the Odds Ratio for this was found to be 18 (CI 95% 8.5-37.9, p< 0.001).75 In this study CFS/ME patients had a high prevalence of one of four Mycoplasma species (Odds Ratio=13.8, CI 95% 5.8-32.9, p< 0.001) and often showed evidence of co-infections with different Mycoplasma species, C. pneumoniae (Odds Ratio=8.6, CI 95% 1.0-71.1, p< 0.01) and HHV-6 (Odds Ratio=4.5, CI 95% 2.0-10.2, p< 0.001).75 In a separate study the presence of these infections was also related to the number and severity of signs and symptoms in CFS/ME patients, including neurological symptoms.77 Similarly, Vojdani et al.76 found Mycoplasma species in a majority of CFS/ME patients, but this has not been seen in all studies.81 Interestingly, when European CFS/ME patients were examined for various Mycoplasma species, the most common species found was M. hominis,82 whereas in North America the most common species found was M. pneumoniae,75, 77 indicating possible regional differences in the types of infections in CFS/ME patients. In addition to Mycoplasma species, CFS/ME patients are also often infected with B. burgdorferi,80 and as mentioned above, C. pneumoniae.75, 77, 83
Other infections are also found in CFS/ME patients, such as viral infections: CMV,84 parvovirus B19,78 enterovirus79 and HHV-6.75, 77, 85-88 For example, Ablashi et al.88 found that 54% of CFS/ME patients had antibodies against HHV-6 early protein, compared to 8% of controls. Similarly, Patnaik et al.86 found that 77% of CFS/ME patients were positive for HHV-6 early antigen IgG or IgM antibodies, whereas only 12% of control subjects had IgG or IgM antibodies to HHV-6 early antigen. Recently a new retrovirus, XMRV, was found in mononuclear blood cells of 67% of 101 chronic fatigue syndrome patients compared to only 3.7% of healthy controls. Cell culture experiments determined that the patient-derived virus was infectious and could possibly be transmitted.89
Gulf War illnesses
GWI is a syndrome similar to CFS/ME.90 In most GWI patients the variable incubation time, ranging from months to years after presumed exposure, the cyclic nature of the relapsing fevers and the other chronic signs and symptoms, and their subsequent appearance in immediate family members, are consistent with an infectious process.90, 91 GWI patients were exposed to a variety of toxic materials including chemicals, radiochemicals and biologicals so not all patients are likely to have infections as their main clinical problem. Neurological symptoms are common in GWI cases.90 Baumzweiger and Grove92 have described GWI as neuro-immune disorder that involves the central, peripheral and autonomic nervous systems as well as the immune system. They attribute a major source of the illness to brainstem damage and central, peripheral and cranial nerve dysfunction from demyelination. They found GWI patients have muscle spasms, memory and attention deficits, ataxia and increased muscle tone.92
Bacterial infections were a common finding in many GWI patients.90 Mycoplasmal infections were found in about one-half of GWI patients, and more than 80% of these cases were PCR positive for M. fermentans.90, 91, 93-95 In studies of over 1,500 U.S. and British veterans with GWI, approximately 45% of GWI patients have PCR evidence of such infections, compared to 6% in the non-deployed, healthy population. Other infections found in GWI cases at much lower incidence were Y. pestis, Coxiella burnetii and Brucella species.90
When we examined the immediate family members of veterans with GWI who became sick only after the veteran returned to the home, we found that >53% had positive tests for mycoplasmal infections and showed symptoms of CFS/ME. Among the CFS/ME-symptomatic family members, most (>80%) had the same Mycoplasma fermentans infection as the GWI patients compared to the few non-symptomatic family members who had similar infections (Odds Ratio=16.9, CI 95% 6.0-47.6, p<0.001).91 In contrast, in the few non-symptomatic family members that tested Mycoplasma-positive, the Mycoplasma species were often different from the species found in the Gulf War Illness patients (M. fermentans).The most sensible conclusion is that veterans came home with M. fermentans infections and then transmitted these infections to immediate family members.91
Some other infectious diseases with neurological aspects
Lyme Disease
Lyme disease is caused by a tick bite and the entry of the spiral-shaped spirochete B. burgdorferi as well as other co-infections.96 Lyme disease is the most common tick-borne disease in North America. After incubation for a few days to a month, the Borrelia spirochete and co-infections migrate through the subcutaneous tissues into the lymph and blood where they can travel to near and distant host sites, including the central nervous system.3, 97-99 Transplacental transmission of B. burgdorferi and co-infections can occur in pregnant animals, including humans, and blood-borne transmission to humans by blood transfusion is likely but unproven. The tick-borne co-infections associated with Lyme disease can and usually do appear clinically at the same time, complicating clinical dignoses.100
Lyme disease signs and symptoms eventually overlap with the signs and symptoms of other chronic illnesses, and patients are often diagnosed with illnesses like CFS/ME, chronic arthritis or a neurological disease.80,97-100 About one-third of cases with Lyme disease start with the appearance of a round, red, bulls-eye skin rash (erythema migrans) at the site of the tick bite, usually within 3-30 days.100 Within days to weeks mild flu-like symptoms can occur that include shaking chills, intermittent fevers and local lymph node swelling. After this localised phase, which can last weeks to months, the infection can spread to other sites resulting in disseminated disease. In the disseminated (late) phase patients present with malaise, fatigue, fever and chills, headaches, stiff neck, facial nerve palsies (Bell’s palsy) and muscle and joint pain, and other signs and symptoms.100-104
The disseminated (late) phase of Lyme disease is a chronic, persistent disease with ophthalmic, cardiac, musculoskeletal, central nervous system and internal organ invasion. When it involves the central and peripheral nervous systems, it is often termed neuroborreliosis.100, 104 At this late stage, arthritis, neurological impairment with memory and cognitive loss, cardiac problems (such as myocarditis, endocarditis causing palpitations, pain, bradycardia, hypertension) and severe chronic fatigue are usually apparent.80, 100-102 The signs and symptoms of the chronic (late) phase of the disease usually overlap with other chronic conditions, such as CFS/ME, chronic arthritis, as well as neurodegenerative diseases, causing confusion in the diagnosis and treatment of the chronic phase in patients with Lyme Disease.80, 97, 100, 105 Patients with late stage neuroborreliosis exhibit neuropathologic and neuropsychiatric disease similar to some of the neurodegenerative diseases discussed in previous sections.1
Diagnostic laboratory testing for Lyme disease at various clinical stages is not fool-proof, and experts often use a checklist of signs and symptoms and potential exposures, along with multiple laboratory tests to diagnose Lyme disease.104 The laboratory tests include serology, Western blot analysis of B.burgdorferi associated bands, PCR analysis of blood and the nonspecific decrease in CD-57 natural killer cells. Unfortunately, similar to other intracellular bacteria, Borrelia spirochetes are not always released into the blood circulation or other body fluids, making the very sensitive PCR method less than reliable for diagnosing Lyme Borrelia with blood samples. Lebech and Hansen106 found that only 40% of cerebrospinal fluid samples from patients with Lyme neuroborreliosis were positive for B.burgdorferi by PCR.
Co-infections in Lyme disease are important but, in general, have not received the attention that B. burgdorferiattracts. Some of the Lyme Disease co-infections on their own, such as M. fermentans, have been shown to produce signs and symptoms comparable to B. burgdorferi infections.80, 102
The most common co-infections found in Lyme disease are species of Mycoplasma, mostly M. fermentans, present in a majority of cases.80, 103, 107 In some cases multiple mycoplasmal infections are present in patients with Lyme disease,80 while other common co-infections include Ehrlichia species, Bartonella species and Babesia species. Such co-infections are present in 10-40% of cases.103, 104, 108-112Ehrlichia and Bartonella species are usually found along with Mycoplasma species in Lyme disease.94, 98, 108-111 Bartonella species, such as B.henselae,111 which also causes cat-scratch disease,113 are often found in neurological cases of Lyme disease.100, 111
Protozoan co-infections have been found with B.burgdorferi, such as intracellular Babesia species.100, 108, 109, 112, 114 The combination of Borrelia, Mycoplasma and Babesia infections can be lethal in some patients, and ~7% of patients can have disseminated intravascular coagulation, acute respiratory distress syndrome and heart failure.109
Brucellosis
Brucellosis is a nonspecific clinical condition characterized by intracellular Brucella species infection.115 Approximately 40% of patients with Brucella spp. infections have a systemic, multi-organ chronic form of brucellosis that is similar to CFS/ME in its multi-organ signs and symptoms.115, 116Brucella infections can invade the central nervous system and cause neurological symptoms.117
Brucella species cause infections in animals, and often humans get the infections from prolonged contact with infected animals. Thus these bacteria are zoonotic, they are capable of being transmitted from animals to humans. Although there are at least eight species of Brucella that are pathogenic, only B. melitensis, B. abortus, B. suis and B. canis have been reported to be pathogenic in humans.116
When CFS/ME patients were examined for the presence of Brucella spp. infections, approximately 10% showed evidence by PCR of Brucella spp. infections (Odds Ratio=8.2, CI 95% 1-66, p<0.01).118 Interestingly, urban CFS/ME patients with Brucella infections were not as prevalent as rural patients with Brucella infections (Odds Ratio=5.5, CI 95% 3-23.5, p<0.02), while control subjects had very low (1.4%) rates of infection. Co-infections with Mycoplasma species were also found in Brucella-positive CFS/ME patients.118
Final comments to part 2
The progression, and in some cases, the inception of many chronic diseases are probably elicited by various bacterial and viral infections.1, 39, 40, 119 Even if infections are not directly involved in the pathogenesis of these diseases, patients with chronic conditions are at risk of a variety of opportunistic infections that could result in co-morbid conditions or promote disease progression. Infections can complicate diagnosis and treatment, and patients with late-stage disease with complex neurological manifestations, such as meningitis, encephalitis, peripheral neuropathy, psychiatric conditions, or with other signs and symptoms could have infections that are not recognized or treated.
Patients with chronic diseases are particularly difficult to treat using single modality approaches, and this is particularly true for patients who also have multiple chronic infections.103, 109 The multi-focal nature of chronic diseases and the fact that often treatments are given to suppress signs and symptoms, rather than treat causes of the disease or its progression, have resulted in incomplete or ineffective treatments. On the other hand, even if the causes of chronic diseases are known, by the time therapeutic intervention is undertaken, it may be entirely too late to use approaches that should work on the disease if chronic infections were not present. Moreover, if complex, chronic infections are ignored or left untreated, recovery may be difficult, if not impossible to achieve.
At the moment the evidence that particular or specific types of infections are responsible for the inception or pathogenesis of chronic diseases is inconclusive.119 One of the problems that arises in trying to prove this hypothesis is that not all patients appear to have similar chronic infections. Some individuals can harbour chronic infections without any observable signs or symptoms. Although the incidence of chronic infections of the types discussed in this review in symptom-free individuals is generally very low, usually only a few percent,74-76, 120 that does not prove that they are important in pathogenesis. Since patients with chronic diseases have been identified that do not have easily diagnosed chronic infections, most researchers have concluded that infections are not involved in the pathogenesis of chronic diseases. Unfortunately, the tools available to find chronic infections are not optimal, and many patients are likely go undiagnosed with chronic infections for purely technical reasons.1,119-121
In the history of medicine animal models of disease have provided useful information that could not be obtained through clinical studies alone. Indeed, the field of chronic diseases could benefit from the greater use of relevant animal models. We suggest that to be useful, the pathogenesis of the animal models of disease must be similar to the pathogenesis of human disease and the animal models must have a similar response to therapy as humans. Thus such models are only relevant if they closely mimic human disease and its response to treatment. For example, the infection of non-human primates with neuropathologic microorganisms, such as Mycoplasma fermentans, resulted in brain infections and fatal diseases with clinically typical neurological signs and symptoms.122 These primates also respond to therapies that have been used successfully to treat humans.93,123 Thus this particular model may be useful if it can be reproucibly infected with specific microorganisms and later develop neurological signs and symptoms that closely mimic chronic human neurological diseases. Future efforts to determine the relationship between specific infections and the pathogenesis of various chronic diseases may well depend on the further development of relevant animal models.