


ISSN 1757-8515
Optimizing the time of a General Practitioner by investigating the daily tasks of the on-call doctor
Gaurav Pydisetty, Mehrban Ghani & Athena Michaelides
Cite this article as: BJMP 2020;13(2):a010
|
|
Abstract Background: Funding for General Practice in United Kingdom (UK) has decreased by 20% which has halted the expansion of new practices and recruitment of General Practitioners (GP). This has resulted in an increased workload for the GP. The aim is to analyse the tasks of the on-call GP to determine ways to optimise their time. Design and Setting: Quantitative analysis of tasks from a single National Health Service (NHS) England GP Centre. Methods: Using the Egton Medical Information Systems (EMIS) web platform, all tasks of the on-call doctor were collected for a single month and divided into 5 categories: medication request; appointment/advice or test results; referral; sick note; and miscellaneous tasks. Results: The total 969 tasks were distributed across the 4 weeks as follows: week 1 accounted for 26.7% of total tasks; week 2 accounted for 25.6%; week 3 accounted for 25.1%; and week 4 accounted for 22.5%. When tasks were divided according to type, we found that 50.9% of the total tasks were medication requests; 35.9% were for appointments, advice, or results; 6.1% were miscellaneous tasks; 4.6% were for sick notes; and 2.4% were for referrals. A closer look into the medication category revealed that 49.1% (or 10-25 requests per day) were for prescriptions that should have been on repeat rather than on acute prescription. Given that a GP spends 1-2 minutes per task, this could save around 3-16 hours per month. Conclusion: A GPs workload can be reduced by analysing the medication tasks received and placing certain drugs on repeat rather than on acute prescription. Keywords: Tasks; requests; on-call doctor; optimize; repeat prescriptionAbbreviations: ACEI: Angiotensin converting enzyme inhibitor, EMIS: Egton Medical Information Systems, GP: General Practice, NHS: National Health Service, PPI: Proton Pump Inhibitors, UK: United Kingdom. |
BACKGROUND
General Practice is the first point of contact for most patients who ask for professional medical advice in the United Kingdom (UK) National Health Service (NHS)1. Primary care makes up around 90% of all NHS activity and, as a result of increasing populations overtaking the number of newly qualified General Practitioners (GPs), the burden of tasks from patients has increased exponentially. GPs characterise their workload as “unmanageable” or “unsustainable” and 93% have reported that patient care has been subsequently affected.1 Funding into General Practice from the NHS expenditure has fallen by almost 20% which has halted the expansion of new practices and recruitment of substantial GPs. The growth of new GPs increased by 0.2% only, between 2009-2014, and this has indirectly pressured existing doctors to care for more patients. This is reducing job morale as well as patients’ satisfaction with services. The main causes of increased workload are increased administrative load, high patient expectations and increased risk of litigation.2
Four years ago, there were four doctors at our practice. As time passed, one doctor emigrated, another doctor passed away and the third had retired. This has left two doctors at the practice at this current time. The practice currently employs locum GPs to cover the pressures of daily patient appointments as, according to new studies, there are now on average an astonishing 2,100 registered patients per GP.3 The loss of permanent doctors in this practice may be due to the location of the GP surgery. Barnsley, according to uSwitch in 2015, was ranked 122 out of 138 local areas across the UK based on 26 factors such as household income, life expectancy, hours of sunshine and the cost of essential goods including food bills, fuel costs and energy bills.4 Adding to the lack of permanent GPs, recruitment into General Practice as a specialty has been scarce. Studies have shown that medical graduates chose medical careers that they considered as more stimulating and interesting. One study mentions that medical students are attracted to technical or biomedical forms of medical practice, as opposed to a holistic view of medicine such as that of General Practice.5
Non-permanent GPs in the practice are keen on taking on flexible working hours, which meant the permanent doctors are left with a majority of the work including all of the on-call tasks. These tasks include dealing with patient requests that come through to the receptionist such as booking appointments, patient referrals, prescribing medication and issuing sick notes. We aim to identify the prevalence of specific tasks and evaluate ways to reduce the tasks performed by the doctor. We intend to analyse the number of prescribed acute medication that can be placed on a repeat or variable repeat prescription.
METHODS
Data was collected from a single NHS England GP Centre. This centre utilizes the Egton Medical Information Systems (EMIS) web platform for recording consultations, tracking investigation results, prescribing medications, and communicating within the practice.6 Using EMIS, we collected all the tasks of the on-call doctor for a single month. In this month, there were no school or public holidays. These tasks are sent to the on-call doctor from the receptionist who receives them directly from patients. At this centre, all tasks from 2pm on a particular day form part of the following days’ workload. Therefore, the tasks of each day were recorded from 2pm the previous day until 2pm that day.
We separated tasks by allocating them into 1 of 5 categories: medication request; request for appointment, advice, or test results; request for a referral; request for sick note; and other which included all miscellaneous tasks.
RESULTS
Total task distribution
A total of 969 tasks were performed in the month. The proportion of tasks over 4 weeks was as follows: week 1 had 26.7% (n=259) of the total tasks; week 2 had 25.6% (n=248); week 3 had 25.1% (n=243); and week 4 had 22.5% (n=218).
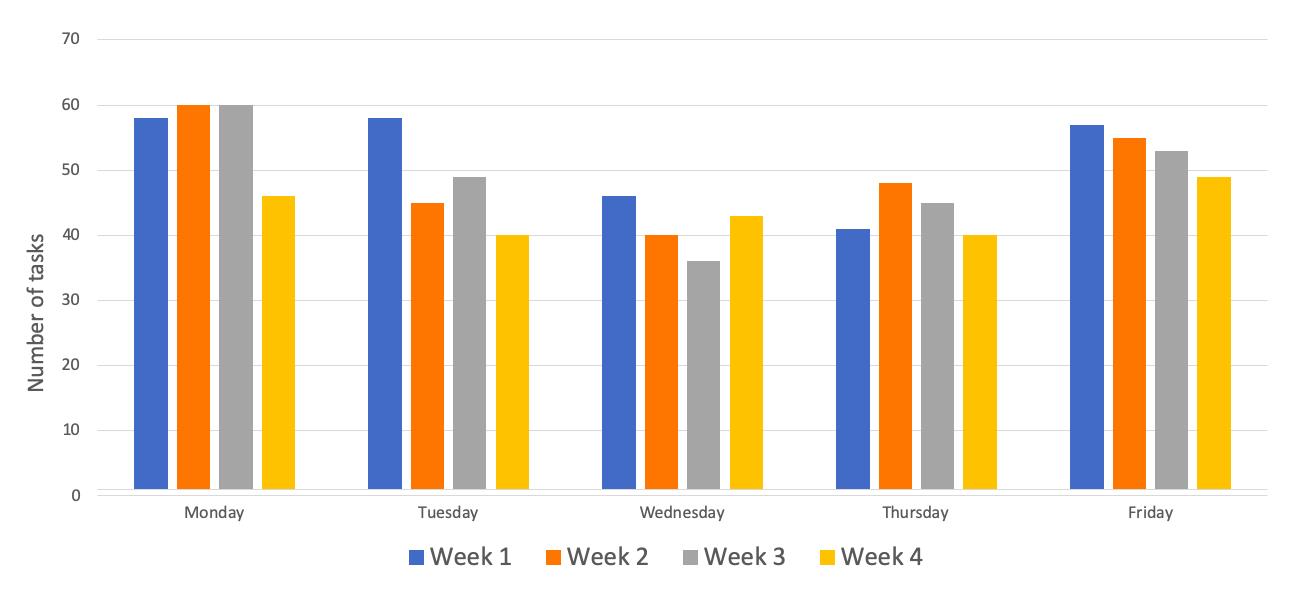
Figure 1: Total number (n) of tasks per day across each week for the four weeks of the month
Further to this, regarding the proportion of tasks over the days of the week: Monday had 23.1% (n=224) of the total tasks; Tuesday had 19.8% (n=192); Wednesday had 17.0% (n=165); Thursday had 18.0% (n=174); and Friday had 22.1% (n=214). Figures 1 and 2 show the number and percentage of task distribution respectively across the days and weeks for the month.
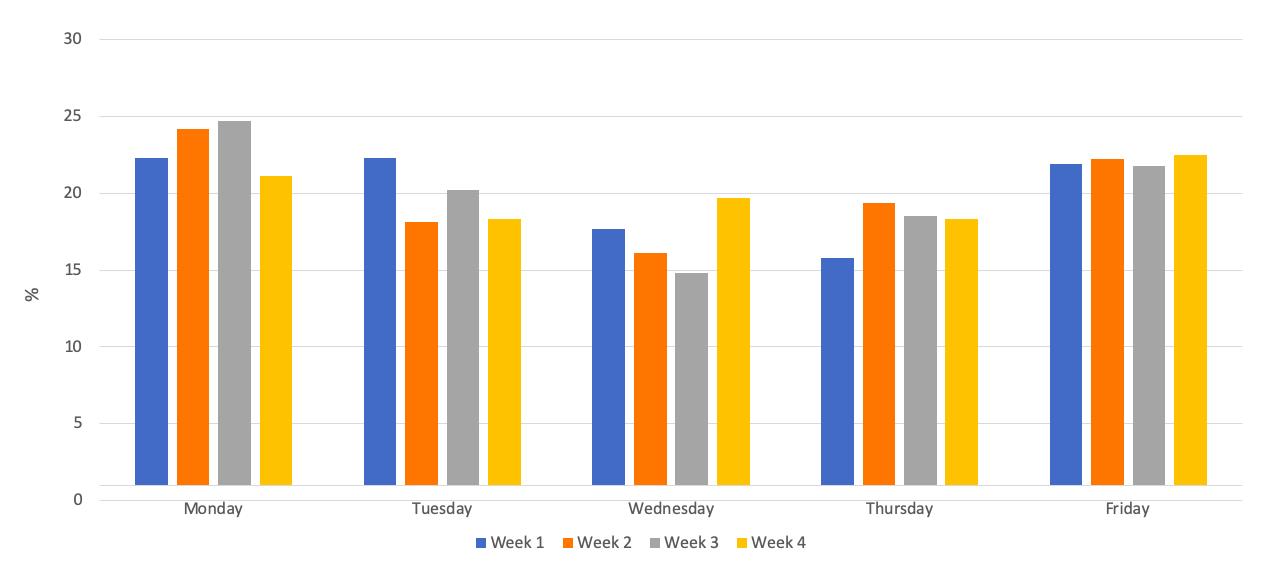
Figure 2: Percentage (%) of task distribution per day-of-the-week across each week for the four weeks of the month.
Type of task
The tasks for the month were separated unevenly across the five categories: medication tasks were 50.9% (n=493) of the total tasks; requests for appointments, results and advice were 35.9% (n=348) of the total tasks; referrals were 2.4% (n=24) of the total tasks; sick note were 4.6% (n=45) of the total tasks; and other tasks made up the remaining 6.1% (n=59) of the month. Figure 3 shows the distribution of tasks for the month.
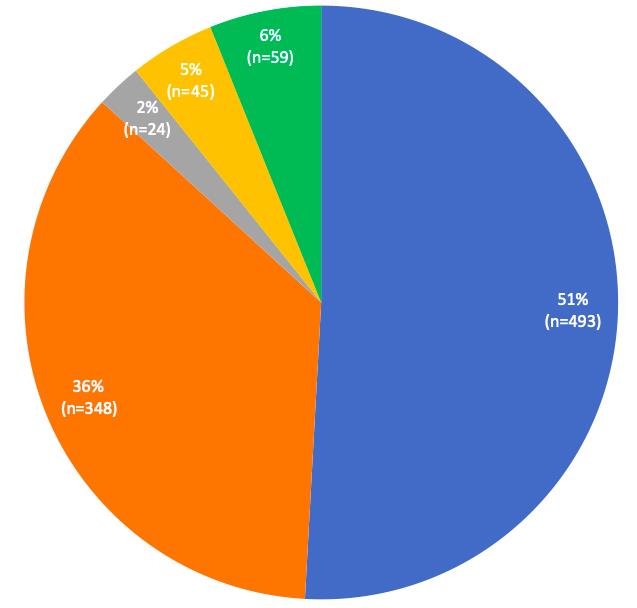
Figure 3: Distribution of tasks/requests according to task-type for the month (total tasks n=969).
We recorded the type of tasks completed per week. Figure 4 shows the distribution of tasks according to task-type for weeks 1, 2, 3, and 4, respectively. Of the total 260 tasks recorded for week 1, 55.8% (n=145) were tasks involving medication; followed by 29.2% (n=76) request for appointments, results and advice; referrals made up 4.2% (n=11); sick notes were 7.3% (n=19); and miscellaneous tasks came to 3.5% (n=9).
The second week had a total of 248 tasks. Of these, 51.6% (n=128) were medication tasks; 34.7% (n=86) were requests for appointments, results and advice; referrals made up 2.4% (n=6); sick notes made up 2.8% (n=7); and miscellaneous tasks were 8.5% (n=21).
The third week had a total of 243 tasks. Of these, 44.4% (n=108) were medication tasks; 45.7% (n=111) were requests for appointments, results and advice; referrals made up 1.2% (n=3); sick notes made up 3.3% (n=8); and miscellaneous tasks were 5.3% (n=13).
The fourth week had a total of 218 tasks. Of these, 51.4% (n=112) were medication tasks; 34.4% (n=75) were requests for appointments, results and advice; referrals made up 2.8% (n=6); sick notes made up 5.0% (n=11); and miscellaneous tasks were 6.4% (n=14).
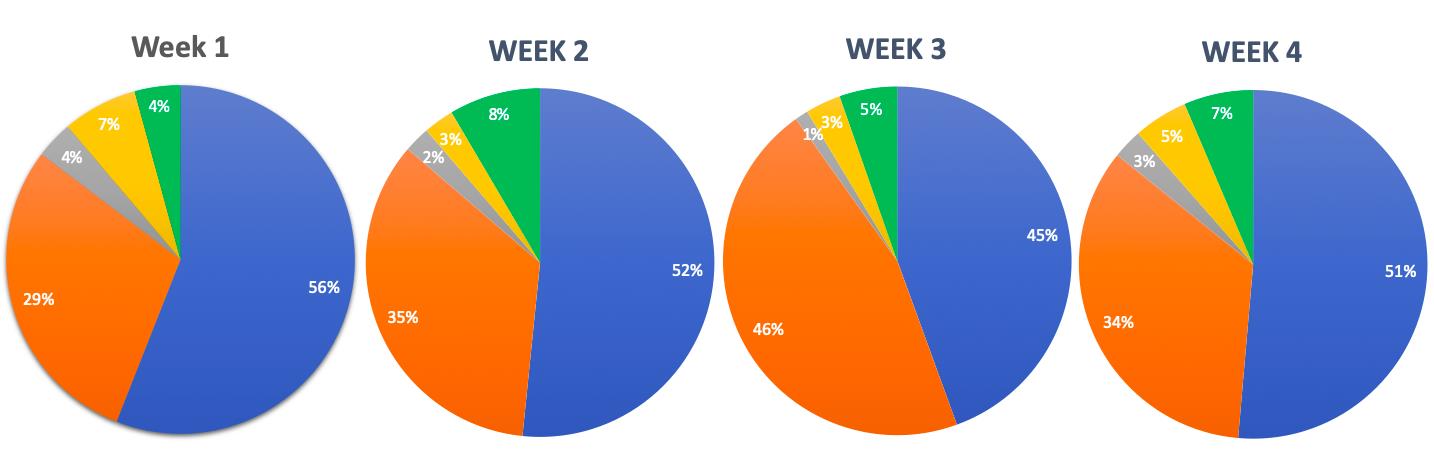
Figure 4: Comparison of distribution of tasks/requests according to task-type for week 1, 2, 3, and 4, respectively.
Medication tasks
Focusing on the medication category, we had a look at whether medication requests sent to the on-call doctor were drug prescriptions that should have been on a repeat/variable repeat prescription rather than on acute. Out of a total 493 medication tasks for the month, 49.1% (n=242) medication requests could have been on repeat prescription rather than being acutely prescribed. A further analysis of this data yielded comparable findings per week. In the first week, there were 145 total medication tasks, about 50.3% (n=73) of drug prescriptions could have been on repeat. In the second week, out of 128 medications, 46.1% (n=59) of medication could have been on a repeat or variable repeat prescription. In the third week, out of 108 medications, 39.8% (n=43) of drug prescriptions could have been on a repeat or variable repeat prescription. In the fourth week, out of 112 medications, 59.8% (n=67) could have been on a variable repeat or repeat prescription. Table 1 represents the total number of medication tasks that could have been on repeat or variable repeat prescription per day. Figure 5 represents the percentage of medication tasks that were on acute prescription but could have been on repeat or variable repeat prescription across each week.
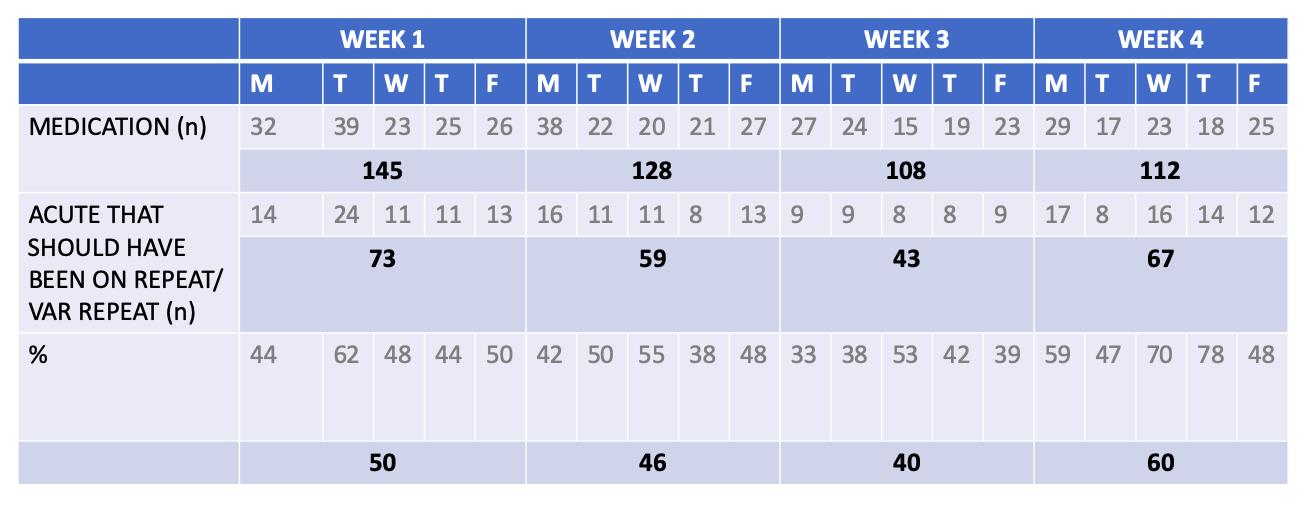
Table 1: Total medication tasks that could have been on repeat or variable repeat prescription, per day across each week for the four weeks of the month.
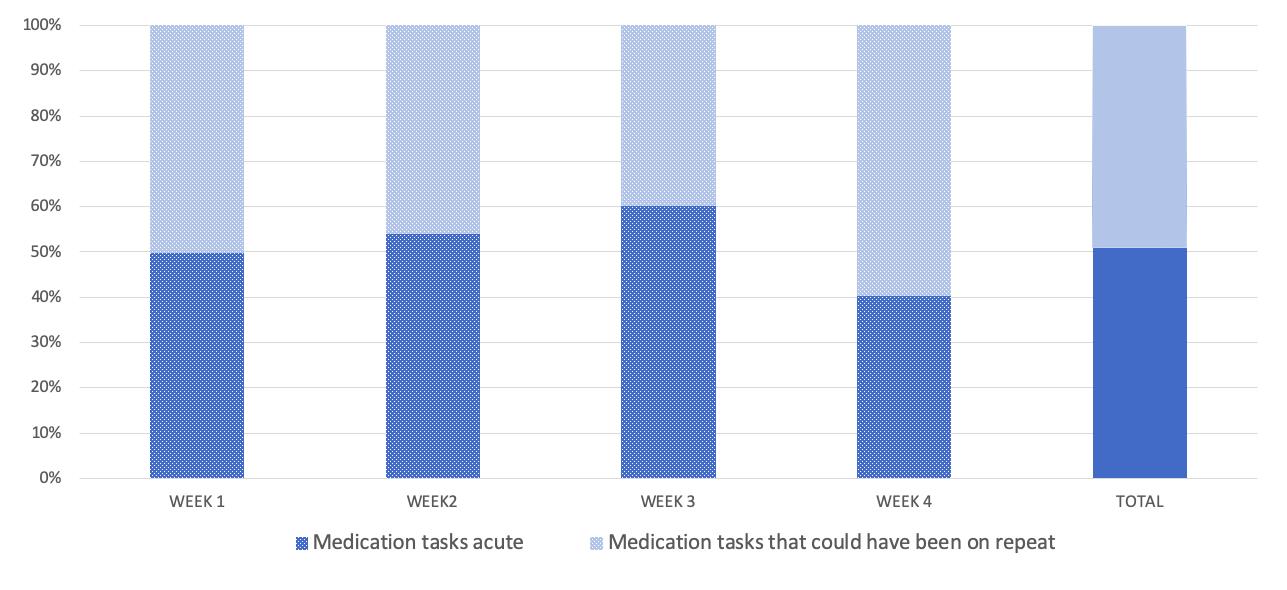
Figure 5: Percentage (%) of medication tasks that could have been on repeat or variable repeat prescription, across each week for the four weeks of the month.
DISCUSSION
SUMMARY
The total number of tasks did not differ significantly day-to-day: each day per week (Monday-Friday) held about 15-25% of the total weeks’ tasks. The medication requests contributed to the majority of the total tasks (50.9%); followed by requests for appointments, results and advice (35.9%). Upon further analysis of the medication category, 10-25 medication tasks per day could have been avoided by having certain drugs on repeat prescription rather than being acutely prescribed. Taking into account that a GP would typically spend 2 minutes per task, this could save 20-50 minutes per day, which amount to 100-250 minutes per week, and 400-1000 minutes or 6.5-16 hours per month.
The drug prescriptions that we thought should have been on repeat or variable repeat prescription, rather than on acute prescription, included requests for drugs that patients typically take long-term. This included Proton Pump Inhibitors (PPIs) such as Omeprazole, statins such as Simvastatin, and Angiotensin Converting Enzyme Inhibitors (ACEIs) such as Ramipril. These are for chronic conditions such as gastric reflux, hypercholesterolemia, and hypertension, respectively. Other drugs that we considered would be more feasible if put on repeat or variable repeat prescription were those for palliative patients in care homes that require a constant need for laxatives such as Senna or Lactulose, or drugs such as Paracetamol. These are for constipation or pain management, respectively.
The medication requests that could not have been on repeat or variable repeat prior to the request being sent were drugs that were required acutely, such as for short-lived infection, transient pain relief, changing of drug doses, and prescribing of alternative drugs due to a possible manufacturing problem or unavailability from the pharmacy. These are tasks that we deem necessary to be sent to the GP so that drug doses are changed based on clinical judgement, and not merely on a request sent to the receptionist. This upholds a standard of drug-control and patient safety within the practice.
STRENGTHS & LIMITATIONS
This retrospective study provides an in-depth analysis of the on-call doctors’ day-to-day tasks in terms of the nature and number of tasks. This is a study involving a large number of tasks collected from a month in a single GP surgery which has produced significant results. As non-GPs collected all the data, including data in the medication category, this eliminated bias in reporting acute medication that could have been prescribed as repeat or variable repeat medication. Limitations include the sample size being considered as a relatively small number which cannot be representative of all on-call GPs’ tasks in the rest of England. In addition, this study took place in the month of September and the tasks can be distinctly different when looking into other months.
COMPARISON WITH EXISTING LITERATURE
To date, the existing literature that looks at GP tasks from this perspective is limited. Most studies look at the receptionists’ role in handling patient requests or focus on scrutinizing the technology that GPs rely on to issue repeat or variable repeat prescriptions.
Our study included the number of tasks completed in a single month as well the stratification of tasks done within the month. We separated our results week per week to see if there were any differences between them. In 2014, a quantitative analysis of incoming calls into three GP surgeries described basic numbers of calls and type of patient enquiries that came into the practice. They had received a total of 2,780 calls and found that the most dominant type of request was making a doctor’s appointment. The main finding in the study is that it identifies an aspect of non-effective communication in GP receptionists’ encounters with patients. It describes how some receptionists failed to meet the initial requests of the patient by directing the telephone call forward or even closing calls prematurely before understanding the problem. This increased ‘patient burden’ and lead to lower patient satisfaction score when recorded. Effective receptionists understood and summarized the patients’ requests as well as making alternative actions to help the patients enquiry.7
Repeat prescriptions are defined as those that are printed by a practice computer from its repeat prescribing program8. In the UK, repeat prescriptions account for up to three quarters of all drugs prescribed, and four fifths of drug costs in General Practice.9,10 Repeat prescriptions are mostly done as a technology-supported practice that requires collaboration between clinical and administrative staff to ensure patient safety.11 Two conflicting opinions exist around repeat prescribing: the first is that the increased automation aids in improving safety; the second is that the process as a whole may be weakened if assumptions built into the technology do not take full account of the nature of healthcare work such as real life demands like time, space, and resource constraints.11,12 It is important that the GPs at our practice are aware of the risks involved in potentially putting more drugs onto repeat prescription, and consequently monitor this closely.
IMPLICATIONS FOR RESEARCH AND/OR PRACTICE
The findings collected in our study demonstrate the increasingly demanding role of the on-call GP outside of consultation hours. According to recent surveys, the GP occupation has had its lowest job satisfaction since 2001 because of a higher workload which indirectly lowers quality of patient care and increases negative patient experiences.13,14 This should be taken with paramount importance, as this can cause harm to both patients and GPs. As results have described the huge number of tasks, it is important to find a way to avoid unnecessary tasks telephoned into the GP surgery. The results of our study were presented to all of the staff in the practice and the underlying message was well received. Medications that are prescribed by the doctors are double checked by the Clinical Commissioning Group pharmacist in the practice to ensure that drugs are safely given to patients.
CONCLUSION
As the funding formula has changed in the last decade, the government budget into the NHS primary care has decreased more than in secondary care even with the ever-growing pressures on primary care services.13 Some strategies, such as telephone triage, have been introduced at the practice to reduce workload crisis. However recent evidence has shown this is not effective.15 In 2015, the primary care workforce commission laid out recommendations to restructure primary care services as the current model for primary care was under doubt. The underlying message in the report was that continuity of care was important for the majority of GPs - the GPs understood patients better when they had been under their care for many years.16 With this, extra tasks can be avoided if GPs know their patients well. At a glance of primary care, from literature and our findings, it seems that General Practice may follow an unsustainable path. The pressures of workload include increasing patient lists, higher public expectations and growing bureaucracy.17 Our data collection has proven that there are a lot of tasks to be done in a month by an on-call doctor, however the amount of time that could be saved by prescribing repeat or variable repeat rather than acute medication can save significant time. From our positive results in the medication task section, we hope this can inspire further research into other areas of the GP surgery that can help optimize the time of the doctors. Furthermore, we would like to repeat our retrospective study in one year’s time with the suggestion implemented (appropriate acute medications changed to repeat or variable repeat prescriptions) over a longer period of time. With limitations corrected for, we want to re-analyse the number and type of tasks completed to determine whether this has truly optimized the time of the overworked on-call doctor.
|
Acknowledgements We would like to thank White Rose Medical Practice for allowing us access to their web platform to gather the data. Competing Interests None declared Author Details DR GAURAV PYDISETTY, BSC M.D.,University of Nicosia Medical School,93 Agiou Nikolaou Street, Engomi,2408,Nicosia, Cyprus. DR MEHRBAN GHANI, MBChB DFFP MRCGP, White Rose Medical Practice, Carlton Street, Cudworth, Barnsley S72 8SU, UK. DR ATHENA MICHAELIDES, BSC M.D. , University of Nicosia Medical School,93 Agiou Nikolaou Street, Engomi,2408,Nicosia, Cyprus. CORRESPONDENCE: DR GAURAV PYDISETTY, BSC M.D., UNIVERSITY OF NICOSIA MEDICAL SCHOOL, 93 AGIOU NIKOLAOU STREET, ENGOMI,2408,NICOSIA,CYPRUS. Email: gpydisetty@gmail.com |
References
- Fisher RFR, Croxson CHD, Ashdown HF, Hobbs FDR. (2017). GP views on strategies to cope with increasing workload: a qualitative interview study. Br J Gen Pract. 1;67(655):e148 LP-e156.
- Owen K, Hopkins T, Shortland T, Dale J. (2019). GP retention in the UK: a worsening crisis. Findings from a cross-sectional survey. BMJ Open 1;9(2):e026048.
- Pulse today, [Internet] Number of registered patients per GP rises to almost 2,100 [updated 2019 July 11; cited 2019 Dec 10] Available from: http://www.pulsetoday.co.uk/news/all-news/number-of-registered-patients-per-gp-rises-to-almost-2100/20039037.article
- www.uswitch.com [Internet]. uSwitch, Inc. [updated 2015 October 22; cited 2019 Dec 10]. Available from: https://www.uswitch.com/place-to-live/
- Marchand C, Peckham S. (2017). Addressing the crisis of GP recruitment and retention: a systematic review. Br J Gen Pract. 67(657):e227–e237.
- Fisher B. (2011). Patient record access: making it work for you and the NHS. London Journal of Primary Care. 2011;4:43-8.
- Stokoe E, Sikveland RO, Symonds J. (2016). Calling the GP surgery: patient burden, patient satisfaction, and implications for training. Br J Gen Pract. 1;66(652):e779 LP-e785.
- Harris CM, and Dajda R. (1996). The scale of repeat prescribing. British Journal of General Practice. 1996,46:649-653.
- De Smet PAGM, and Dautzenburg M. (2004). Repeat Prescribing: Scale, Problems and Quality Management in Ambulatory Care Patients. Drugs 64(16):1779-1800.
- The National Audit Office. (2007). Prescribing costs in primary care. Stationery Office.
- Swinglehurst D, Greenhalgh T, Russell J, and Myall M. (2011). Receptionist input to quality and safety in repeat prescribing in UK general practice: ethnographic case study. BMJ 2011;343:d6788. doi:10/1136/bmj.d6788.
- Ash J, Berg M, and Coiera E. (2004). Some unintended Consequences of Information Technology in Health Care: The Nature of Patient Care Information System-related Errors. J Am Med Inform Assoc. 11:104-112.
- Croxson CHD, Ashdown HF, Hobbs FDR. (2017). GPs’ perceptions of workload in England: a qualitative interview study. Br J Gen Pract 1;67(655):e138 LP-e147.
- British Medical Association. (2015). National survey of GPs: the future of general practice 2015. http://bma.org.uk/working-for-change/negotiating-for-theprofession/bma-general-practitioners-committee/surveys/future-of-generalpractice (accessed 24 Nov 2019).
- Campbell JL, Fletcher E, Britten N, et al. (2014). Telephone triage for management of same-day consultation requests in general practice (the ESTEEM trial): a cluster-randomised controlled trial and cost-consequence analysis. Lancet. 384(9957): 1859–1868.
- Primary Care Workforce Commission. (2015). The future of primary care: creating teams for tomorrow. https://www.hee.nhs.uk/sites/default/files/ documents/WES_The-future-of-primary-care.pdf (accessed 23 Nov 2019).
- Paddison C, Abel G, Campbell J. (2018). GPs: working harder than ever. Br J Gen Pract.1;68(670):218 LP-219.

The above article is licensed under a Creative Commons Attribution-NonCommercial-NoDerivatives 4.0 International License.