Insomnia is a disturbance of normal sleep patterns. It is characterised by sleep onset latency and/or sleep maintenance. Short term insomnia is defined as having symptoms for less than four weeks, whilst long term insomnia is symptoms lasting more than four weeks1. Hypnotics can provide relief from the symptoms of insomnia; they do not treat any underlying cause.
Several hypnotic agents are licensed for the treatment of insomnia, including the benzodiazepines and Non-benzodiazepine hypnotics (Z-drugs)2.
NICE guidance for Insomnia management states “After consideration of the use of non-pharmacological measures, hypnotic drug therapy is considered appropriate for the management of severe insomnia interfering with normal daily life; it is recommended that hypnotics should be prescribed for short periods of time only, in strict accordance with their licensed indications” 1.
NICE guidance also advises to use the lowest effective dose of the hypnotic agent for the shortest time frame possible. The exact duration will depend on the underlying cause, but treatment should not continue for longer than two weeks. We should also inform the patient that further prescriptions for hypnotics will not usually be given, ensure that the reasons for this are understood, and document this information in the patient’s notes.
Side effects are common with hypnotic usage including, most importantly, the development of tolerance and rebound insomnia. Other side effects can occur such as daytime sedation, poor motor coordination, cognitive impairment, hallucinations, anxiety, delusions and sleep disorders2.
Aims
To reduce the amount of hypnotic medication being prescribed to patients on an Acute Inpatient psychiatric ward in the Northwest of UK. The ward is in a semirural psychiatric hospital and is a Male ward containing 17 inpatient beds. The patients are 18 years old onwards with varying diagnosis including Generalised Anxiety Disorder, Bipolar Affective Disorder, Schizophrenia, Depression, and patients with mental and behavioural disorders due to psychoactive substance use.
The reason for doing this project was most importantly for improving patient safety by reducing unnecessary prescriptions and therefore administration of hypnotic medications, but also to reduce NHS expenditure and carbon footprint.
Inclusion criteria
Patients who have been an inpatient on the selected ward between the 09/12/2020-20/01/202 and 28/01/2020-10/03/2020.
Intervention
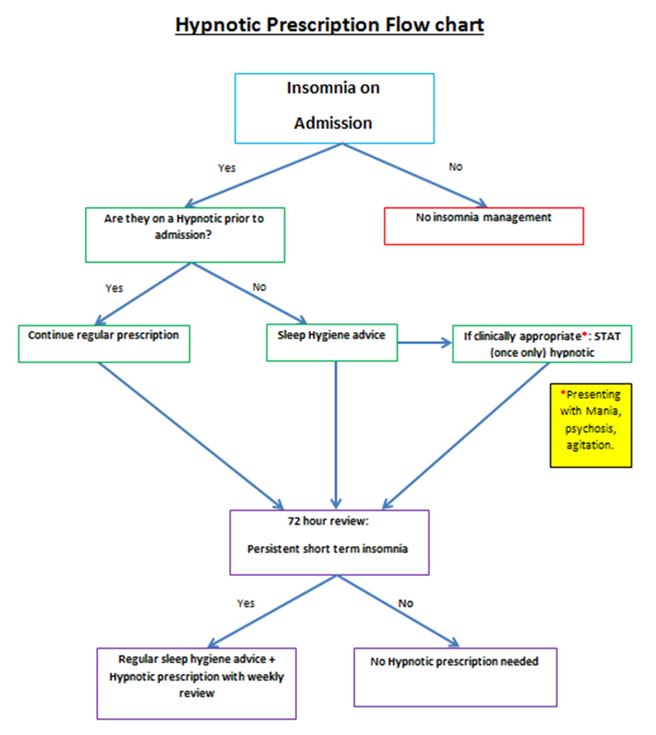
We developed a prescription aid flow chart (Appendix 1) for all newly admitted patients to the ward. This will guide doctors when making the decision if a hypnotic prescription is warranted.
All patients on the ward during this intervention period, who are currently on a hypnotic agent and are not newly admitted, will have their hypnotic prescription reviewed using the flow chart (Appendix 1) at their weekly consultant ward round.
We then decided on some interventions to fulfil our aims. The interventions were as follows:
1) Development of an educational presentation about Insomnia and sleep management.
2) Development of an Insomnia management Flow chart (Appendix 1) to be used at admission point.
3) Training sessions for ward staff.
4) Shared teaching programme with patients at their sleep management sessions.
5) Face to face and E-mail correspondence to inform medical trainees about this project.
6) Gather feedback from ward patients and staff before and after this project.
The Hypnotic prescription flow chart aid (Appendix 1), has been put on the ward office notice board, the clinic room and the On Call Doctors Room. It was also e-mailed out to the regular ward doctors, as well as all on-call doctors working during the intervention period.
As discussed above, we created an educational PowerPoint presentation entitled “Insomnia and hypnotic agents”. This included insomnia definitions and types, NICE guidance on insomnia, sleep hygiene advice, the medications used for insomnia, their mode of actions, side effects, cautions and cost of these medications. We also included our new hypnotic prescription flow chart aid (Appendix 1).
From the 21/01/2020-27/01/2020 we had two of these educational training sessions. This was to ensure that all staff working on this ward attended at least one of these sessions. Staff in attendance included the ward managers, nursing staff, health care assistants, the pharmacist, a junior doctor, and the ward consultant. This was very important as all these health care professionals are involved with the management of patients on the ward, and those suffering from insomnia. We felt that this session was vital as we wanted to ensure that all the staff knew the importance of this project and could raise their own concerns and issues that they have with regards to managing patients with insomnia. This proved to be very useful as we all brainstormed and voiced some realistic ward changes that could happen on an inpatient psychiatric ward. We also acknowledged that sleeping on the ward as an inpatient can often be disturbed, due to regular nursing checks and noise from the staff and other patients. We did however discuss some feasible interventions which included:
1) The time at which all the automatic ward lights are turned on in the morning could be delayed.
2) Caffeine –free coffee/tea available only after a particular time in the evening.
3) Discourage daytime napping.
4) Have regular sleep-hygiene sessions on the ward.
Between 28/01/2020 to the 10/03/2020 we started these interventions, and this is the time period for collection of our next six weeks of data. We had multiple patient group sessions on sleep hygiene during this time led by the occupational therapist. Other health professionals assisted with this, including the ward pharmacist and the junior doctor. During these sessions we asked for patients to give their feedback on the current management of insomnia on the ward. Some responses included:
· One patient with Severe Generalised Anxiety Disorder stated that he feels that the sleep hygiene advice is helpful, as he doesn’t like to “jump straight into taking tablets” and likes to “fix the root” of his sleeping problem.
· A second patient with a diagnosis of Mental and Behavioural Disorder due to use of cannabinoids, stated that he needs both sleeping medications and sleep hygiene advice, as sometimes he still cannot get to sleep on the ward by solely using relaxation methods.
· A third patient with Generalised Anxiety Disorder stated that he found the sleep hygiene sessions useful. He is now using relaxation methods and is trying to avoid daytime naps which are both helping with his sleep. However, he still on occasions struggles with sleep. He said it is important to have a tidy, clean and relaxing sleeping environment, which is sometimes difficult to implement on the ward.
Appendix 1
Results:
Data was collected prior to any intervention on the ward between the dates 09/12/2020 and 20/01/2020.
The table below (Table No.1) includes the type and number of sleeping tablets prescribed on the ward between the dates 09/12/2020 and 20/01/2020. The total number of patients treated from 9 December 2019 to 20 January 2020 were 28 and the total number of patients were prescribed hypnotic medication during this time were 14.
Table No.1 - Hypnotic medication prescribed:
Name
dose
Number of tablets
Zopiclone
7.5mg
191
Zopiclone
3.75mg
12
Zolpidem
10mg
4
Nitrazepam
5mg
7
Temazepam
10mg
10
The table below (Table No.2) includes the number of hypnotics prescribed and administered after the interventions mentioned above. The total number of patients treated from 28 January 2020 to 10 March 2020 were 25 and the total number of patients who had prescribed hypnotic medication were 11.
Table No. 2- Hypnotic medication prescribed:
Name
dose
Number of tablets
Zopiclone
7.5mg
96
Zopiclone
3.75mg
6
Zolpidem
10mg
0
Nitrazepam
5mg
0
Temazepam
10mg
0
With our ward interventions we have significantly reduced the amount of hypnotic tablets being administered. The total number of tablets administered during this 6 week period was 102. The total number of patients who were prescribed hypnotics was 11. Prior to our interventions the total number of tablets administered between 9th December 2019 and 20th January 2020 was 224 and 14 patients in total were treated. This demonstrates a 44.5% reduction in tablets which is significant.
Discussion
The total reduction in tablet administration was very significant with a 44.5% reduction post-intervention. This demonstrates the positive change in our clinical practice that has resulted from using the flow chart aid (Appendix 1) as well as patient and staff educational and feedback sessions. This will improve patient safety by reducing the risk of side effects. The risk of patients developing tolerance to hypnotic medications has been reduced, as well as reducing those being discharged on a regular prescription which will further improve long term expenditure of hypnotic medications for the NHS. With the changes that have occurred in our clinical practice, we have reduced the number of hypnotics being unnecessarily prescribed and administered.
Over prescribing/unnecessary prescribing is an issue within the NHS and is impacting negatively on the environment. The NHS constitution states that the NHS is ‘committed to providing the most effective, fair and sustainable use of finite resources’3. By reducing the number of inpatients being unnecessarily started on hypnotic medications, another positive from this project will be the reduction in the negative pharmaceutical impact on the environment. The number patients being discharged with hypnotic medications, who may no longer need them, due to their insomnia improving when they are discharged from the inpatient setting will also improve. Furthermore, if they are unnecessarily started on a hypnotic prescription as an inpatient, they may continue this prescription regularly and become tolerant, which will inevitably have an undesirable effect on the environment.
The feedback that we received from the educational insomnia teaching sessions also proved to be very useful. As stated above the staff sessions allowed us to brainstorm simple ward-based interventions, as well as discussing possible drawbacks which may result. This allowed us to modify the flow chart so that it worked for all staff effectively.
The feedback given from patients was also very encouraging. As health professionals we sometimes overlook how some patients want and need more involvement in making decisions on aspects of their care. Ensuring patients are informed about medications prior to prescribing, especially about side effects is something that is very important and allows patients to make informed decisions which is a more holistic approach to clinical practice. This is vitally important prior to prescribing any medications but especially medications with more severe side effects which some hypnotics have.
The patient educational sessions were a key part of this project. We gathered feedback and established that the patients involved found these sessions informative. Some, but not all, of the sleep hygiene advice was feasible to implement into their daily routine on the ward. The ward can be disruptive at night, due to other patients, or due to regular staff checks in patient rooms, as well as rooms not being familiar surroundings, were two of the difficulties raised from the patients. This is something that we appreciate can’t be changed, however with the interventions that can be feasibly made on the inpatient psychiatric ward, we continue to strive to implement and improve for patients. For these reasons both the staff and the patient educational sessions should be continued and proved a vital part of this project
Following on from this initial intervention, we feel that we can continue to make further changes and expand the changes we made on this ward, to other similar wards in our hospital and to other inpatient psychiatric wards in the Trust.
The Royal College of Psychiatrists and NICE Guidelines both stress the importance of carrying out physical examination on psychiatric in-patients due to their high level of physical health issues. Carrying out and carefully documenting these physical examinations at the time of admission allows physical health issues to be appropriately taken into account when creating management and medication plans and, in more severe cases, to allow diversion for medical treatment if that is required or the underlying cause of the presentation.
Monitoring physical health of patients in psychiatric settings is vital and is recommended by NICE in its guidelines; documentation of physical health assessment carried out at the right place is also imperative. According to Louth/Meath Mental Health Services Admission Policy, 2016, all psychiatric patients admitted should have their Physical Examination completed and recorded on Physical Examination Proforma.
Psychotropic medications can effect on physical health of psychiatric patients1. Patients with medical co-morbidities are more at risk from psychotropic medications compare to normal healthy population2. In addition, depression is considered as an independent risk factor for cardiac events in patients with coronary artery disease3. Adding that, depression may also possibly increase the risk of cardiovascular disease in population without medical co-morbidities. Hence, psychotropic medications are carefully chosen for treatment of individual patients to avoid any adverse events1. Depression is not the only risk factor for medical co-morbidities; other psychiatric problems also make patients vulnerable for physical health issues1. Moreover, prevalence of medical problems is relatively high in psychiatric patients compared to cohorts without mental health disorders4. The risk of medical co-morbidities do not always increase after prescribing psychotropic medications; the risk of cardiovascular disease also increases for patients suffering from anxiety and not necessarily using medications5.
Psychiatric patients receiving psychotropic medications should have their physical health monitored regularly as recommended by NICE6.
Methods
The audit cycle was completed in St Brigid’s Complex, Ardee. The audit cycle comprised initial audit (phase 1), implementing changes following recommendations and re-audit to compare results with initial audit. All patients in Unit 1, which is an acute admission ward, were included for the audit and re-audit. Patients admitted in another ward, which is a long stay ward, were excluded in the audit cycle. The rationale for not including patients admitted in long stay ward was that these cohorts of patients are already well established on psychotropic medications and their physical health is regularly monitored. Data collection was carried out from physical health proforma completed upon admission and filed in notes. No patient identifiable data was collected during the audit cycle.
During phase1, a review of the notes of all in-patients on a specific day in Unit 1, St Brigid’s Complex, Ardee was carried out. Data was collected from physical health proforma of each patient. This data was then entered in Xl-spread sheet for the analysis purpose. Results were analysed and feedback obtained from non-consultant hospital doctors. The findings were presented during local teaching to both the consultant and NCHD bodies and means of improving compliance were discussed openly. These discussions led to a redesign of the proforma to make it shorter and simpler to complete. This proforma was then attached to an assessment booklet, whereas physical health proforma was not part of an assessment booklet. A re-audit was carried out during a single day on all in-patients in Unit 1 several months after the first phase of the audit. In-patients who remained in Unit 1 since the initial phase of the audit were excluded from the re-audit.
Results
The results of initial audit demonstrated only 50% (10/20) compliance with physical health proforma. Furthermore, in phase 1 the proformas were only partially completed with elements of the physical exam documented on the proforma. In addition, other components were documented elsewhere in the admission notes and many elements omitted altogether. Only 15% (3/20) of the proformas contained a complete, documented physical examination.
One of the sections on proforma that lacked information significantly was information about patient’s current circumstances. On the other hand, demographic details were recorded for only 50% of patients. However, admitting doctor’s details were recorded on 35% (7/20) of proformas, the details of professional carrying out physical information was also not available on large number (19/20) of proformas.
Table 1:
Yes
No
Partial
Patient Demographics
10
10
0
Date & Time of Admission
6
11
3
Referral Agency
7
13
0
Admission Status
8
12
0
Drug Allergies
6
14
0
GP Details
7
13
0
NOK Details
3
17
0
Religion
1
19
0
Marital Status
2
18
0
No of Children
2
18
0
Occupation
2
18
0
Nationality
3
17
0
No of Previous Admissions
1
19
0
Medical Card No
0
20
0
V.H.I
0
20
0
Provisional Diagnosis
6
14
0
Admitting Doctor Name
7
13
0
Admitting Doctor Signature
7
13
0
General Examination
9
11
0
CVS
9
11
0
R.S
9
11
0
C.N.S
9
11
0
Alimentary System
6
14
0
G.U.S
3
17
0
L.M.P
1
19
0
Signature
1
19
0
Date
8
12
0
Data analysis of the re-audit shows that 80% (16/20) of the proformas were been completed. In overall, there was a huge improvement seen in the results of the re- audit and doctor’s details performing physical health was recorded on 75% of the proformas. Adding that, general examination section of the proforma demonstrated huge compliance of 80% along with Cardiovascular and Respiratory system.
Table 2:
Yes
% Yes
No
% No
Name
12
60%
8
40%
DOB
10
50%
10
50%
General Examination
16
80%
4
20%
CVS
15
75%
5
25%
R.S
15
75%
5
25%
C.N.S
14
70%
6
30%
Alimentary System
14
70%
6
30%
G.U.S
14
70%
6
30%
L.M.P
6
30%
14
70%
Signature
15
75%
5
25%
Date
15
75%
5
25%
Discussion
A total of 20 patients in each phase of the audit were included for data analysis. The number of patients included may seem small for a research study with a different design; however, quantitative number is not taken into account with this particular design used. On the other hand, number of patients admitted in any acute ward is similar.
During data collected, it was apparent that physical examination findings were recorded in the notes instead and proforma was not used for some of patients, which is evident through results. Even though physical examination may have been carried out, it was not possible to include in data analysis and results due to the study design.
The results of first phase demonstrated poor compliance with physical health proforma despite carrying out physical examinations and findings been recorded elsewhere in admission notes. It is an arguable fact that regardless of physical health proforma been filled, physical examination of patients are been carried out as per local and NICE guidelines. However, physical examinations documented elsewhere in the admission notes makes it difficult to locate; hence, a proforma is completed upon admission as a pre agreed standard procedure.
Once the results of initial audit were analysed, these results were presented in the local academic session to all the NCHDs and Consultant Psychiatrists. While all involved agreed the importance of carrying out physical examination on all patients upon admission; the design and complex nature of the initial proforma made very difficult for NCHDs to complete it. Adding that, some of the information, such as demographic details and personal information, was also repeated making it duplicate that had been recorded elsewhere in the notes. The physical health proforma was then redesigned and simplified to complete. Unnecessary and duplicate information was omitted in the new proforma and was attached with the initial psychiatric assessment booklet. The new physical health proforma was then implemented in the service after discussions with fellow NCHDs, Consultants and management.
Second phase of the audit cycle was conducted after number of months and redesigned physical health proforma been in circulation for some time. Data was again collected as per study design and methods and entered for analysis. These results demonstrated a huge improvement in compliance with physical health proforma after the change of practice. Although compliance with proforma has improved significantly, some gaps were noted to reach the desired outcome of 100% in practice. Case notes were studied to understand the reasons for not completing physical health proformas. Several themes emerged through case note reviews and one of the reasons was assumed that patient was transferred from medical ward of General Hospital after been medically cleared. Time and mode of admission also resulted in physical health proforma not been completed.
Conclusion
While all involved agreed that carrying out physical examination on all admissions was advisable; the length and complexity of the initial proforma contributed to poor completion rates by NCHDs. A combination of teaching to underline its importance and a redesign focused on usability and speed led to significantly increased completion of the proforma with attendant benefits for patient assessment and treatment.
Acute upper gastrointestinal bleeding presenting as either hematemesis or melena or both is an important medical emergency. The etiological spectrum of upper gastrointestinal bleeding (UGIB) varies from region to region1. Various endoscopic therapy for patients with signs of recent haemorrhage in peptic ulcer have changed the outlook of UGIB management. An addition of proton pump therapy to non-variceal UGIB has further reduced hospital stay, recurrent bleeding and need for surgery2. Another milestone in the decline of UGIB has been eradication of H pylori. Globally, the prevalence of H. Pylori infection has decreased due to better hygiene, early diagnosis and eradication3. These factors have contributed to the changing trends in UGIB. The patients with UGIB have 50% incidence of H. pylori infection positivity and re-bleeding occurs in 7-16 % of the total cases1. Once frequent UGIB due to peptic ulcer have now declined all over the globe as demonstrated by various researchers 4,5,6. Unfortunately, despite advancement in endoscopic and pharmacological treatment, the mortality in UGI bleeding ranges between 3 and 14%7. Particularly, patients with UGI bleeding due to the duodenal ulcer are known to be more prone to death as demonstrated by Quan et al8. The advanced age and patients admitted in hospital with comorbidity are at an increased risk of re-bleeding and mortality. Re-bleeding and mortality rates are higher among patients with variceal bleeds and invariably 50-60% of patients with cirrhosis have variceal bleeding1. This warrants a careful approach in the management of UGI bleed. To predict the re-bleeding rates in a given case of UGI bleeding various clinical and endoscopic models have been developed from time to time. Of these – Rockall score, combining clinical (Age, shock, presence of co-morbid diseases) and endoscopic findings have proved quite valuable in the prediction of hospital admission duration and mortality rate9. The reason for the feasibility of Rockall score is that it depends mainly on simple clinical data and after an endoscopic procedure the score becomes more practical 9. The Rockall score divides patients into 4 subgroups according to their clinical data to estimate death and re-bleeding tendency. While comparing Rockall score, Blatchford scores at first assessment, and the Addenbrooke score it was concluded that Rockall score has an accuracy of 98% in predicting death, and was sensitive in 86.4% of cases in predicting re-bleeding10. Hence we calculated Rockall score in our study cohort and assessed various prognostic factors including changing trends over the past decades.
Methods
Study design
This retrospective study was conducted from January 2015 to December 2017 at King Abdul Aziz Specialist hospital Taif, a tertiary care centre in the western region of Saudi Arabia. The data was collected from case files and electronic medical records. The data about age, comorbid diseases, presence of shock, endoscopic intervention, hospital stay duration, the requirement for blood transfusion, surgery were collected to measure the outcome of UGI bleeding.
Depending upon hemodynamic status upper GI bleeding patients were managed either in the intensive care unit (ICU) or high dependency unit of the hospital. Blood transfusion had been given to maintain Hb levels above 8gm/dl. Platelets transfusions if the platelet counts were < 70,000 and fresh frozen plasma when INR was deranged in chronic liver disease patients.
The recurrent bleeding was defined by hematemesis, melena, or both, with either shock
(pulse rate>100 beats/min, systolic blood pressure< 100mmHg accompanied by cold sweats, pallor, oliguria) or a decrease in haemoglobin concentration of 2 g/dL over 24 hours.
Re-endoscopy, if needed, was used only to confirm recurrent bleeding.
The timing of UGI endoscopy after admission was recorded in each patient. The details of stigmata of recent haemorrhage (spurting vessels, active bleeding in an ulcer, a visible vessel, or a clot over the ulcer that could not be dislodged upon gentle washing with water delivered through the endoscope channel). Rockall score was calculated in all patients.
Patients with variceal bleeding were primarily managed with octreotide infusion ,antibiotics and endoscopic variceal ligation (EVL) or endoscopic sclerotherapy (EST) depending upon the situation. All patients were followed for rebleeding clinically and by haemoglobin levels during their hospital stay. Patients who remained hemodynamically stable for 72 hours were discharged.
After the fifth day, patients positive for H. pylori on CLO test during endoscopy received triple therapy (Capsule Amoxicillin 1gm twice daily and Tab. Clarithromycin 500 mg twice daily for 2 weeks. Tab. Es omeprazole 20mgdaily twice daily was continued for 4weeks. The patients who were H. pylori-negative received Tab. Esomeprazole 20 mg twice daily for 4 weeks.
Inclusion criteria:
Patients with confirmed upper GI bleeding (variceal and non-variceal) were enrolled in this study.
The variceal bleeding due to portal hypertension included both cirrhotic & non-cirrhotic patients.
Exclusion criteria:
Patients with terminal cancer.
Patients with upper GI bleeding where endoscopy had not been done due to any reason and Rockall score could not be calculated.
Patients with persistent shock necessitating emergency surgery, as a life-saving procedure.
Statistical methodology:
Data were statistically described in terms of frequencies (number of cases) and valid percentages for categorical variables. Mean and the standard deviation was used to describe parametric numerical variables while the median and inter-quartile range were used for non-parametric variables. Spearman's rho test was used for testing the correlation between the non-parametric numerical variable (Rockall score) and patients’ age. All statistical calculations were done using computer program IBM SPSS (Statistical Package for the Social Science; IBM Corp, Armonk, NY, USA) release 21 for Microsoft Windows.
Results
A total of 120 participants (76 males,63.3%) with a mean± SD age of 58. 4± 18. 7 years, were included in this study. The Rockall score showed a median (IQR) value of 3 which indicates a low to moderate risk of bleeding recurrence and death.
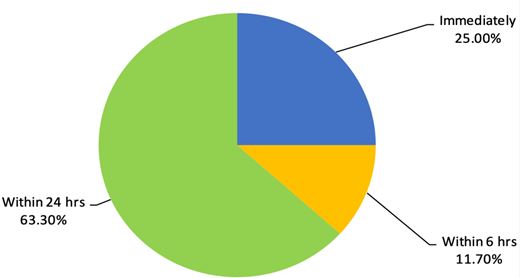
Majority of the study cohort [n=88(74%)] were Saudi nationals and [32(6.7%)] patients were from other nations. All patients had received an initial resuscitation as per the UGIB protocol of the hospital. Of 120 patients, 30 patients (25%) had undergone endoscopy immediately after admission in the intensive care of the hospital due to hemodynamic instability. Fourteen patients (11.7%) had undergone endoscopy within 6 hours of hospital admission and 63% patients had undergone endoscopy within 24 hours of hospital admission. The details are shown in figure 1.
The Rockall score was calculated for all patients based on their age, presence of shock, comorbidities, diagnosis and major stigmata of recent haemorrhage. The details are shown in table 1.
Table 1: Parameters of Rockall score in the non-variceal bleeds
Percentage
Frequency
Category
Parameter
52
43.3
<60=0
Age
16
13.3
>80=2
52
43.3
60- 79= 1
120
100.0
Total
80
66.7
No shock=0
Shock
40
33.3
Tachycardia: Pulse ≥100, Systolic BP ≥100= 1
120
100.0
Total
70
58.3
Any co-morbidities except renal failure, liver failure, and/ or disseminated malignancy=2
It was observed that 46(38.3%) patients had undergone endoscopic variceal ligation (EVL) , and 20(16.7%) patients endoscopic sclerotherapy (EST) .
Heater probe had been used in 5.0% and Gold probe in 5.0% of patients with signs of recent haemorrhage (SRH) . Nevertheless, 48(40.0%) patients had no features of SRH therefore they had not received any endotherapy. Instead they had been managed with IV proton pump inhibitors as per the protocol and supportive treatment.
The data on final EGD diagnosis are shown in table 2.
None of the study cohort patients had undergone surgery to control his or her UGI bleeding and there was no mortality due to UGIB recorded during this period.
In order to test the correlation between Rockall score and age, spearman rho correlation test was carried out and data showed a significant (p<0. 001) moderate positive relationship (correlation coefficient=0. 553) between age and Rockall score of included patients. This means a lower tendency for recurrent bleeding and a lower mortality rate among younger patients.
Discussion
The results of our study showed that hematemesis was the most frequent presenting symptom of UGI bleeding. These results are similar to the study by Minakari et al 11, however, majority of the patients in the above-mentioned study had a peptic ulcer as the commonest aetiology. Contrary to their results portal hypertension outnumbered the peptic ulcer disease as shown in Table 2 in this study. UGI endoscopy had been carried out immediately after admission in 25% of the patients due to ongoing bleeding and the majority of patients had UGI endoscopic examination within 24hrs as shown in Fig1.
Figure 1: Timing of Esophagogastroduodenoscopy (EGD) after hospital admission
While assessing the endoscopy timing especially among variceal bleeding Hsu YC et al 12 concluded that the delayed endoscopy for more than 15 hours , high MELD score, failure of the first endoscopy and hematemesis were independent risk factors for in-hospital mortality in cirrhotic patients with acute variceal haemorrhage. The cirrhotic patients in our study cohort were either Child-Turcotte-Pugh class A or B and none of the patients had hepatic encephalopathy on presentation. After endoscopic therapy, they were managed with standard treatment for variceal bleeding.
The prevalence of H. pylori positivity among UGI bleeding in this study was 60% and all positive patients had been given standard eradication therapy. Data from a different Saudi Arabian centre revealed H. pylori prevalence to the tune of 70% affecting predominantly females in patients with peptic ulcer disease13 but authors had not studied it’s prevalence in UGI bleeding.
This study demonstrated rebleeding in 16 (13. 33%) patients who were re-endoscoped and bleeding was controlled by various endotherapies. In this study re-bleeding was found to be more frequent among older patients with comorbidities. Rebleeding was also common among patients with history of NSAID intake and presence of oesophagal varices which is following literature14. While comparing present results with previous data we observed that previously the commonest cause of UGI bleeding was a duodenal ulcer it is the variceal bleeding due to cirrhosis (HCV) now. We also compared the results of the current study with previous studies across different parts of the globe14,15,16. Duodenal ulcer previously used to be the most frequent cause and invariably various surgical methods like vagotomy etc were used to control bleeding prior to PPI era. However, with the advent of PPI and H pylori eradication the frequency of UGI bleeding due to peptic ulcer have declined.
We recorded only 120 patients with UGI bleeding over three years at our centre nevertheless, this may not reflect the true incidence in the region as it was the data from a single centre only. But the overall incidence of UGI bleeding has decreased over the past decades all over the globe. The study by Loperfido et al17 compared the incidence of 587 patients with UGIB between 1983-1985 and 2002-2004 period. The authors observed that UGI bleeding decreased from 112.5 to 89.8 per 100,000/y. The peptic ulcer incidence also decreased to the half between the two studied periods. In the above-mentioned study it was also revealed that frequency of ulcer bleeding decreased by 41.6% in people younger than 70 years. There has been an obvious change in the trend of UGI bleeding in Saudi Arabia over the past 23 years like other regions of the globe. The number of patients with UGI bleeding has decreased and aetiology of UGI bleeding has also shifted from an ulcer to variceal one.
In a large study, published in 1995 ,the data on 1246 patients over 14 years Al Karawi et al18 observed that duodenal ulcer was the most common cause of UGI bleeding followed by varices. The bleeding rates per annum in their study was 89 cases per annum while this study recorded only 40 admissions of active UGI bleeding per annum. Further, the variceal bleeding outnumbered the duodenal ulcer bleeding contrary to their results connoting a changing trend in Saudi Arabia. The data from southern region of Saudi Arabia also showed variceal bleeding to be the commonest cause of UGI bleeding 19.
In yet another study from Riyadh central hospital, it was revealed that most of the patients with UGI bleeding were having oesophagal varices20. Non cirrhotic portal hypertension (NCPH) was documented in 8 patients in the current study and all were hailing from Egypt which is an endemic region for schistosomiasis and NCPH. The predominant cause of portal hypertension was Chronic liver disease due to chronic HCV in this study. While studying the pattern of liver disease in Saudi Arabia Fashir B et al20 have demonstrated HCV to be the commonest cause of CLD in this part of the globe. This reflects that meticulous screening and treatment of chronic HCV can go a long way in the reduction of UGIB in the region. Having said this it may not be out of place to mention that keeping in view the global epidemic of obesity variceal bleeding due to CLD following NASH may steep up in coming years and become the important cause of UGIB. This highlights a red alert to curb the menace of obesity all over the globe and halt the increasing trend of variceal bleeding in future.
Regarding the trend of gastric ulceration, UGI bleeding has now shifted from H. Pylori infection to the massive use of medications such as NSAIDs or steroids, all over the world16 especially among older people. We demonstrated drug-induced UGI bleeding in 20(16%) patients in this study as shown in table 2. Further the use of warfarin is estimated to increase as the population ages and atrial fibrillation , other cardiovascular ailments are increasing steadily. In a study by McGowan et al22 Tablet Warfarin was an independent predictor of major bleeding after the percutaneous coronary intervention (PCI) in patients receiving dual antiplatelet therapy.
Another most common diseases in the elderly population is Rheumatoid arthritis (RA) . Rheumatoid arthritis is considered as a comorbid disease in the Rockall score and increases the scale for mortality and hemorrhagic shock. The wide use of NSAIDs in RA patients steeps the incidence of peptic ulcers and its complications including UGIB23. This risk is significantly elevated when SSRI medications in combination with NSAIDs are prescribed to allay anxiety and depression in these chronic disorders. The physicians prescribing these medications together should exercise caution and discuss this risk of UGIB with patients24.
UGI bleeding due to malignancies were noted in 4 patients in our study cohort which is similar to the data shown in the southern region of Saudi Arabia19.
In this study, about 12-16% of the patients were diagnosed with either gastric ulcer or hemorrhagic gastritis. The data from Arar, the northern Saudi Arabian city , revealed prevalence of gastric ulcer to be twice as common as duodenal ulcer. The authors of this study observed that the use of NSAIDs, H. Pylori infection and stress were among the most relevant reasons for developing peptic ulcer disease , however authors in their study didn’t study bleeding complications of peptic ulcer disease25.
Conclusion
Based on discussed results, it can be concluded that the frequency of UGI bleeding has declined and peptic ulcer is no longer the most predominant cause of UGI bleeding in Saudi Arabia. Instead, variceal bleeding outnumbers other causes of UGIB. This changing trend now demands that to prevent variceal bleeding we need to focus on the management of chronic HBV, HCV and NASH. Further all medications especially NSAIDs must be cautiously used particularly in elderly people. A step further would be to control hypertension and subsequent atrial fibrillation so that drug-induced UGI bleeding are reduced in future.
Colorectal cancer is the fourth most common cancer in the United Kingdom (UK), and accounts for 10% of all cancer deaths.1 The symptoms of colorectal cancer are often non-specific and in its early stages there may be no symptoms at all. Survival is directly linked to stage of disease at diagnosis – five-year survival falls from 98% for stage I disease down to 40% for stage IV disease.2
Thirty percent of all colorectal cancers are diagnosed via the ‘Two-Week Wait’ (2WW) referral route in the UK. The remainder are diagnosed following emergency presentation (24%), non-2WW GP referral (24%), bowel cancer screening (9%) or by other pathways (13%).3
The TWW referrals for patients with suspected cancer were introduced in 2000 by the NHS Cancer Plan,4 and built on the earlier recommendations of the Calman-Hine report into commissioning cancer services.5 These improvements sought to address the United Kingdom’s relatively low cancer survival rates compared to the rest of Europe, and to address the delays in diagnosis and treatment that some patients were encountering. In order to standardise cancer care nationally, 2WW referral guidelines were introduced by the Department of Health in 2000.6 These guidelines were reviewed and updated in 2005 by the National Institute for Clinical Health and Care Excellence (NICE).7
In November 2015, NICE updated all its 2WW referral guidelines, including those for suspected colorectal malignancy.8 The recommendations were developed following a systematic review of the literature which recommended referral for patients with symptoms deemed to have a positive predictive value for colorectal cancer of 3% or more. This was a reduction from the previous guidelines, which used a positive predictive value of greater than 5%.9 The original (2005) and updated (2015) NICE colorectal 2WW referral guidelines are outlined in Table 1.
This study measured the effect of the change in colorectal 2WW referral guidelines on the following outcomes:
Volume of referrals to the colorectal 2WW clinic
Rate of detection of colorectal cancer
Rate of detection of non-colorectal cancer
Adherence to the 2WW referral guidelines
Table 1. Summary of the 2005 and 2015 NICE Two-Week Wait referral guidelines for suspected colorectal cancer 7,8
2005 Criteria
2015 Criteria
Age >40 with rectal bleeding and a change in bowel habit for >6 weeks
Age >40 with unexplained weight loss and abdominal pain
Age >60 with rectal bleeding without a change in bowel habit for >6 weeks
Age >50 with unexplained rectal bleeding
Age >60 with change in bowel habit without rectal bleeding for >6 weeks
Age >60 with change in bowel habit or iron-deficiency anaemia
Right lower abdominal mass consistent with involvement of the large bowel
Positive faecal occult blood test
Palpable rectal mass (intra-luminal)
Palpable rectal or abdominal mass
Unexplained iron deficiency anaemia in: non-menstruating Women with an Hb <10g/100mL men with an Hb <11g/100mL
Age <50 with rectal bleeding and one of: abdominal pain change in bowel habit weight loss iron-deficiency anaemia
Methods and materials
We undertook a retrospective analysis of referrals to the colorectal 2WW service at a large inner city teaching hospital (Bristol Royal Infirmary, UK). All the patients referred in two-month periods before (July to August 2015) and after (July to August 2016) were included in the study. The referral guidelines changes were identified and their clinical notes were reviewed. The specific variables recorded for each referral included: age, gender, presenting symptoms and signs and subsequent diagnosis. All records were cross-referenced against the regional cancer registry.
Differences between the two groups were assessed for statistical significance using Chi-Squared and unpaired T-tests. Count data was assessed for significance using the Poisson Means test at a 95% confidence interval. Statistical tests were calculated using the MEDCALC statistical software.
Results
A total of 193 and 268 patients were referred in each of the two study periods. The data collection was complete for all patients. The demographics, referral data, and cancer detection rates are summarised in Table 2.
There was a significant increase in the volume of patients referred via the 2WW pathway following the change in the guidelines (193 vs. 268, p<0.01). There was no significant change in the rate of colorectal cancers detected (8.3% vs. 7.5%, p=0.75).
There was no significant difference in the rate of detection of any cancer (including colorectal cancer) following the 2WW referral (11.4% vs 10.8%, p=0.83). The non-colorectal cancers detected (15 in total) were predominantly metastatic cancers; from lung, ovarian, or prostatic primary malignancies. There was no significant difference in the detection rate of non-colorectal cancers (3.1% vs. 3.4%, p=0.85).
The rate of compliance to the referral guidelines was significantly higher following the update in referral guidelines (72% vs 89%, p<0.01).
In the second study period (July - August 2016), there was a sub-group of 31 patients whose referrals met the new (2015) referral guidelines, but who would not meet the previous (2005) referral guidelines. The mean age in this group was 58.5 and none of these patients had a cancer detected following the 2WW referral.
Table 2. Summary of the results
Jul-Aug 2015
Jul-Aug 2016
p value
Patients referred
193
268
<0.01 a
Cancers detected (% of total)
22 11.4%
29 10.8%
0.74 a 0.83 b
Colorectal cancers (% of total)
16 8.3%
20 7.5%
0.58 a 0.75 b
Non-Colorectal cancers (% of total)
6 3.1%
9 3.4%
0.61 a 0.85 b
% of referrals compliant with the guidelines (at that time)
72%
89%
<0.01 b
Mean age in years (Median age, range)
68.2 (69, 24-92)
67.9 (69, 22-93)
0.81 c
Sex ratio (M : F)
43 : 56
46 : 53
Frequency of referral signs/symptoms (%)
Change in bowel habit
60
63
0.51 b
Rectal bleeding
33
39
0.18 b
Abdominal pain
37
33
0.37 b
Unexplained weight loss
22
20
0.60 b
Iron deficiency anaemia
27
22
0.21 b
Statistical test used: a Poisson Means Test, b Chi squared test, c Unpaired t-test
Discussion
This study has shown that the volume of patients being referred to the colorectal 2WW service has significantly increased in a large inner city unit following the update to referral guidelines in 2015. A significantly greater proportion of referrals are compliant with the new guidelines compared with the previous guidelines. Despite this, we found no significant change in the rate of colorectal cancer detection. Our colorectal cancer detection rates following 2WW referral are similar to the published data series (6-14%).10,11,12
The factors contributing to the increased referral rate includes removal of time constraints and referral for symptoms not previously included within the guidelines (e.g. abdominal pain, unexplained weight loss). The updated guidelines are subsequently less specific and use signs and symptoms with a lower positive predictive value for colorectal cancer than previously.8
In their costing statement for the new guidelines, NICE acknowledge that the updated guidelines are likely to increase referral volumes. The justification given is that “benefits are anticipated from earlier diagnosis of cancer”.9 This study challenges that supposition – no cancers were detected in the latter group of 31 patients whose referrals met the new guidelines, but would not have met the old referral guidelines.
Studies prior to the update in guidelines have also challenged the view that 2WW referrals lead to earlier detection of cancer. When compared with ‘non-2WW’ outpatient referrals, patients referred via a 2WW pathway had no significant difference in the stage of disease at diagnosis,13,14 nor any significant difference in the related outcomes such as 2-year survival,15,16 5-year survival,15,17 or proportion undergoing curative surgery.14,15
Bowel cancer screening remains the only method with a strong evidence base for detecting colorectal cancers at an earlier stage.18 Cancers detected in this manner are disproportionately lower in stage,19 and are associated with a significant reduction in mortality.20 This study did not assess the impact of screening on cancer detection rates via the 2WW referral process, although the logical effect of increased detection of cancers via screening would be a proportional fall in cancers detected by other routes, including the 2WW pathway.
The findings of this study appear to challenge the anticipated benefits of the new 2WW referral guidelines. A group of patients were identified whose referrals only met the 2015 guidelines; these referrals would have been deemed inappropriate by the 2005 guidelines. This group of patients were generally younger and none went on to a cancer diagnosis. If other units (or multi-centre studies) corroborate these findings then this should prompt urgent review of the 2WW guidelines with regards to cancer stage at diagnosis and longer term outcomes.
Conclusion
The updated 2WW referral guidelines for suspected colorectal cancers have increased the volume of patients being seen via the 2WW service without increasing cancer detection rates. This is anticipated to have secondary effects on waiting times for routine and endoscopic services; this has not been evaluated in this study. Further research is needed to contextualise all of these findings with cancer detection rates via screening and other non-2WW routes to diagnosis.
To identify risk factors predicting readmission of neonates within 7 days of birth and to implement guidelines to reduce this.
METHOD
All babies less than 1 week old either admitted to, or assessed at paediatric unit at Crosshouse hospital, Kilmarnock between July 2006 and December 2006 were included. Data was analysed on birth weight, gestation, age at discharge from maternity unit, age at admission to Crosshouse hospital, source of referral, problems necessitating referral, feeding, interventions, and length of stay.
RESULTS
We managed to obtain case notes for 50 babies out of the 55 who were admitted during this time. 44 babies (88%) were discharged from maternity unit within 48 hrs of birth and 23 babies (46%) were discharged from maternity unit within the first 24 hrs. Poor feeding/weight loss and physiological jaundice accounted for majority of admissions. Further poor feeding and weight loss were more common in first borns, in early discharges and in breast-fed babies.
RECOMMENDATIONS
Mothers deciding to breast-feed babies need proper support. It may be a good idea to delay discharge check until 24 hours after birth. First time mothers are especially naive when it comes to breast-feeding and it is important that they get properly supervised.
It may be a good idea to request mothers to fill in a questionnaire prior to discharge regarding how confident they feel about feeding their child, any feeding concerns, any other concerns etc.
ABBREVIATIONS
AMU: Ayrshire Maternity unit
CMW: Community mid wife
INTRODUCTION
The length of post partum stay in hospital has been steadily declining over the past 50 years.1,2 Reducing the number of days in the hospital after birth has several advantages like helping mother and infant recover in a familiar home environment; decreasing the risk of iatrogenic infections and cutting down on hospital costs. However, concerns have also been expressed about potential disadvantages of early discharge: For example breastfeeding is not established until the third or later postpartum day; a number of conditions do not manifest themselves until two or more days after the delivery.3 In a large study on neonatal mortality done in Washington (retrospective study looking at 47879 births between 1989 and 1990), it was found that neonates discharged before 30 hrs of age had a significantly higher mortality in the first month and first year of life than those neonates who were discharged later.4 In the United States, this has prompted the introduction of legislation making minimum 48 hour postpartum hospital stay mandatory. Through our audit, we aimed to identify risk factors predicting readmission and to implement local guidelines to reduce readmission rates.
METHOD
All babies less than 1 week old either admitted to, or assessed at paediatric unit at Crosshouse hospital, Kilmarnock between July 2006 and December 2006 were included. It was a retrospective study. List of patients was available from Medical records and paediatric case notes were obtained from medical records. The neonatal case notes were obtained from neonatal secretaries at AMU.
55 babies were admitted during this time out of which we managed to obtain paediatric and neonatal case notes for 50 babies. Data was analysed on birth weight, gestation, age at discharge from AMU, age at admission to Crosshouse hospital, source of referral, problems necessitating referral, feeding, interventions, and length of stay.
RESULTS
Most of the referrals were generated from community midwives who are often the first point of contact for neonates discharged from maternity unit (Table 1)
Source of referral (Table 1)
Source of referral
Number of babies
CMW
39
GP
5
A&E
4
Self
2
Total
50
We looked at the problems necessitating admission (Table 2). Please note that babies had more than one problem. Hence the higher numbers!
It is obvious looking at the numbers that most of the admissions are secondary to poor feeding and weight loss, majority of which could have been prevented.
Problems necessitating admission (Table 2)
Problems
Number of babies
No of babies in whom this problem was noted in AMU
Poor feeding
20
7
Wt loss >10%
18
0
Physiological jaundice Requiring phototherapy
14
1 (SBR was below treatment line)
Physiological jaundice Not requiring phototherapy
8
1
Choking episode
5
1
ABO incompatibility Requiring phototherapy
1
0 (No DCT done)
Pseudo menstruation
2
0
? Reflux (Blue episode)
1
1 (Not reported to staff)
Central posterior cleft palate
1
0 (Discharge check at 2 hrs)
? abnormal breathing (Normal baby on examination)
1
0
Mucous retention cyst under tongue
1
0
Not opened bowels for 48 hrs
1
0
Unable to abduct hip
1
0
Traumatic fat necrosis R side of face
1
0
CMW error in recording weight
1
NA
Fever? Viral illness
1
0
We also reviewed the age at readmission (Table 3). It is obvious that most readmissions were after the 3rd day of life. Most readmissions were related to poor feeding, weight loss > 10%, physiological jaundice and it is to be expected that most of the times; these problems would not become very obvious until around 3-4 days after birth.
Age at readmission (Table 3)
Age at admission
Number of babies
< 24 hrs
1
24-48 hrs
3
48-72 hrs
7
72-96 hrs
16
>96 hrs
23
Total
50
We also analysed the age when discharge check was done at the maternity unit
(Table 4). 44 babies (88%) were discharged from maternity unit within 48 hrs of birth and 23 babies (46%) were discharged from maternity unit within the first 24 hrs. Age at discharge check was important as there was an association found between early discharge from AMU and subsequent readmission with feeding difficulties especially among breast fed babies (Table 4). Also studies have shown that mothers with 1 day hospital stays post delivery are less satisfied with their length of stay.1
Age at which discharge check was done at AMU and subsequent admissions with poor feeding (Table 4)
Age at discharge check
Number of babies
Subsequent admissions with poor feeding
Breast fed
<12 hrs
11
3
2
12-24 hrs
12
8
7
24-36 hrs
15
3
3
36-48
6
3
2
48-60
6
2
2
>60 hrs
0
1
1
Total
50
20
17
Also an important association was noted between poor feeding and first time mums. Out of the 20 babies with poor feeding, 16 were born to first time mothers.
Also looking at the table below (Table 5), it is clear that feeding problems and wt loss were much more common in breast fed babies. The association between readmission and first born children, breast feeding has been shown in studies.5
Table 5
Mode of feeding
No of babies admitted with poor feeding and/or wt loss
Breast feeding
26
Bottle feeding
3 (One of whom had a cleft palate)
We also looked at relationship between birth weight and risk of readmission (Table 6) and also gestational age and risk of readmission (Table 7). There was no clear association between birth weight and readmission or between birth weight and feeding problems. Also there was no association noted between gestational age and risk of readmission in the first week of life. A likely explanation for these findings would be that infants with low birth weight or gestational age less than 37 weeks were probably less likely to be discharged early from the maternity unit.6
Birth weight and readmission (Table 6)
Birth weight as centile
Number of readmissions
Number with feeding problems
<3rd
0
0
3-10
12
5
10-50
12
5
50-90
16
8
90-97
8
2
>97th
2
0
Total
50
20
Gestational age and readmission (Table 7)
Gestational age
Readmission
<37 weeks
5
37-40 weeks
29
>40 weeks
16
Total
50
We also analysed data on length of admission in paediatric ward. 32 out of 50 admitted babies (64%) stayed less than 24 hrs (Table 8). 10 out of 50 admissions needed reassurance only (20%) but the remaining needed some form of intervention (Table 9)
Length of stay (Table 8)
Total length of stay
Number of babies
<12 hrs
13
12-24 hrs
19
24-36 hrs
7
36-48 hrs
7
48-60 hrs
4
Total
50
Interventions needed on readmission (Table 9)
Intervention
Number of babies
Help with feeding/ Change of feeding
22
Blood tests
35
Phototherapy
15
Reassurance only
10
Referral to other specialties
2
IV fluids
5
IV antibiotics
2
Folic acid supplements
1
ECG
3
Babies needing follow up and readmission (Table 10)
Readmission
2
Follow up in day unit
8
Follow up in clinic
4
Total
14
CONCLUSIONS:
Poor feeding and weight loss accounted for majority of the admissions. (Table 2)
The above problems occurred more commonly in breast fed babies. 90% of babies admitted with poor feeding and/or weight loss were breast-fed babies (Table 5).
Out of the 20 babies with poor feeding, 16 were born to first time mothers.
44 out of 50 babies who were readmitted had been discharged from maternity unit within 48 hrs of birth. There was a clear association between early discharge from maternity unit and subsequent readmission with feeding problems especially in breast fed babies. (Table 4). 11 out of 20 babies admitted with feeding problems (55%) were passed fit for discharge from AMU within 24 hours of birth. Again 12 of them were babies whom their mothers wanted to breast-feed. This raises the question of whether breast-feeding mothers are receiving sufficient support and whether the babies were being discharged too early. Also when these babies were subsequently admitted, many mothers decided to bottle feed despite being offered help with breast feeding. A bottle fed baby in whom a cleft palate was missed had a discharge check done when she was 2 hrs old!! Clearly not sufficient time to establish that she was feeding well!
7 out of 20 babies who were admitted with poor feeding were noted to have feeding difficulty while in AMU (Table 2). When these babies were passed fit for discharge, this would have probably given a false sense of reassurance to mothers especially the first time mums. These mums were less likely to report feeding problems to CMW leading to delayed referrals (Table 3) by which time the babies would have lost a lot of weight necessitating interventions like blood tests, IV fluids etc.
There was no association found between birth weight or gestational age and risk of subsequent readmission (Tables 6 and 7).
Physiological jaundice was the third most common problem necessitating admission (Table 2). Only 2 of the babies in this group were noted to be jaundiced in AMU.
Surprisingly parental pressure for early discharge from AMU was documented in only one neonatal notes suggesting that this might not have been an important factor causing early discharge.
For 10 of the admissions, reassurance was all that was needed but the remaining 40 needed some form of intervention (Table 9).
RECOMMENDATIONS:
Delay discharge check until 24 hours after birth: Mothers deciding to breast feed babies need proper support. It may be a good idea to delay discharge check until 24 hours after birth. This will not only give sufficient time for the mothers to familiarise with breast feeding but also provide staff the opportunity to detect any potential feeding problems.
First time mothers to be properly supervised: First time mothers are especially naive when it comes to breast-feeding and it is important that they get properly supervised.
Request mothers to fill in a questionnaire: It may be a good idea to request mothers to fill in a questionnaire prior to discharge regarding how confident they feel about feeding their child, any feeding concerns, any other concerns etc. The physical, psychological and social well being of mother and newborn must be assessed when discharge planning takes place.7
Policy to transfer babies back to AMU: For babies readmitted in whom the only problem identified on assessment in paediatric ward is poor feeding, there should be a policy to transfer babies back to AMU for breast feeding training and support. This will not only persuade mothers to persevere with breast feeding but will also have a direct impact on reducing early discharges from AMU.
Re audit: The above recommendations to be implemented after discussion with staff at AMU and the audit will be repeated to see if this has resulted in a decrease in neonatal readmissions.
COMPETTING INTERESTS
None Declared
ACKNOWLEDGEMENTS
Dr Bridget Oates, Consultant Paediatrician, Crosshouse hospital for her invaluable support and guidance throughout, Dr Sheena Kinmond, Consultant Paediatrician, Crosshouse hospital, staff at medical records and neonatal secretaries at AMU.
AUTHOR DETAILS
FAHEEM MAZI KOTWAL, MBBS, MRCGP, GP registrar, Ayrshire, United Kingdom
CORRESPONDENCE: Dr F Mazi Kotwal, GP registrar, Riverside Medical Practice, 27 Dalvennan Avenue, Patna KA6 7NA
Email: faheemkotwal@yahoo.co.uk
REFERENCES
1. Jill M. Klingner, Leif I. Solberg, Susan Knudson-Schumacher, Richard R. Carlson, Karen L. Huss. How Satisfied Are Mothers with 1-Day Hospital Stays for Routine Delivery? Effective Clinical Practice, November/December 1999.
2. CDC. Trends in length of stay for hospital deliveries -- United States, 1970-1992. MMWR 1995;44:335-7
3. Danielsen B , Castles AG, Damberg CL, et al. Newborn discharge timing and readmissions: California, 1992–1995. Pediatrics 2000;106:31–9
4. Malkin J,Garber S, Broder M S, and Keeler E,. Infant Mortality and Early Postpartum Discharge Obstet Gynecol 2000;96(2):183-8.#
5. M. B. Edmonson, J. J. Stoddard and L. M. Owens. Hospital readmission with feeding-related problems after early postpartum discharge of normal newborns. Vol. 278 No. 4, July 23, 1997 JAMA
6. Oddie et al Early discharge and readmission to hospital in the first month of life in the Northern Region of the UK during 1998: a case cohort study. Arch. Dis. Child. 2005;90:119-124.
7. Cargill Y, Martel M; Postpartum maternal and newborn discharge: J obstet Gynaecol can 2007;29(4):357-359
The effectiveness and quality of care for patients is largely dependent on communication between physicians both in secondary care and in primary care. Written communication between secondary and primary care in the form of a discharge summary is vitally important for informing General Practitioners (GPs) and other healthcare professionals of the details regarding patients’ admission into hospital, as well as ensuring there is continuity of care in the community. Discharge summaries are often the only form of communication that occurs at the transition between secondary and primary care.
Prior to discharging patients from hospital, a discharge summary (whether this be hand written or typed) is required to be completed. Ideally copies are kept in patient files and given to the patient, as well as forwarding a copy to the GP. Correctly completing all relevant sections on a discharge summary is part of good medical practice, Clinical Governance and hospital/patient documentation.
Historically, discharge summaries have been found to be poorly written, contain inaccurate and ineffective information. Several studies have identified areas which are lacking in discharge summaries when looking at the quality of the discharge summary. These include: inadequacies of medical evaluation, level of experience of the discharge author and accuracy. Subsequently, there has been a general move towards electronic discharge summaries with a standard format.
In April 2005, Newham University Hospital Trust (NUHT) began using the Cerner Millennium Electronic Patient Record (EPR) system. This electronically stores information about a patient, for example discharge summaries, previous blood results, imaging results etc. It is intended that all discharge summaries are typed directly onto this computerized system. The summaries are then available to view by all authorized parties anywhere in the hospital. This system has the advantage of enabling access to portions of a patient’s medical record whilst waiting for patients’ old notes. Furthermore, more information can be added to the discharge summaries contemporaneously or even after the point of discharge. Table 1. Shows some advantages and disadvantages of EPR vs paper discharge summaries.
Advantages of EPR over a paper-bases system
More information included
Do not need to later type or dictate a formal letter
Permanent electronic record
Available immediately
Always legible
Full details with GP at time of discharge
Allows more accurate clinical coding
Disadvantages of EPR
Takes longer to complete than a paper summary
AIMS AND OBJECTIVES
This study assessed the quality of discharge summaries completed by medical specialties at Newham University Hospital Trust using the EPR system. The aim was to identify any problems and where they are occurring. The information gained would help in addressing any problems identified, to improve the quality of discharge summaries.
METHODS
I had an in-depth discussion with my supervisor about the feasibility, methodology, data collection, patient confidentiality, ethics and relevance of this audit to the Hospital.
I undertook a thorough literature search in Medline and other internet searches, reviewed the Journals in NUHT Library for similar audits which looked at the quality of discharge summaries.
A sample of 100 Medical (respiratory, endocrine and gastroenterology) and Care of the Elderly (CoE) discharge summaries of patients from NUHT were retrospectively audited. The hospital Audit Department provided me with the names of the last 100 patients who had been discharged from Medicine and CoE during October 2007. These were sequential discharges, not selected at random. We did not analyze any patients from the specialties of Surgery, Gynaecology, Paediatrics, Cardiology or Emergency Medicine.
After obtaining the names, the discharge summaries were analysed and information was collected on the following fields:
Name of Consultant on the discharge summary sheet
Which team the consultant belonged to: Medical, CoE or A&E
If the discharge consultant was correct
If date of admission had been completed
If date of discharge had been completed
If the patient was given a diagnosis
If a follow up appointment was suggested and what type of follow up this was (GP or NUHT or another hospital)
If a follow up appointment had been made
If the discharge summaries had been signed and bleep number provided
This data was then tabulated using simple statistical analysis (mainly descriptive) and the results calculated into a percentage.
The names of the consultants on the discharge summaries were divided into Medical, Care of the Elderly and Accident & Emergency. The medical team was further divided into team A, B and C, according to the specialty they worked under, for example Team A: endocrine, team B: gastroenterology, and team C: respiratory medicine. By dividing the consultants under different teams allowed me to confirm if they were the right consultant. A&E was included into this field as many discharges still have A&E consultants on them despite the patients being admitted to hospital.
This audit did not address the following issues:
1. If the GP is correct
2. If the GP received the summary
3. If the GP made follow up arrangements post discharge
4. The accuracy of the diagnosis
5. If the patient has more than one electronic medical records
RESULTS
The examination of 100 medical records yielded 94 discharge summaries available for audit, leaving 6 medical records with no evidence of a discharge summary.
As mentioned above, the consultants on the discharge summary were divided into the following categories. The number beside them represents how many discharge summaries belonged to each respective team.
Care of the elderly team: 46
Adult medicine: 36
A&E: 9
Other: 3
It was found that 57(60.6%) of the discharge summaries contained the correct consultant name. However, on 22(23.4%) of the discharge summaries it was unclear if the discharge consultant was correct.
From the 96 discharge summaries completed, every single summary had an admission date on it, however, only 75(79.8%) of discharge summaries had a discharge date.
Seventy five (79.8%) of discharge summaries had been signed by the author (with their name), but only 71(75.5%) had wrote their bleep number.
Sixty five (69.1%) summaries were identified to have a diagnoses under the heading of acute problems, whereas only 22(23.4%) had only symptoms. The remaining 13 (13.8%) summaries had no diagnosis or symptoms completed.
Finally, when analyzing the discharge summaries regarding follow up arrangements, 91(96.8%) discharge summaries had a follow up suggested, of which 27(29.7%) were to be followed up by GP, 59(64.8%) were to be followed in NUHT and 5 patients were to be followed up at another hospital.
Of the discharge summaries which had follow up arranged in NUHT, only 40(67.8%) patients had a follow up appointment made.
DISCUSSION
This study supports previous studies, confirming that a new approach to discharge summary completion is required. One of the main problems identified in this summary, was the use of incorrect consultants on the discharge summary. The current method used is clearly not effective; therefore it is important that the author completing the discharge summary ensures that the correct consultant is on the summary.
Changing the Consultant name on the discharge summaries is of great importance because this means that GPs are able to refer patients back to the correct consultants when seeking advice or trying to arrange further follow up with that consultant. Furthermore, it allows the appropriate National Health Service (NHS) funding to be given to the relevant department.
It was unclear in 22 discharge summaries if the discharge Consultant was correct. This was partly due to the fact that several discharge summaries had no author name or bleep number. By documenting your name and bleep number on a discharge summary, is not only accessible to physicians in primary and secondary care, but also to hospital pharmacist, in case they need to contact you when medication needs to be amended.
The second important problem identified in this study, was the lack of follow up appointments made, despite having it requested on the discharge summary. Of the patients that had follow up appointments suggested at NUHT, only 40(67.8%) patients had follow appointments made, which meant that 19(32.2%) patients had no appointment made. The only possible explanations for this may be that I started analyzing the patient summaries and follow up appointments too early post discharged, therefore not allowing enough time for the appointments to be made, or perhaps the appointments are simply not being made.
As this study did not look to see whether follow appointments with GPs had been made, we are unable to comment on this. However, previous studies have shown that follow up appointments are not always made with the GPs post discharge. As a result, the percentage of patients actually receiving a follow up post discharge from hospital may be lower than anticipated.
The third problem this study identified was the lack of discharge dates on the summaries. Having the discharge date on discharge summaries is not only important for hospital doctors but its of vital importance for GPs, as it provides them with information about how long a patient remained in hospital, and the severity of their illness. For example, if a patient was discharged from hospital after 2 days with an Asthma Exacerbation, we can assume that the severity of their exacerbation was not too severe. However, if the same pt remains in hospital for 15 days, this gives us more information about the severity of their exacerbation.
The fourth problem demonstrated in this study, was the infrequent number of diagnoses entered under the acute problems section in the discharge summaries. Only 65 (69.1%) summaries were identified to have a diagnoses, 22(23.4%) summaries had symptoms only. The remaining 13 (13.8%) summaries had no diagnosis or symptoms completed. It is important to document diagnosis or symptoms as it allows accurate medical coding. It is also often difficult to fathom why a patient was admitted to hospital even after reading the entire discharge summary. Furthermore, the benefit of accurate clinical coding is accurate payment for the services provided by the hospital.
The final problem which needs to be addressed is the completion of a discharge summary for all patients that have been admitted to hospital. This study found that 6 medical records showed no evidence of a discharge summary. One possible explanation for this would be if a patient had self discharged from the hospital, and not been formally discharged by a team or if a patient had died. However, in this case it is still important that a discharge summary is completed. A GP will still need to know why a patient was admitted and why they self discharged
CONCLUSION
It is clear from this study that there needs to be more robust processes put in place to ensure accurate recording of data on the information sent out to General Practitioners. Medical Practitioners completing the summaries should be encouraged to ensure that all fields on the discharge summary are adequately completed in order for us to reap the benefits.
Poor communication in the discharge summaries impacts poorly on patient care and increases the costs to the NHS due to increased rates of readmission into hospital. We can recognize this as a major problem confronting the NHS and so completing discharge summaries in full can help reduce his burden.
RECOMMENDATIONS
A number of recommendations have been identified and include:
The need to raise the awareness of this problem amongst hospital colleagues including Clinical Governance and Audit department with the objective to improve the quality of the summary. The preferred format may be a presentation or advisory email.
For consultants to communicate with junior doctors on a regular basis and go through their discharge summaries, highlighting areas of improvement. This is currently done by some medical teams at NUHT.
For the author of the discharge summary to ensure the correct consultant name is on the discharge summary.
All medical teams should complete a discharge summary regardless if a patient has self discharged or died.
To relay this information back to the ward clerks and ensure that they understand the importance of making follow up appointments as soon as they have been given a discharge summary.
A repeat audit should be performed in 12 months to look for improvements in the data completion.
CONFLICT OF INTERESTS None declared
ACKNOWLEDGMENTS The author would like to thank Dr T. O’Shaughnessy, Medical Student Umair Mohammed, Dr David Ward, and the Audit Department for all their help and support
AUTHOR DETAILS SYEDA M. B. KAZMI, Foundation Year 2 Trainee, Barts and The London School of Medicine and Dentistry, Queen Mary University of London, London, United Kingdom
CORRESPONDENCE: DR S M B Kazmi, 15 Kevelioc Road, Tottenham, London, N17 7PR
Email: mar1amkazmi@hotmail.com
REFERENCES
Mann R and Williams J. Standards in medical record keeping. Clinical medicine. 2003 jul-Aug; 3 (4): 329-32
Paterson JM, Allega RL. Improving communication between hospital and community physicians. Feasibility study of a handwritten, faxed hospital discharge summary. Discharge Summary Study Group. Can Fam Physicians. 1999 Dec; 45: 2893-9
Wilson S, Ruscoe W, Chapman M, Miller R. General practitioner –hospital communications: a review of discharge summaries. Journal of Quality in Clinical Practice. 2001 Dec; 21(4): 104-8
Foster DS, Paterson C, Fairfield G. Evaluation of immediate discharge documents–room for improvement? Scott Med J. 2002 Aug; 47(4): 77-9
Garasen H and Johnsen R. The quality of communication about older patients between hospital physicians and general practitioners: a panel study assessment. BMC Health Services Research. 2007 Aug24; 7: 133